

Novel AAV capsids for intravitreal gene therapy of photoreceptor disorders
- PMID: 33616280
- PMCID: PMC8033523
- DOI: 10.15252/emmm.202013392
Novel AAV capsids for intravitreal gene therapy of photoreceptor disorders
Abstract
Gene therapy using recombinant adeno-associated virus (rAAV) vectors to treat blinding retinal dystrophies has become clinical reality. Therapeutically impactful targeting of photoreceptors still relies on subretinal vector delivery, which detaches the retina and harbours substantial risks of collateral damage, often without achieving widespread photoreceptor transduction. Herein, we report the development of novel engineered rAAV vectors that enable efficient targeting of photoreceptors via less invasive intravitreal administration. A unique in vivo selection procedure was performed, where an AAV2-based peptide-display library was intravenously administered in mice, followed by isolation of vector DNA from target cells after only 24 h. This stringent selection yielded novel vectors, termed AAV2.GL and AAV2.NN, which mediate widespread and high-level retinal transduction after intravitreal injection in mice, dogs and non-human primates. Importantly, both vectors efficiently transduce photoreceptors in human retinal explant cultures. As proof-of-concept, intravitreal Cnga3 delivery using AAV2.GL lead to cone-specific expression of Cnga3 protein and rescued photopic cone responses in the Cnga3-/- mouse model of achromatopsia. These novel rAAV vectors expand the clinical applicability of gene therapy for blinding human retinal dystrophies.
Keywords: achromatopsia; intravitreal delivery; novel AAV; retina.
© 2021 The Authors. Published under the terms of the CC BY 4.0 license.
Conflict of interest statement
S.M. and M.B. are co‐founders of the gene therapy company ViGeneron GmbH who owns the rights on the related patent application WO/2019/076856 covering the novel rAAV capsids. All other authors declare no conflict of interest.
Figures
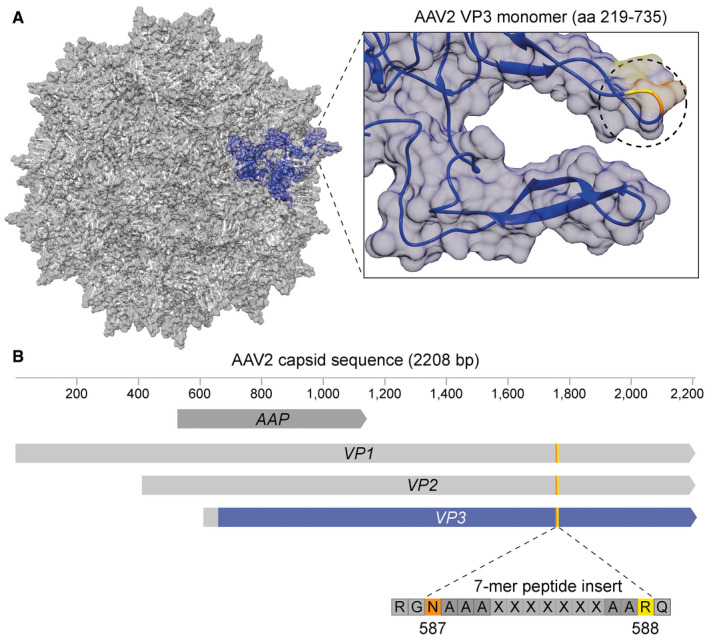
Depiction of the parental AAV2 capsid structure (PDB 6IH9) with a single VP3 monomer (amino acids (aa) 219–735) coloured blue. On the right, the blue monomer is shown in focus and the unmodified insertion position I‐587 is circled with the residues N587 and R588 highlighted in orange and yellow, respectively.
Schematic of AAV2 capsid sequence with the constituent genes, i.e. assembly activating protein (AAP) and viral protein (VP) 1–3. The part of VP3‐coloured blue represents the sequence of the structural monomer depicted in (A) with the same colour. The orange/yellow line in VP3 and schematic below indicate the site of insertion of the random 7‐mer peptides between N587 (orange) and R588 (yellow) flanked by alanine linkers.
- A
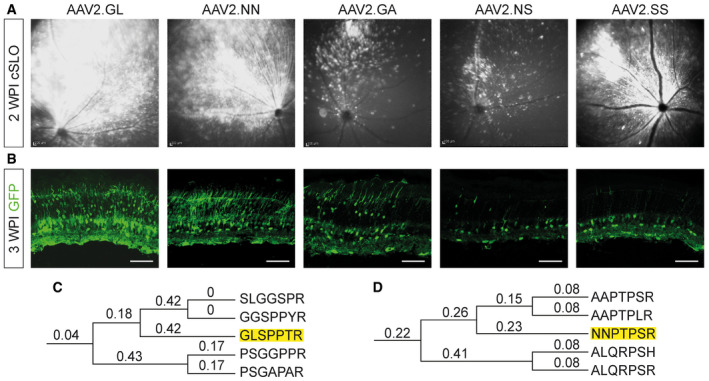
cSLO reporting transduction and spread of vectors in the murine retina after 2 WPI.
- B
Confocal scans of native eGFP fluorescence after 3WPI. Scale bar: 50 μm. Acquisition settings were kept constant for all samples. GFP = eGFP.
- C, D
Phylogenetic tree of a selection of AAV variants detected via NGS in the cone (C) and rod (D) DNA from screening round 3. The amino acid sequences of peptide inserts were aligned, and a phylogenetic tree was constructed using the maximum likelihood method. Numbers indicate bootstrap values, and the peptides corresponding to AAV2.GL and AAV2.NN are highlighted.
- A
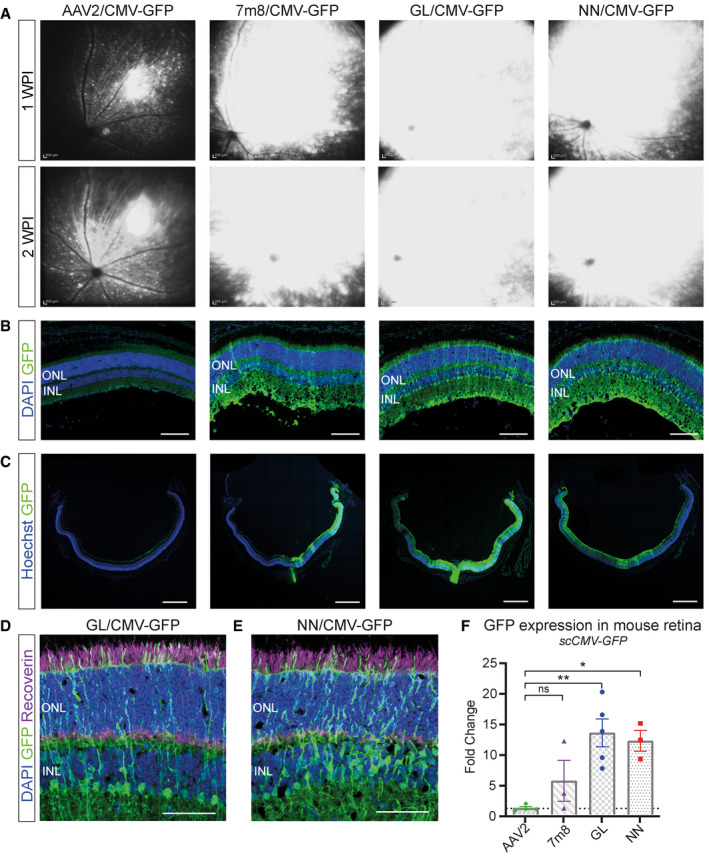
In vivo cSLO examinations of the mouse retina at 1‐ and 2‐week post‐injection (WPI) of 2E9 total vg (in 1 µl) of sc‐CMV‐eGFP packaged with parental serotype AAV2, state‐of‐art AAV2.7m8, novel AAV2.GL and AAV2.NN capsid variants.
- B
Confocal scans of retinal cross sections immunolabelled for eGFP and DAPI. Acquisition settings were kept constant for all samples. Scale bar: 100 μm.
- C
Confocal tile‐scans of retinal cross sections immunolabelled for eGFP and Hoechst. Scale bar: 500 μm.
- D, E
Immunolabelled cross sections of mouse retina infected with AAV2.GL and AAV2.NN, respectively, with focus on the ONL and INL, stained for eGFP, recoverin and DAPI. Scale bar: 50 μm.
- F
qRT–PCR data comparing fold change in eGFP transcript levels from retinal samples infected with capsid variants AAV2.7m8, AAV2.GL and AAV2.NN compared with AAV2. Biological replicates n ≥ 3. Bars show mean ± SEM. One‐way ANOVA was performed with post hoc Holm–Sidak multiple comparisons test. *P ≤ 0.05, **P ≤ 0.01.
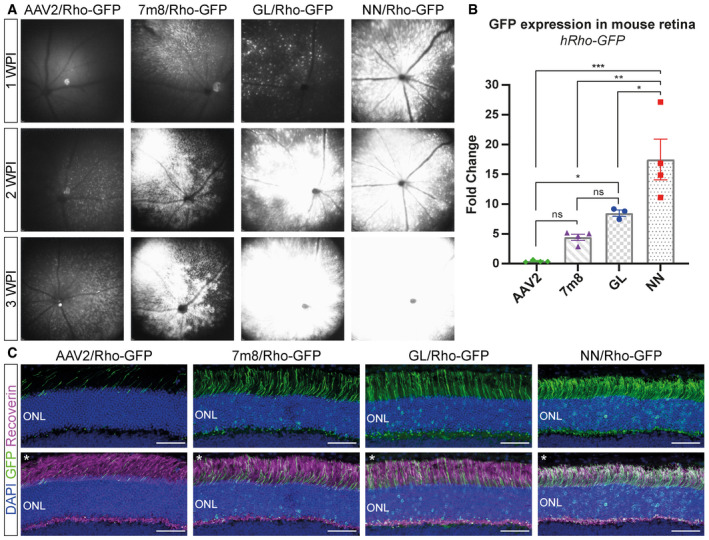
In vivo cSLO examinations of the mouse retina at 1‐, 2‐ and 3‐week post‐injection (WPI) of 8E9 total vg of ss‐hRho‐eGFP packaged with parental serotype AAV2, state‐of‐art AAV2.7m8, novel AAV2.GL and AAV2.NN capsid variants.
qRT–PCR data comparing fold change in eGFP transcript levels relative to ITR2 amplicons from retinal samples infected with all four capsid variants. Biological replicates n ≥ 3. Bars show mean ± SEM. One‐way ANOVA was performed with post hoc Holm–Sidak multiple comparisons test. *P ≤ 0.05, **P ≤ 0.01, ***P ≤ 0.001.
Confocal scans of retinal cross sections, with focus on the ONL, immunolabelled for DAPI, eGFP and recoverin. The upper panel shows only the DAPI and eGFP signal in the ONL, and the lower panel shows the same images (noted with asterisk *) with merged DAPI, eGFP and recoverin signal. Acquisition settings were kept constant for all samples. Scale bar: 50 μm.
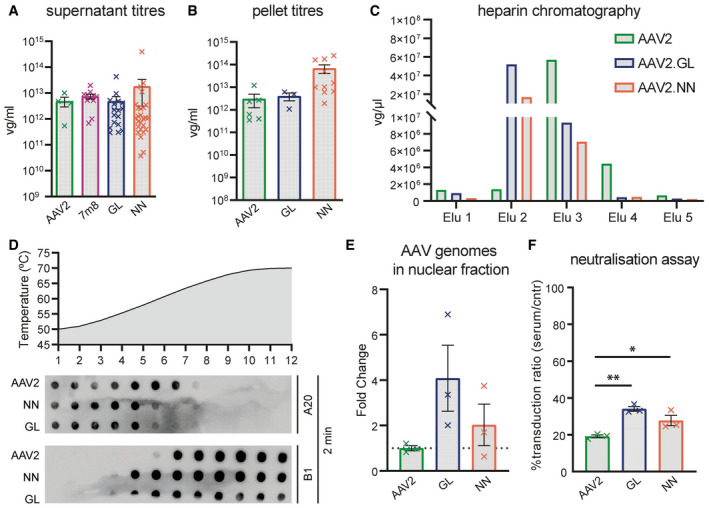
Production yield of capsids AAV2.GL, AAV2.NN, AAV2 and AAV2.7m8 quantified by qPCR as viral genomes (vg)/ml, harvested from HEK293T supernatant during standard AAV production. Biological replicates AAV2 n = 4, AAV2.7m8 n = 11, AAV2.GL n = 17, AAV2.NN n = 26. Bars show mean ± SEM.
Same as for (A) with comparison only to AAV2, harvested from HEK293T cell pellet. Biological replicates AAV2 n = 6, AAV2.GL n = 3, AAV2.NN n = 10. Bars show mean ± SEM.
Heparin affinity assay performed using chromatography. Consecutive eluates from the heparin column were used to detect the presence of AAV2, AAV2.GL and AAV2.NN, indicating binding strength.
Capsid stability assay comparing AAV2 to AAV2.GL and AAV2.NN. Dot plots of AAV particles stained for A20 and B1, following incubation for 2 min, at consecutive degeneration steps in the form of increasing temperature.
qPCR quantification of rAAV genomes in the nuclear fraction of transduced HeLa cells, normalised to cellular gDNA. Biological replicates n = 3. Bars show mean ± SEM.
Neutralisation assay using HeLa cells after pre‐incubating AAV2, AAV2.GL and AAV2.NN with human serum. rAAV vector‐induced eGFP signal served as transduction reporter. The % ratio of transduced cells after pre‐incubating AAVs with serum relative to control (cntr) unchallenged AAVs is shown. Biological replicates n = 3. Bars show mean ± SEM. One‐way ANOVA with Holm–Sidak multiple comparisons test was performed. *P ≤ 0.05, **P ≤ 0.01. Detailed statistical analysis in Appendix Table S1.
- A, B
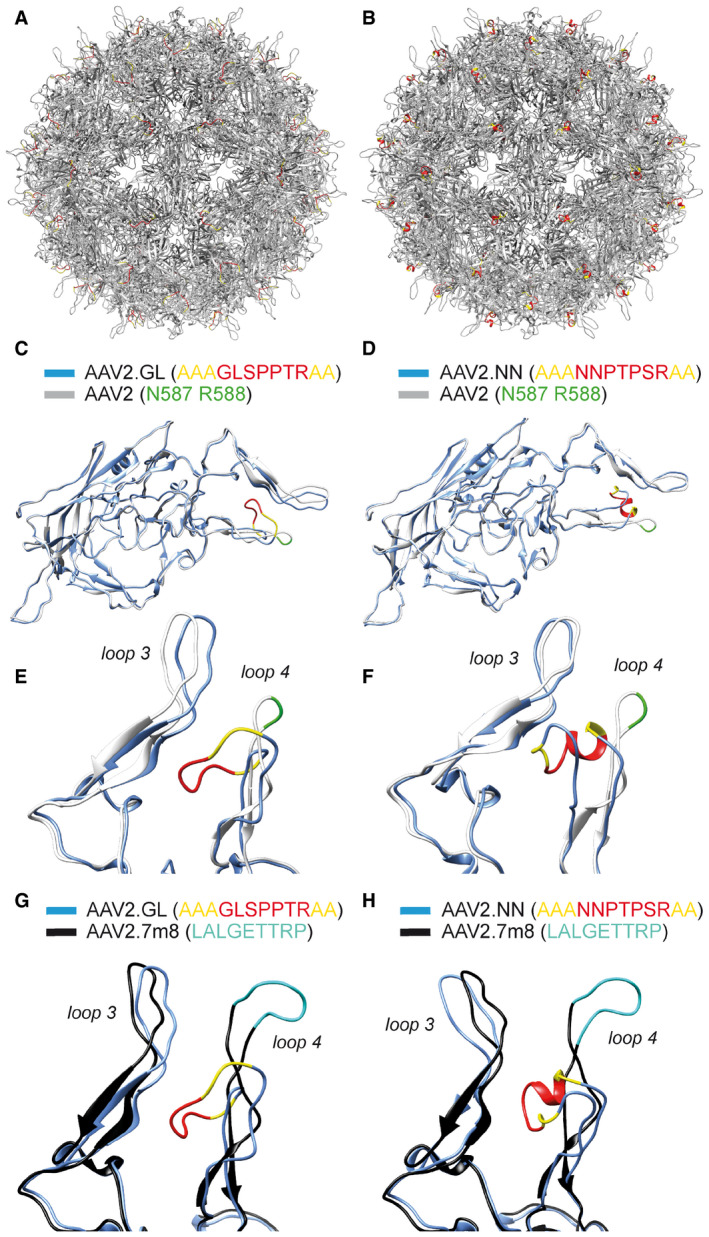
Full capsid of AAV2.GL and AAV2.NN, respectively, with the 7‐mer peptide insert in red and the alanine linker in yellow.
- C, D
Overlapped structural monomers of AAV2.GL and AAV2.NN, respectively, shown in blue, overlapped to AAV2, shown in white. 7‐mer peptide insert is shown in red and the alanine linker in yellow. Key residues N587 and R588 shown in green.
- E, F
Focused view on the variable loops 3 and 4 of the comparative overlaps in (C) and (D), respectively. The colour scheme is consistent as before.
- G, H
Focused view on the variable loops 3 and 4 of the comparative overlap of structural monomers AAV2.GL and AAV2.NN, respectively, with AAV2.7m8 (PDB 6U0R) (Bennett et al, 2020). The colour scheme for AAV2.GL (G) and AAV2.NN (H) is as before. The AAV2.7m8 structural monomer is shown in black, and the peptide displayed on loop 4 is shown in cyan.
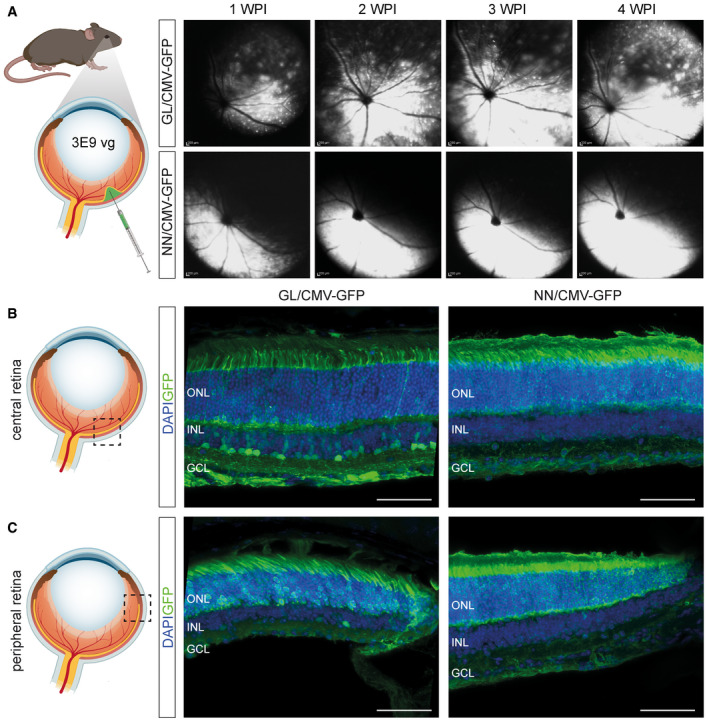
Schematic depiction of subretinal injection in wild‐type mice followed by weekly in vivo cSLO examinations of the mouse retina from 1 to 4 weeks post‐injection (WPI) of 3E9 total vg (in 1 µl) of sc‐CMV‐eGFP packaged with AAV2.GL and AAV2.NN capsid variants.
Schematic depiction of central locus shown in adjacent confocal scans of retinal cross sections immunolabelled for eGFP and DAPI, reporting transduction efficacy of AAV2.GL (left) and AAV2.NN (right).
Schematic depiction of peripheral locus shown in adjacent immunolabelled confocal scans, as in (B).
- A
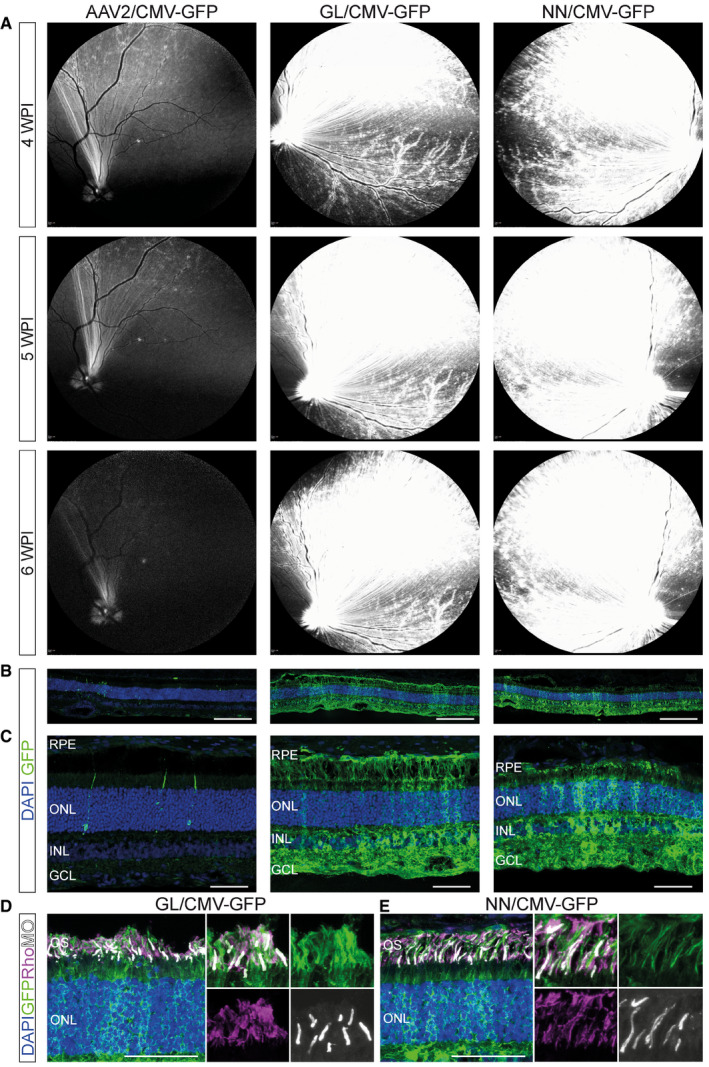
In vivo cSLO examinations of the dog retina at 4, 5 and 6 weeks post‐intravitreal injection of 2E11 total vg (in 200 µl) of sc‐CMV‐eGFP packaged with wild‐type AAV2 (right eye), AAV2.GL (right eye) and AAV2.NN (left eye) capsid variants.
- B, C
Confocal scans of immunolabelled retinal cross sections (14 μm) stained for GFP and DAPI at 6 WPI time point.
- D, E
Confocal scans of immunolabelled retinal cross sections (14 μm) at 6 WPI time point, focusing on the photoreceptors, using antibodies against eGFP, Rhodopsin (Rho) and M‐opsin (MO).
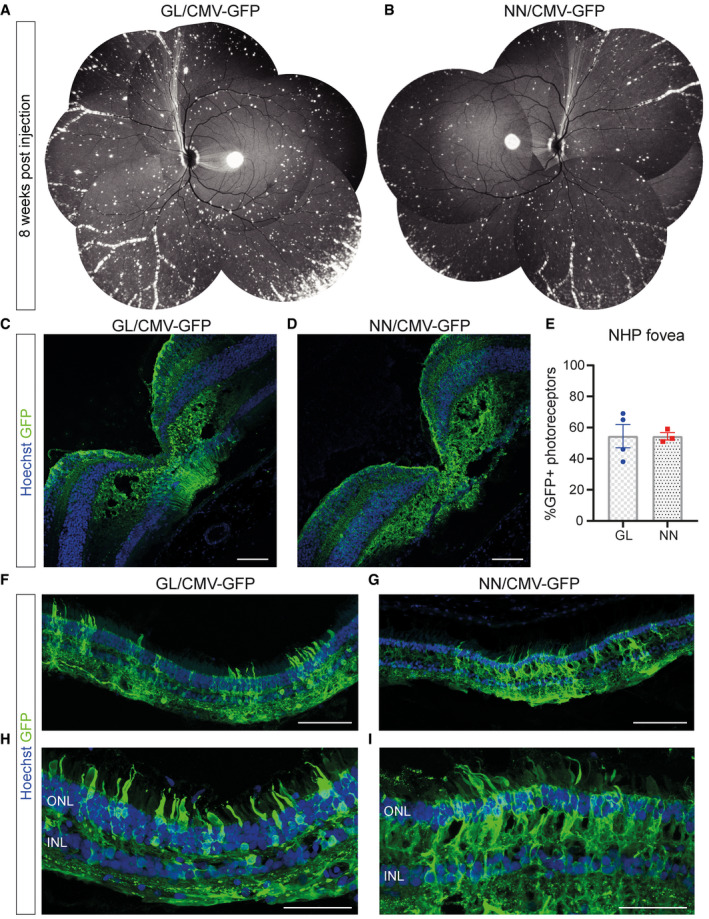
- A, B
In vivo cSLO examination images collaged to provide NHP fundus overview at 8 WPI of E12 total vg (in 38.9–100 µl) of sc‐CMV‐eGFP packaged with AAV2.GL and AAV2.NN capsid variants, respectively.
- C, D
Confocal scans of immunolabelled retinal cross sections (14 μm) of the fovea centralis from AAV2.GL‐ and AAV2.NN‐treated animals, respectively.
- E
Percentage quantification of eGFP+ photoreceptors in the ONL of foveal cross sections. AAV2.GL technical repeats n = 4, AAV2.NN technical repeats n = 3. Bars show mean ± SEM.
- F, G
Confocal scans of immunolabelled retinal cross sections (14 μm) of the periphery from AAV2.GL (F)‐ and AAV2.NN (G)‐treated retinae.
- H, I
Higher magnification confocal scans of immunolabelled peripheral retina.
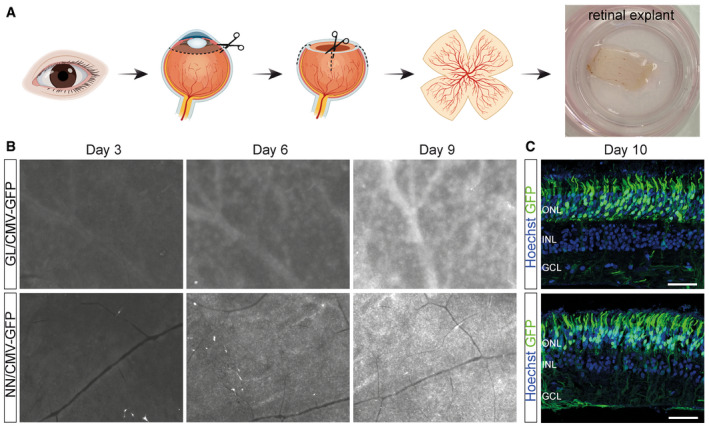
Schematic of retinal explant culture procedure.
EVOS epifluorescence images at 2× magnification of the human retinal explants at 3, 6 and 9 days in vitro (DIV) after transduction with 1E11 total vg of sc‐CMV‐eGFP packaged with AAV2.GL and AAV2.NN capsid variants. White signal indicates eGFP.
Confocal scans of day 10 tissue sections immunolabelled for eGFP and Hoechst. Scale bar: 50 μm.
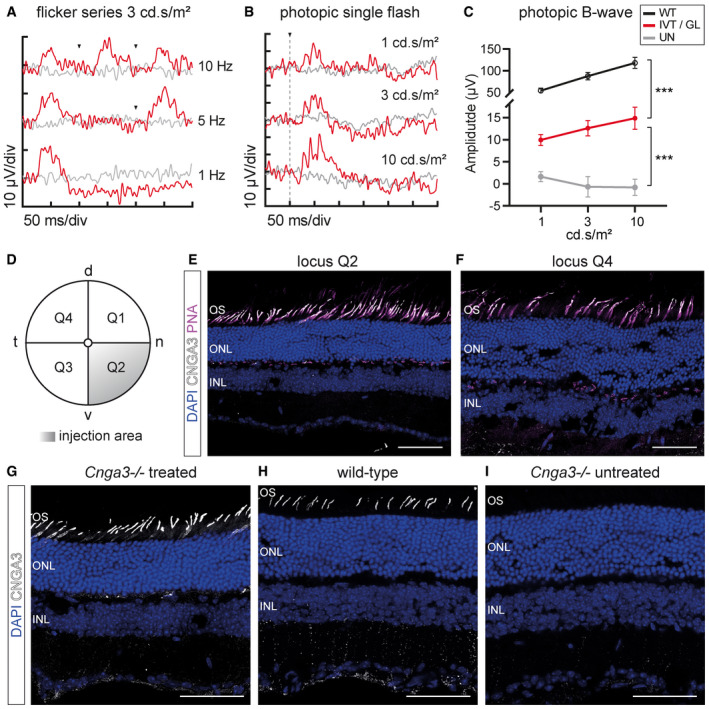
- A
Representative photopic ERG flicker series at 1, 5 and 10 Hz with 3 cd.s/m2 illumination at 10 WPI. Arrowheads indicate light stimulus.
- B
Representative photopic single‐flash ERG signal with 1, 3 and 10 cd.s/m2 illumination. The vertical dotted line indicates light stimulus.
- C
Quantification of photopic B‐wave amplitude from single‐flash responses to 1, 3 and 10 cd.s/m2 illumination of wild‐type C57BL6/J x 129/sv eyes (WT, n = 3) compared with treated eyes (IVT/GL, n ≥ 3) and untreated eyes (UN, n ≥ 3) at 10 weeks post‐injection. Symbols show mean ± SEM. Ordinary two‐way ANOVA with α = 0.05 revealed significant difference (***P < 0.0001) between samples. Additional analysis with multiple t‐tests using the Holm–Sidak method, α = 0.05, assuming sample populations have the same scatter also revealed significant difference between samples at individual illuminations.
- D
Graphical representation of mouse fundus (d = dorsal, n = nasal, v = ventral, t = temporal) divided into quadrants. Q2 indicates locus of intravitreal injection.
- E, F
Confocal images of sections proximal to the injection site in Q2 (E) and distal to the injection site in Q4 (F), showing Cnga3 expression in PNA‐positive cone outer segments.
- G–I
Confocal images of Cnga3 −/−‐treated (G), wild‐type (H) and Cnga3 −/−‐untreated (I) retinal sections stained for Cnga3. Note some non‐specific signal detected in INL and adjacent synaptic layer. Scale bar: 50 μm.
References
-
- Ali RR, Auricchio A, Smith AJ (2017) The future looks brighter after 25 years of retinal gene therapy. Hum Gene Ther 28: 982–987 - PubMed
-
- Bainbridge JW, Smith AJ, Barker SS, Robbie S, Henderson R, Balaggan K, Viswanathan A, Holder GE, Stockman A, Tyler N et al (2008) Effect of gene therapy on visual function in Leber's congenital amaurosis. N Engl J Med 358: 2231–2239 - PubMed
Publication types
MeSH terms
Grants and funding
LinkOut - more resources
Full Text Sources
Other Literature Sources
Medical
Research Materials
