Intraductal xenografts show lobular carcinoma cells rely on their own extracellular matrix and LOXL1
- PMID: 33616307
- PMCID: PMC7933935
- DOI: 10.15252/emmm.202013180
Intraductal xenografts show lobular carcinoma cells rely on their own extracellular matrix and LOXL1
Abstract
Invasive lobular carcinoma (ILC) is the most frequent special histological subtype of breast cancer, typically characterized by loss of E-cadherin. It has clinical features distinct from other estrogen receptor-positive (ER+ ) breast cancers but the molecular mechanisms underlying its characteristic biology are poorly understood because we lack experimental models to study them. Here, we recapitulate the human disease, including its metastatic pattern, by grafting ILC-derived breast cancer cell lines, SUM-44 PE and MDA-MB-134-VI cells, into the mouse milk ducts. Using patient-derived intraductal xenografts from lobular and non-lobular ER+ HER2- tumors to compare global gene expression, we identify extracellular matrix modulation as a lobular carcinoma cell-intrinsic trait. Analysis of TCGA patient datasets shows matrisome signature is enriched in lobular carcinomas with overexpression of elastin, collagens, and the collagen modifying enzyme LOXL1. Treatment with the pan LOX inhibitor BAPN and silencing of LOXL1 expression decrease tumor growth, invasion, and metastasis by disrupting ECM structure resulting in decreased ER signaling. We conclude that LOXL1 inhibition is a promising therapeutic strategy for ILC.
Keywords: LOXL1; extracellular matrix; lobular carcinoma; preclinical models; xenografts.
© 2021 The Authors. Published under the terms of the CC BY 4.0 license.
Conflict of interest statement
The authors declare that they have no conflict of interest.
Figures
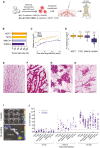
- A
Schematic outline of the intraductal injection approach used to generate ILC xenograft models. ILC cells are transduced with RFP‐luciferase expressing lentiviruses and injected into 3rd thoracic and the 4th inguinal milk ducts, highlighted in red, of 10‐week‐old NSG females. Tumor growth is monitored by bioluminescence imaging.
- B
Bar graph showing percentage of engrafted mammary glands of non‐ILC, ER+ HER2−; total number of glands injected with MCF7 (n = 17) and T47D (n = 14) and ILC, MM134 (n = 38) and SUM44 cells (n = 47). Black dotted line shows take rate 95%.
- C
Graph showing in vivo growth of the different cell line xenografts. Curves represent mean log‐transformed luminescence ± SEM of individual glands; MCF7 (n = 17), T47D (n = 10), MM134 (n = 12), and SUM44 (n = 12). Statistical testing for interactions group cell growth/ time relative to MCF‐7 was carried out by applying mixed‐effect linear models. P‐values are associated with likelihood‐ratio test statistics of the ANOVA function in R.
- D
Box plot showing log10 (radiance fold change) of individual glands 5 months after injection of MCF7, T47D, MM134, and SUM44 cells; n = 17, 14, 38, 47, respectively. Vertical lines outside the box end at maximum and minimum values, upper and lower borders of the box represent lower and upper quartiles, and line inside the box identifies the median. Statistical significance of difference to MCF7 xenografts determined by unpaired, Student's t‐test, two‐tailed, ***P < 0.001, n.s. not significant. P‐values have been corrected for multiple testing by FDR.
- E–H
Whole mount stereo‐micrographs of carmine alum stained mammary glands either uninjected (E), 2 months after intraductal injection with MCF7, arrows point to undilated ductal tips (F), MM134, dotted line highlight the subtending duct (G), or SUM44 cells (H), (n > 6) scale bar, 1 mm.
- I
Ex vivo luminescence images of bones, brain, lungs, and liver from MM134 engrafted mice 1 month post‐injection (top) and ovaries (bottom) 12 months post‐injection. Scale bar, 1 cm.
- J
Dot plot showing ex vivo bioluminescence of different organs from mice xenografted with MM134 and SUM44 cells plotted over organ and time of analysis. Number of mice analyzed MM134 and SUM44 for 30–180: N = 5, 10, 180–270 days: N = 9, 5, 270–360 days: N = 14, 20, respectively. Dashed line indicates background levels.
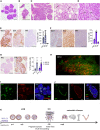
- A, B
Representative micrographs of H&E‐stained histological sections of xenografted mammary gland from three female mice 1 month after injection of MM134 (A) or SUM44 cells (B). Scale bars, 100 μm.
- C
Representative micrographs of H&E‐stained histological sections of MM134 xenografts from three different female mice 5 months after intraductal injection. Arrows point to indian files. Scale bars, 100 μm.
- D
Representative micrographs of H&E‐stained histological sections of SUM44 cell xenografts from three different female mice 5 months after intraductal injection. Arrows point to indian files. Scale bar, 50 μm.
- E, F
Representative micrographs of IHC for Ki67, ER, and PR on histological sections of MM134 (E) and SUM44 (F) xenografts 5 months after intraductal injection counterstained with hematoxylin. Scale bars, 200 μm. Bar plots represent means ± SEM of measurements and indicate the percentage of positive cells for > 1,000 cells counted on three glands.
- G
Representative micrographs of PR‐IHC on glands from 5‐month‐old MM134 xenografts from hosts treated for 2 months with vehicle (left) or E2 (right) pellets. Scale bars, 200 μm. Right, bar plot showing percentage of PR+ cells in MM134 and SUM44 xenografts with n > 1,000 cells per condition on glands from three different mice. Data represent mean ± SEM unpaired, Student's t‐test, two‐tailed; ***P < 0.001, ****P < 0.0001.
- H
Fluorescence stereo‐micrograph of a mammary gland of a NSG:EGFP+ mouse 2 months after injection with MM134‐RFP/luc2 cells. Scale bar, 1 mm.
- I, J
Micrographs of IF for GFP and E‐cadherin (I) and GFP and SMA (J) counterstained with DAPI of MM134 glands 1 month after intraductal injection of NSG:EGFP+ mice, n = 4. Scale bars, 50 μm.
- K
Scheme showing the timeline of lobular carcinogenesis in the intraductal model.
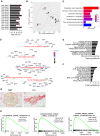
Bar graph showing take rates in % of PDXs from the treatment naïve patient ILCs. In parentheses number of injected glands (n) with growth over total n of injected glands. Red dotted line shows average take rate.
Principal component analysis plot of global gene expression profiles of ILC and non‐ILC ER+ HER2− (NST) PDX cells purified by FACS sorting based on GFP expression, n = 3.
Barplot showing Reactome pathway enrichment analysis of differentially upregulated genes.
CNET plot showing network associations between genes and pathways in the top 5 terms with increased expression in ILC.
Barplot of top 10 reactome‐enriched pathways upregulated in ILC predicted by ISMARA.
Barplot of top 10 upregulated MSigDB C2.CP curated canonical pathways collection in ILC PDXs predicted by ISMARA.
Representative photomicrographs of picrosirius red stained histological sections of non‐ILC (left) and ILC (right) PDXs. Scale bars 100 μm.
GSEA plots showing gene sets that are differentially regulated between ILC and non‐ILC FACS‐sorted intraductal PDXs, related to luminal progenitor features (left) and increased expression of basal and mesenchymal versus luminal genes (middle and right). Significance scores (P‐values) of GSEAs are computed by nonparametric permutation tests, a procedure that yields only estimates of the P‐values.
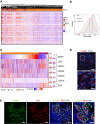
Heatmap of unsupervised hierarchical clustering performed on ER+ BC TCGA based on expression of most matrisome collagens and proteoglycans. Tumor identities ILC (blue) and non‐ILC (red) are shown.
Density plot showing the estimated score distributions of ILC and non‐ILC tumors based on the expression of matrisome ECM‐related genes. The vertical lines identify the medians. Statistical test performed by unpaired Student's t‐test, two‐tailed.
Heatmap of normalized expression levels of LOX family members and ELN in invasive BCs, in ILC (blue) and non‐ILC (red) tumors sorted based on CDH1 expression levels. Right, boxplots showing normalized transcript expression levels. The line in the middle of the box is the median. The edges of the box reflect the 25th and 75th percentiles, vertical lines outside the box end at minimum and maximum values. Outliers are depicted as gray dots. Statistical analysis was by ANOVA analysis of the linear model with tumor subtypes and tumor purity as covariates. Adjusted P‐values computed by post hoc tests. Sample size for NSTs n = 490 and ILCs n = 127. ****P < 0.0001.
Representative RNAscope image of sections from patient ILCs (n = 5) stained with anti‐LOXL1 probes (red) and counterstained with DAPI (blue). Scale bars; 50 μm.
Representative immunofluorescence image of primary ILC (n = 3) stained with anti‐LOXL1 (green) and anti‐ER (red) antibodies counterstained with DAPI (blue). Scale bars; 50 μm and right inset 30 μm.
- A
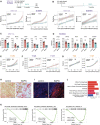
Experimental design for the early‐term treatment: 3 weeks after injection, mice were assigned randomly to vehicle (n = 4) or BAPN (n = 4) treatment (Top). Radiance‐based tumor growth curves (mean ± SE) for the MM134 (left) and SUM44 xenografts (right) treated early (bottom). For statistical analysis, mixed‐effects linear models with spline regression (when applicable) were used on log10(radiance) curves (Appendix Fig S4A). Likelihood‐ratio tests from the ANOVA function in R were used for model comparison, i.e., to check whether the treatment/group covariate is significant. ***P < 0.001 (likelihood‐ratio statistic associated P‐value).
- B
Experimental design for treatment in metastatic settings: 5 months after injection, mice were randomized to vehicle (n = 4) or BAPN (n = 4) treatment (top). Radiance‐based tumor growth curves (mean ± SE) for MM134 (left) and SUM44 (right) xenografts treated in the metastatic setting (bottom). For statistical analysis, mixed‐effects linear models with spline regression (when applicable) were used on log10(radiance) curves (Appendix Fig S4B). Likelihood‐ratio tests from the ANOVA function in R were used for model comparison, i.e., to check whether the treatment/group covariate is significant. ***P < 0.001 (likelihood‐ratio statistic associated P‐value).
- C, D
Bar graphs showing ex vivo radiance ± SEM in different organs harvested from females bearing MM134 or SUM44 intraductal xenografts for the mice described in (B). Statistical significance determined by Student's unpaired t‐test, two‐tailed. *P < 0.05, **P < 0.01, n.s not significant.
- E
Radiance‐based tumor growth curves (mean ± SE) for T47D treated with vehicle (n = 8) or BAPN (n = 12) 8 days after intraductal injections. n.s not significant.
- F
Radiance‐based tumor growth curves for (mean ± SE) ILC ER+ PDXs T125 and T137 treated with vehicle (n = 6, 7) or BAPN (n = 7, 8) 66 days after engraftment. **P < 0.01.
- G
Radiance‐based tumor growth curves (mean ± SE) for non‐ILC ER+ PDXs T99 and T157 treated with vehicle (n = 7, 7) or BAPN (n = 8, 12), 8 days after intraductal injection 3 weeks after intraductal injections. n.s not significant.
- H
Representative micrographs showing picrosirius red staining of sections from MM134 xenografts treated with PBS (left) or BAPN (right), n = 4. Scale bars, 100 μm.
- I
Representative second‐harmonic generation (SHG) image on SUM44 xenografts treated with vehicle (left) or BAPN (right), n = 3. Collagen fibers in red and DAPI nuclear stain (blue). Scale bar, 50 μm.
- J
Barplot showing reactome pathway enrichment analysis of differentially down‐regulated genes
- K
GSEA plots showing decreased early and late estrogen response and MYC targets. P‐values are computed by nonparametric permutation tests.
- A
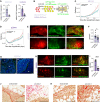
Bar plot showing LOXL1 transcript levels as measured by semi qRT–PCR normalized to 36B4 of scramble and shLOXL1 expressing ILCs cells in vitro. Data represent mean ± SEM (n = 3); Student's unpaired t‐test, two‐tailed.
- B
Scheme describing the experimental approach used to generate shLOXL1 expressing and control ILC xenograft models. ILC:RFP‐luc2 cells were transduced with GFP+ sh‐scramble or GFP + shLOXL1 expressing lentiviruses, selected by FACS and injected into the into contralateral 3rd thoracic and the 4th inguinal gland of NSG females. Xenografted mice were monitored for tumor growth by bioluminescence imaging.
- C, D
Radiance‐based tumor growth curves (mean ± SE) for the scramble and shLOXL1 MM134 (C) and SUM44 (D) xenografts. For statistical analysis, mixed‐effects with spline regression models were used on log10(radiance) curves (Appendix Fig S5A). Likelihood‐ratio tests from the ANOVA function in R were used for model comparison, i.e., to check whether the treatment/group covariate is significant. **P < 0.01.
- E
Representative fluorescent stereo‐micrographs of glands injected with MM134:RFP‐luc2 cells (left, top and bottom) infected with either GFP:sh‐scramble (top) or GFP + shLOXL1 (bottom), n = 5 and 3. Scale bar, 1,000 μm.
- F
Barplot showing the ratio of GFP/RFP signal from fluorescent stereo‐micrographs of glands engrafted with MM134 cells, n = 8. Statistical analysis by paired Student t‐test, two‐tailed. *P < 0.05.
- G
Representative fluorescence micrographs of GFP:sh‐scramble (n = 8) and GFP + shLOXL1 (n = 10) MM134 xenografted glands. ILC cells expressing viral transcripts are detected based on GFP expression (green); DAPI nuclear stain (blue). Asterisks point to intraductal growth while arrow points to invasive tumor cells. Scale bars, 50 μm.
- H
Representative fluorescent stereo‐micrographs of glands engrafted with SUM44:RFPluc2 cells infected with either GFP:sh‐scramble (top) or GFP + shLOXL1, n = 6. Scale bar, 1,000 μm.
- I
Barplot (mean ± SEM) showing quantification of the ratio GFP/RFP from fluorescent stereo‐micrographs of SUM44. Statistical analysis by unpaired Student's t‐test, two‐tailed, n = 7 sh‐scramble and n = 6 for sh‐LOXL1, ****P < 0.0001.
- J, K
Representative photomicrographs of picrosirius red stained histological sections for sh‐scramble or sh‐LOXL1 MM134 (J) and SUM44 (K) xenografts. Scale bars, 100 μm.

Comment in
-
The tumor cell-derived matrix of lobular breast cancer: a new vulnerability.EMBO Mol Med. 2021 Mar 5;13(3):e13807. doi: 10.15252/emmm.202013807. Epub 2021 Feb 22. EMBO Mol Med. 2021. PMID: 33616312 Free PMC article.
References
Publication types
MeSH terms
Substances
Associated data
- Actions
- Actions
LinkOut - more resources
Full Text Sources
Other Literature Sources
Medical
Molecular Biology Databases
Research Materials
Miscellaneous

