. 2021 Feb 1;62(2):32.
doi: 10.1167/iovs.62.2.32.

Morphometric Analysis of Retinal Pigment Epithelial Cells From C57BL/6J Mice During Aging

Affiliations

Morphometric Analysis of Retinal Pigment Epithelial Cells From C57BL/6J Mice During Aging

Yong-Kyu Kim et al. Invest Ophthalmol Vis Sci. .

Abstract

Purpose: To quantitatively evaluate the changes in orientation and morphometric features of mouse retinal pigment epithelial (RPE) cells in different regions of the eye during aging.

Methods: We segmented individual RPE cells from whole RPE flatmount images of C57BL/6J mice (postnatal days 30 to 720) using a machine-learning method and evaluated changes in morphometric features, including our newly developed metric combining alignment and shape of RPE cells during aging.

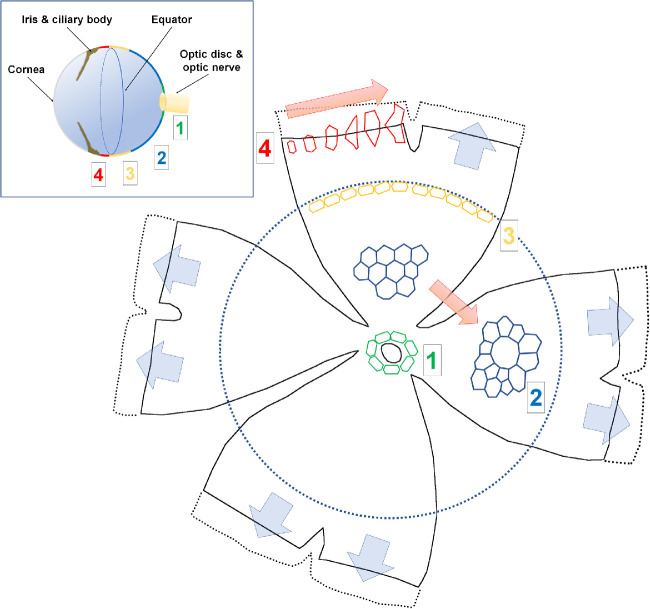
Results: Mainly, the anterior part of the RPE sheet grows during aging, while the posterior part remains constant. Changes in size and shape of the peripheral RPE cells are prominent with aging as cells become larger, elongated, and concave. Conversely, the central RPE cells maintain relatively constant size and numbers with aging. Cell count in the central area and the overall cell count (approximately 50,000) were relatively constant over different age groups. RPE cells also present a specific orientation concordance that matches the shape of the specific region of the eyeball. Those cells near the optic disc or equator have a circumferential orientation to cover the round shape of the eyeball, whereas those cells in the periphery have a radial orientation and corresponding radial elongation, the extent of which increases with aging and matches with axial elongation of the eyeball.

Conclusions: These results suggest that the fluid RPE morphology reflects various growth rates of underlying eyeball, and RPE cells could be classified into four regional classes (near the optic disc, central, equatorial, and peripheral) according to their morphometric features.


Conflict of interest statement

Disclosure: Y.-K. Kim, None; H. Yu, None; V.R. Summers, None; K.J. Donaldson, None; S. Ferdous, None; D. Shelton, None; N. Zhang, None; M.A. Chrenek, None; Y. Jiang, None; H.E. Grossniklaus, None; J.H. Boatright, None; J. Kong, None; J.M. Nickerson, None

Figures

Figure 1.
Figure 1.
Flatmount RPE cell segmentation. Serially processed RPE flatmount images are presented. Magnified images are the corresponding area of the red rectangle on whole flatmount images. (A) Mouse RPE flatmount was stained for ZO-1 (green) and nucleus (propidium iodide, red). Artifacts (folds) made during the flatmount preparation are indicated with yellow arrows. (B) Green-channel image. A signal from green fluorescence (ZO-1 staining) was extracted. (C) Binarized image. Using the machine-learning-based ImageJ plugin Trainable Weka Segmentation, the image was binarized. (D) Despeckling. Particles less than 100 pixels in size were removed from the image; however, this process also removed cell boundaries with minor discontinuity (red dotted circles in C and D) as well as small particles inside the cell areas (red circles in C and D). (E) Skeletonization. The image was skeletonized with thin cell borders. After the noise signal inside the cell was removed (red circle), some cells had missing boundaries (red dotted circle). (F) Image adjustment. Comparing the pixel intensity between the original image (green-channel image, B) and binary skeletonized image (E), the missing boundaries were recovered (red dotted circle), and speckles were suppressed (red circle). (G) Removing cells with unconnected lines or touching the cut edges of the flatmount. Cells without complete boundaries inside the cell area particularly near the artifact were removed (red arrows). Cells on the cut edges of the flatmount (blue dotted line in F and G) were also removed, as these cells are likely to be damaged during flatmount preparation. (H) Cell removal according to the area and morphology criteria. Cells less than 20 pixels or greater than 2000 pixels were removed. Those with solidity (cell area/convex area) less than 3 SDs from the mean of each zone were also removed. These concave areas result from the undersegmentation of multiple cells (red dotted circle). (I) Manual cell removal. Using our developed MATLAB-based graphical application, we overlaid the original green-channel image with the segmented image. All cell candidates were labeled by a green mask initially. We then clicked on the erroneously segmented cells, which are represented by a red mask (in red dotted circles). Cells in red masks were removed from further analysis. We carefully examined the cut edges of the flatmount and regions with artifacts such as tissue folding, and we eliminated any damaged cells from those areas. (J) The final analysis image set was prepared. These steps generally eliminated 30% to 50% of the RPE cells from the area of the whole flatmount.
Figure 2.
Figure 2.
Morphological analysis of RPE cells in different age groups. Two flatmount images from each of five age groups (P30, P45, P60, P180, P330) and four flatmount images from P720 were analyzed. (A) Zone segmentation. The radius (R) was defined as the distance from the center of the optic disc to the farthest point of the flatmount. Each image was evenly divided into five zones by such distance. Each corresponding concentric zone was designated by zone 1 (center) to zone 5 (periphery). (B) The flatmount area monotonously increased until P180, and after that the rate of increase decreased. (C) The increase rate of the cumulative flatmount area was constant until 1200 µm; however, it was higher in the old group after a distance of 1200 µm. (D) Average cell area. Young mice showed decreased cell size from center to periphery. As the mice got older, cell size increased in the peripheral area. Overall, the average cell size was larger in the old group, particularly in zone 1 (young, 296.9 ± 8.8 µm2; old, 324.3 ± 16.3 µm2; P = 0.003), zone 4 (young, 253.2 ± 18.8 µm2; old, 304.4 ± 13.8 µm2; P < 0.001), and zone 5 (young, 234.6 ± 20.8 µm2; old 436.2 ± 94.2 µm2; P < 0.001, t-test). (E) The change in cell perimeter showed a similar pattern to the average cell area. (F) The aspect ratio (major axis length/minor axis length) was high near the optic disc and in the periphery. The aspect ratio was significantly greater in the old group in zones 3, 4, and 5: zone 3, 1.26 ± 0.01 for young mice versus 1.30 ± 0.03 for old mice (P = 0.016); zone 4, 1.35 ± 0.01 for young mice versus 1.39 ± 0.04 for old mice (P = 0.011); zone 5, 1.43 ± 0.02 for young mice versus 1.56 ± 0.10 for old mice (P = 0.005). (G) Eccentricity showed a similar pattern to the aspect ratio. The eccentricity was large near the optic disc and in the periphery. The eccentricity of old mice was greater than that of the young mice. (H) Solidity (area/convex area) showed a decreasing pattern from the center to the periphery, in particular, zone 5 cells showed a stronger decrease as the mice got older: 0.924 ± 0.001 for young mice versus 0.917 ± 0.006 for old mice (P = 0.007). (I) There was no significant difference in the cumulative estimated cell count increase rate according to the distance from the optic disc center between 0 to 1200 µm range; however, the cell count increased rapidly in the young group between 1200 µm and 2400 µm. (J) The estimated total cell number was constant over the different age groups with an average of 49,403 ± 1711 cells per eye. (K, L) Percentage of the analyzed area over the total flatmount area. The mean overall percentage of the analyzed area was 53.7%. The percentage of the analyzed area dropped near the optic disc and in the far periphery.
Figure 3.
Figure 3.
A measure of the degree of radial cell orientation. (A) The degree of cells oriented radially outward was calculated by (1) the angle between the major axis of the cell and the line connecting the center of the optic disc and the center of the cell, and (2) the cell aspect ratio. The equation cos θ × (majoraxislength-minoraxislength)majoraxislength increases when angle θ decreases, and the inverse aspect ratio, iAR = minor axis length/major axis length, decreases. (B) Illustration of changes in angle θ and aspect ratio of the cell and corresponding changes in the radial cell orientation. When the major and the minor axes of the cell length are the same, the aspect ratio becomes 1, and the radial cell orientation becomes 0 (far left). When the cell is elongated, the radial cell orientation increases (second from left). When the cell is oriented toward the center, the radial cell orientation further increases (third from left). When the cell is oriented toward the center and the cell is more elongated toward the major axis direction, the radial cell orientation further increases (far right). (C) Changes in angle θ are demonstrated as a function of the distance from the optic disc center. Angle θ showed a decreasing trend from the center to the periphery, with a second hump appearing between 1600 µm and 1700 µm. Angle θ of the old group was greater than that of the young group from 600 µm to 2100 µm; however, it was greater in the young group between 2100 µm and 2400 µm (young, 35.1° ± 3.4°; old, 30.2° ± 2.7°; P = 0.012). (D) Changes in the radial cell orientation according to distance from the optic disc center. Changes in the radial cell orientation showed a relatively constant level until 1800 µm; however, it rapidly increased in the periphery. The old mice group showed a higher value of radial cell orientation at the periphery compared to the young group. (E) Flatmount images from P30 mouse. The area in red rectangles on whole flatmount images are magnified. Cells near the optic disc (red dotted circle) are elongated and encircle the optic disc margin. Thus, the major axis and the line between the optic disc center and the center of the cell form large angles. On the other hand, cells in the periphery (blue dotted circle) were radially outwardly oriented, making angle θ small and the radial cell orientation large.
Figure 4.
Figure 4.
Results of PCA and LDA. With cell morphometric features, PCA was performed on different age groups and different zones. LDA was also performed to evaluate whether cell morphometric features can be used to predict the age or cell zone. (Top row) PCA with different age groups. In young mice groups (P30–60), cells from different zones were clumped in the same cluster. As mice got older (P180–720), the zone 5 cells were separated from the other cell cluster. (Second row) PCA in different zones. In zones 1 through 4, cells from different age groups were clustered together. Two clusters of cells in zones 1 and 2 along the PC1 (red arrows dividing the clusters) were observed. As zone number increased, a stronger pattern of a serial separation of cells from young to old mice appeared. (Third row) LDA was performed to discriminate far peripheral cells (zone 5) from other cells. Zone 5 cells can be discriminated from others using morphometric features in all age groups with an accuracy greater than 85%. (Bottom row) LDA was performed to discriminate cells of old mice (P180–P720) from those of young mice (P30–P60). The discrimination accuracy was between 57.1% and 66.8% in zones 1 through 4. The discrimination accuracy for zone 5 was the highest (82.4%).
Figure 5.
Figure 5.
Peripheral images of the RPE flatmount in different age groups. In these same scaled images, we can see the gradual changes in the far peripheral cells that become dysmorphic, enlarged, and elongated.
Figure 6.
Figure 6.
Summary illustration of eyeball growth and RPE cell changes with aging. Each number in the schematic of the eyeball in the upper left corner and the flatmount image represents the same region. Blue arrows in the flatmount image represent axial elongation of the eyeball during aging. Red arrows in the flatmount image represent changes in RPE morphology during aging. Blue dotted circles in the schematic of the eyeball and the flatmount image represent the equator. (1) Cells in the posterior polar area near the optic disc are elongated in shape and encircle the optic disc. (2) Cells in the central to mid-peripheral area do not change significantly in numbers and average size; however, the cell size varies more, and abnormally large cells appear as mice get older. (3) Cells near the equator are elongated and encircle the equatorial band, to cover the largest area of the RPE surface. (4) Cells in the periphery are oriented outward and show a dramatic change in cell size and shape during aging. Cells become bigger and dysmorphic and seem to cover most of the stretched area during eyeball growth.

Similar articles

Cited by

References

    1. Strauss O. The retinal pigment epithelium in visual function. Physiol Rev. 2005; 85(3): 845–881. - PubMed
    1. Kanow MA, Giarmarco MM, Jankowski CS, et al. .. Biochemical adaptations of the retina and retinal pigment epithelium support a metabolic ecosystem in the vertebrate eye. eLife. 2017; 6: e28899. - PMC - PubMed
    1. Guillot C, Lecuit T. Mechanics of epithelial tissue homeostasis and morphogenesis. Science. 2013; 340(6137): 1185–1189. - PubMed
    1. Jiang Y, Qi X, Chrenek MA, et al. .. Functional principal component analysis reveals discriminating categories of retinal pigment epithelial morphology in mice. Invest Ophthalmol Vis Sci. 2013; 54(12): 7274–7283. - PMC - PubMed
    1. Bhatia SK, Rashid A, Chrenek MA, et al. .. Analysis of RPE morphometry in human eyes. Mol Vis. 2016; 22: 898–916. - PMC - PubMed

Publication types