. 2022 Jan 7;118(1):226-240.
doi: 10.1093/cvr/cvab004.

Asymmetric Hapln1a drives regionalized cardiac ECM expansion and promotes heart morphogenesis in zebrafish development

Affiliations

Asymmetric Hapln1a drives regionalized cardiac ECM expansion and promotes heart morphogenesis in zebrafish development

Christopher J Derrick et al. Cardiovasc Res. .

Abstract

Aims: Vertebrate heart development requires the complex morphogenesis of a linear tube to form the mature organ, a process essential for correct cardiac form and function, requiring coordination of embryonic laterality, cardiac growth, and regionalized cellular changes. While previous studies have demonstrated broad requirements for extracellular matrix (ECM) components in cardiac morphogenesis, we hypothesized that ECM regionalization may fine tune cardiac shape during heart development.

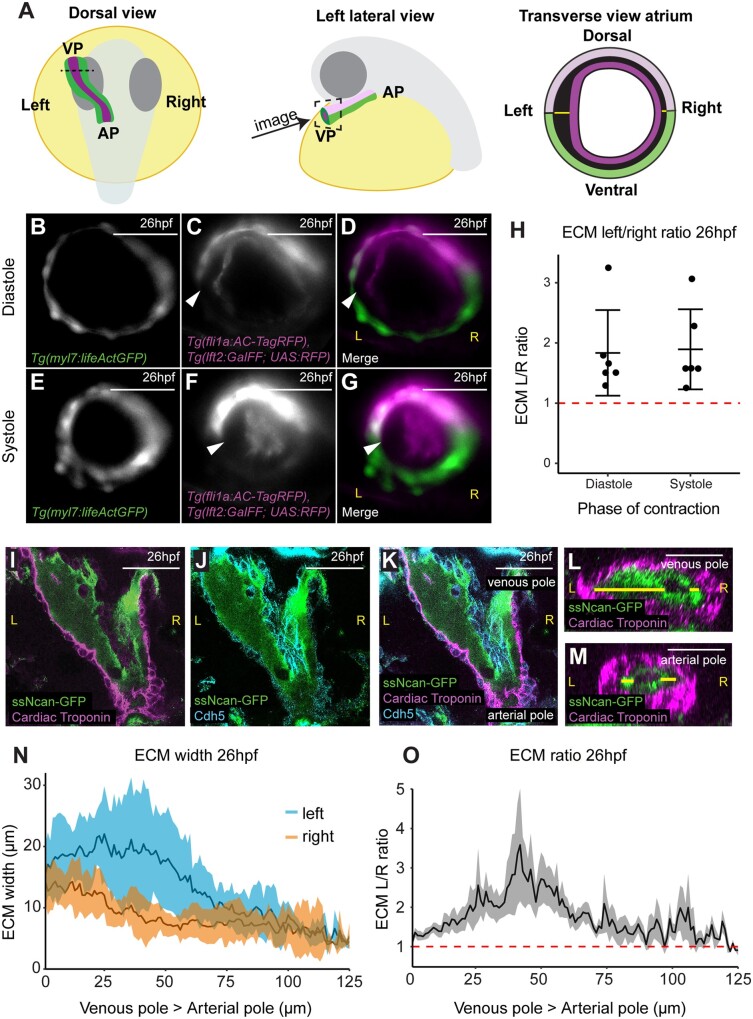
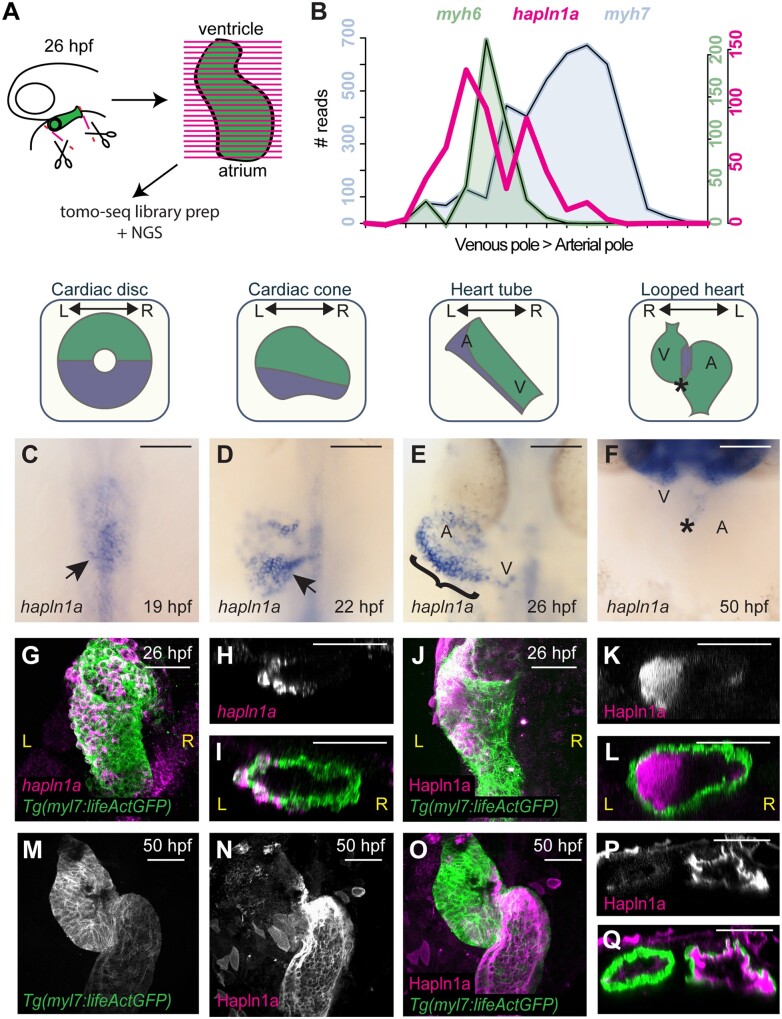
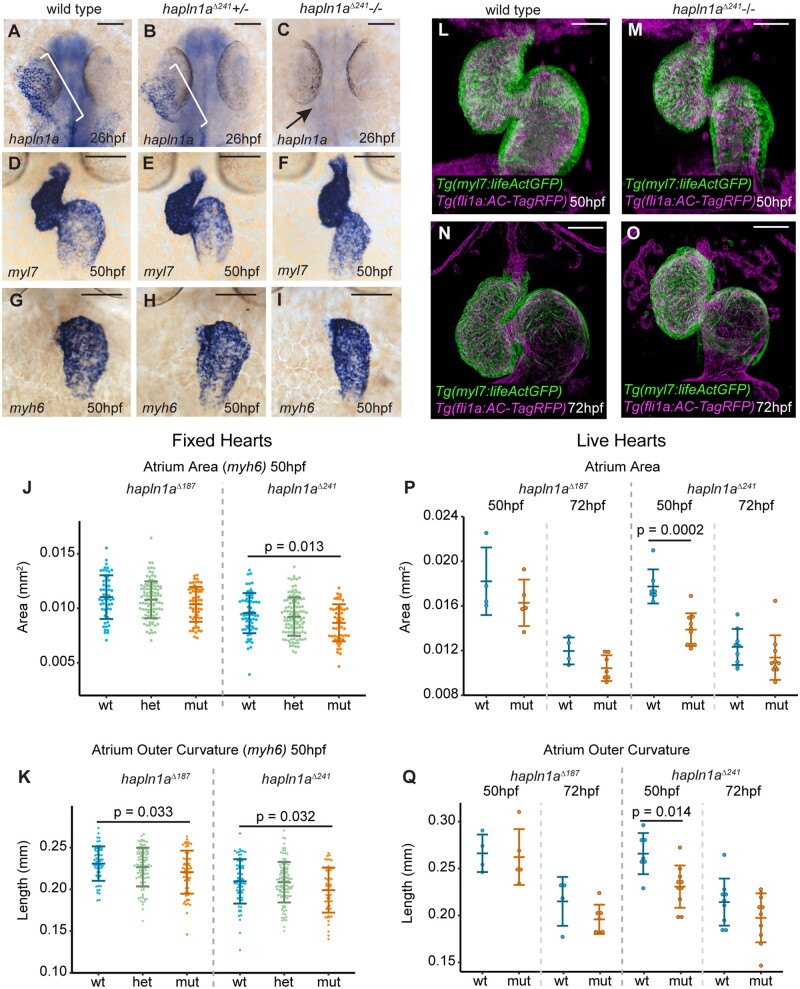
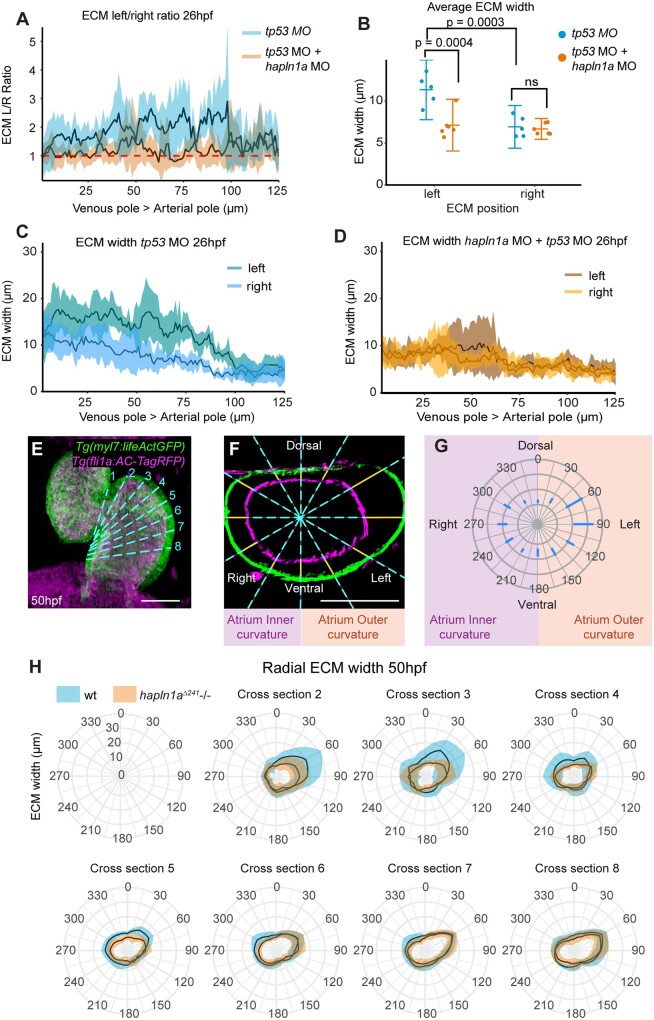
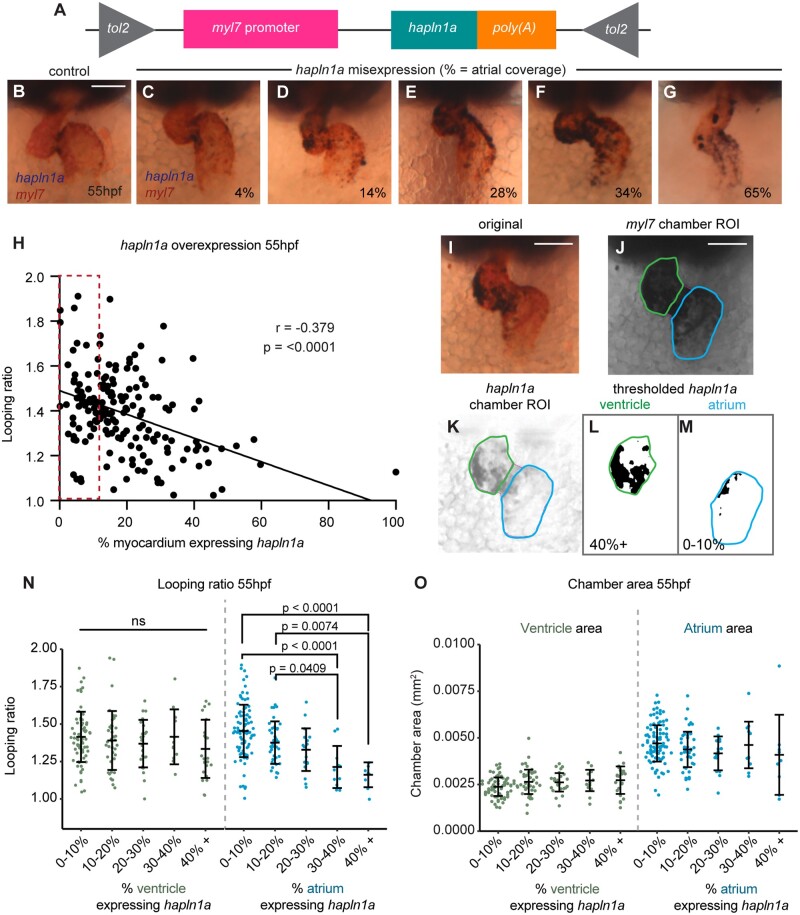
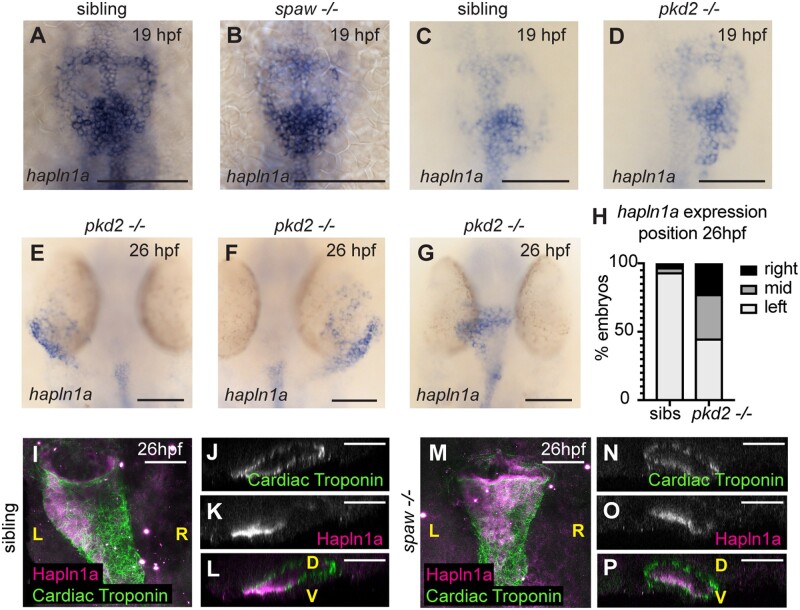
Methods and results: Using live in vivo light sheet imaging of zebrafish embryos, we describe a left-sided expansion of the ECM between the myocardium and endocardium prior to the onset of heart looping and chamber ballooning. Analysis using an ECM sensor revealed the cardiac ECM is further regionalized along the atrioventricular axis. Spatial transcriptomic analysis of gene expression in the heart tube identified candidate genes that may drive ECM expansion. This approach identified regionalized expression of hapln1a, encoding an ECM cross-linking protein. Validation of transcriptomic data by in situ hybridization confirmed regionalized hapln1a expression in the heart, with highest levels of expression in the future atrium and on the left side of the tube, overlapping with the observed ECM expansion. Analysis of CRISPR-Cas9-generated hapln1a mutants revealed a reduction in atrial size and reduced chamber ballooning. Loss-of-function analysis demonstrated that ECM expansion is dependent upon Hapln1a, together supporting a role for Hapln1a in regionalized ECM modulation and cardiac morphogenesis. Analysis of hapln1a expression in zebrafish mutants with randomized or absent embryonic left-right asymmetry revealed that laterality cues position hapln1a-expressing cells asymmetrically in the left side of the heart tube.

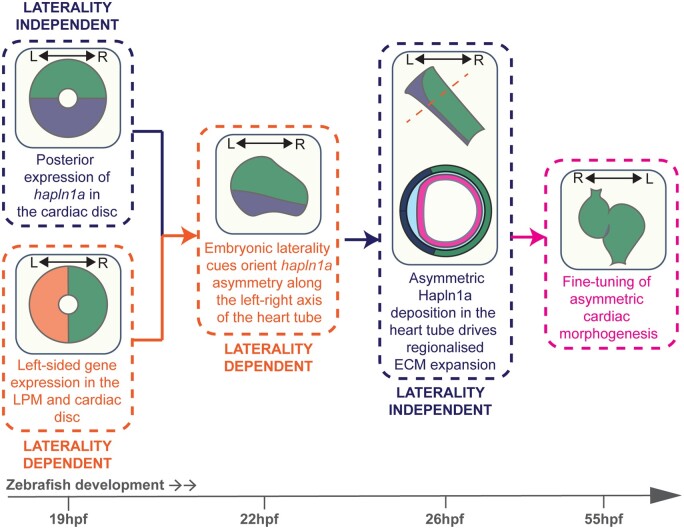
Conclusion: We identify a regionalized ECM expansion in the heart tube which promotes correct heart development, and propose a novel model whereby embryonic laterality cues orient the axis of ECM asymmetry in the heart, suggesting these two pathways interact to promote robust cardiac morphogenesis.

Keywords: Extracellular matrix; Heart development; Heart morphogenesis; Laterality; Zebrafish.


Figures

None
Graphical abstract
Figure 1
Figure 1
The hyaluronan-rich ECM is asymmetric during early zebrafish heart development. (A) Schematic depicting the developmental stage and orientation of zebrafish embryos used in live imaging experiments. Optical transverse sections of the heart tube are imaged at the position of the dotted line/dotted square. Green, myocardium; magenta, endocardium; light pink, dorsal myocardium. (B–G) Light-sheet optical cross-sections through the heart tube of a 26hpf Tg(myl7:lifeActGFP); Tg(fli1a:AC-TagRFP); Tg(lft2BAC:Gal4FF); Tg(UAS:RFP) transgenic embryo during diastole (B–D) and systole (E–G) at the level of the dotted line in (A). The myocardium is marked in green (B, D, E, and G), and the dorsal myocardium and endocardium are marked in magenta (C, D, F, and G). The extracellular space between myocardium and endocardium is expanded on the left side of the heart tube (white arrowhead). Scale bar = 50 μm. (H) Quantification of left–right ECM ratio in heart tubes, >1 (red dotted line) denotes left-sided expansion. Mean ± SD are plotted, n = 6. (I–K) Single confocal z-planes longitudinally through the heart at 26hpf of embryos injected with ssNcan-GFP (green), counterstained with cardiac troponin (magenta, I, K) and VE-Cadherin (cyan J, K). (L and M) Transverse optical reslice through the heart tube the venous pole (L) or arterial pole (M). ECM width is measured using the ssNcan-GFP signal (yellow line) on left and right sides of the tube. (N) Quantification of ECM width on the left (blue) and right (orange) sides of the heart tube from venous pole to arterial pole at 26hpf. Mean ± SD are plotted, n = 7. (O) Left–right ECM ratio in the heart tube from venous pole to arterial pole, where >1 (red dotted line) indicates a left-sided expansion. Mean ± SEM are plotted, n = 7. The mean L/R ratio across the heart is 1.667, and analysis using a one-sample t-test shows this significantly differs from 1, P < 0.0001 L, left; R, right; VP, venous pole; AP, arterial pole. Scale bar = 50μm.
Figure 2
Figure 2
hapln1a is regionally expressed in the heart tube and secreted asymmetrically into the cardiac jelly. (A) Schematic representation of Tomo-seq pipeline. GFP-expressing hearts are manually excised from embryos at 26hpf, and frozen in tissue freezing medium. Heart tubes are sectioned along the atrioventricular axis. RNA extracted from individual slices is labelled with a slice-specific molecular barcode during reverse transcription before generating sequencing libraries. (B) Example Tomo-seq traces from a single 26hpf heart tube, with individual slices from venous pole to arterial pole along the x-axis and normalized read number along the y-axis. Read numbers for atrial marker myh6 (green) and ventricular marker myh7 (blue) allows identification of chamber position within the dataset. hapln1a expression (magenta) is up-regulated in atrial sections. (C–F) mRNA in situ hybridization analysis of hapln1a expression in the heart between 19hpf and 50hpf. At cardiac disc stage, hapln1a is up-regulated in the posterior (arrow C), which is maintained as the heart forms the cardiac cone prior to tube formation (arrow D), with lower expression in the anterior cone. Once the heart cone has extended to form the tube, the previously posterior hapln1a expression is positioned on the left side of the tube (bracket, E), and expressed at higher levels in the atrium (A) than the ventricle (V). By 50hpf hapln1a expression in the heart is restricted to low levels in the atrioventricular canal (AVC, asterisk, F). Schematics above in situ panels indicate heart morphology at each stage, and hapln1a expression domain within the heart (blue) V, Ventricle; A, Atrium. Scale bar = 100 μm. (G–I) Fluorescent in situ hybridization analysis of hapln1a (magenta) in Tg(myl7:lifeActGFP) transgenic embryos shows hapln1a is expressed in myocardial cells at 26hpf. (J–L) Fluorescent immunostaining of Hapln1a (magenta) in Tg(myl7:lifeActGFP) transgenic embryos demonstrating the protein is secreted into the extracellular space predominantly on the left side of the heart tube (magenta) at 26hpf. (G and J) Dorsal views. (H and I, K and L) Transverse views. (M–Q) Fluorescent immunostaining of Hapln1a (magenta) in Tg(myl7:lifeActGFP) transgenic embryos at 50hpf revealing Hapln1a is maintained in the cardiac ECM as looping progresses. (M–O) Ventral views. (P and Q) Transverse views. L, left; R, right, scale bar = 50 μm
Figure 3
Figure 3
Hapln1a promotes atrial growth. (A–C) mRNA in situ hybridization analysis of hapln1a expression at 26hpf in embryos from an incross of hapln1aΔ241 heterozygous carriers. Wild-type and heterozygous siblings express hapln1a in the heart (bracket A, B, respectively), whereas hapln1a is absent in homozygous mutants (arrow C). (DI) mRNA in situ hybridization expression analysis at 50hpf of myl7 (DF) and myh6 (G–I) in wild-type siblings (D and G), hapln1aΔ241 heterozygous siblings (E and H) or hapln1aΔ241 homozygous mutant embryos (F and I). Scale bar = 50 μm. (J and K) Quantification of atrial area (J), and atrial outer curvature (K) in ISH-processed sibling embryos (wt/het) and hapln1aΔ241 or hapln1aΔ187 mutants (mut) at 50hpf. Atrial area is significantly reduced in hapln1aΔ241 mutants compared to wild-type siblings (P = 0.013), and atrial outer curvature is significantly reduced in both hapln1aΔ187 and hapln1aΔ241 mutants (P = 0.033 and P = 0.032). In both J and K, n = 54 hapln1aΔ187 wt; 104 hapln1aΔ187 het; 60 hapln1aΔ187 mut, 66 hapln1aΔ241 wt; 116 hapln1aΔ241 het; 53 hapln1aΔ241 mut. (L–O) Maximum intensity projections of light-sheet z-stacks of live 50hpf (L and M) and 72hpf (N and O) Tg(myl7:lifeActGFP); Tg(fli1a:AC-TagRFP) transgenic wild-type (L and N), and hapln1aΔ241 mutant embryos (M and O). Scale bar = 50μm. (P and Q) Quantification of atrial area (P), and atrial outer curvature (Q) in live light-sheet z-projections from wild-type sibling embryos and hapln1aΔ241 or hapln1aΔ187 mutants at 50hpf and 72hpf. Atrial area and atrial outer curvature are significantly reduced in hapln1aΔ241 mutants (mut) compared to wild-type siblings (wt/het) at 50hpf (P = 0.0002, and P = 0.014). In both (P) and (Q), n = 4 hapln1aΔ187 50hpf wt; 5 hapln1aΔ187 50hpf mut, 7 hapln1aΔ241 50hpf wt; 10 hapln1aΔ241 50hpf mut; 4 hapln1aΔ187 72hpf wt; 7 hapln1aΔ187 72hpf mut, 9 hapln1aΔ241 72hpf wt; 10 hapln1aΔ241 72hpf mut. Comparative statistics carried out using a Kruskal–Wallis test with multiple comparisons.
Figure 4
Figure 4
Hapln1a drives regionalized ECM expansion. (A) Quantification of ECM left/right width along the longitudinal axis of the heart at 26hpf in embryos injected with either tp53 MO (blue, n = 5) or hapln1a MO +tp53 MO (orange, n = 6). Mean ± SD are plotted. (B) Average ECM width on the left or right side of the heart tube in embryos injected with tp53 MO (blue, n = 5) or hapln1a MO +tp53 MO (orange, n = 6). tp53-injected controls display an expanded ECM on the left side of the heart tube compared to the right, (P = 0.0003, 2-way ANOVA) whereas embryos injected with hapln1a MO +tp53 MO have a reduced left ECM size when compared to tp53 MO injected (P = 0.0004), resulting in loss of left-sided ECM expansion. Mean ± SD are plotted. (C and D) Quantification of ECM width on the left and right sides of the heart tube from venous pole to arterial pole at 26hpf in embryos injected with tp53 MO (C, n = 5) or hapln1a MO +tp53 MO (D, n = 6). Mean ± SD are plotted. The cardiac ECM in tp53 morphants exhibits atrial and left side expansion, whereas the ECM in hapln1a morphants is more uniform in width from atrium to ventricle and is not expanded on the left side. Mean ± SD are plotted. (E) Maximum intensity projection of light-sheet z-stacks of 50hpf Tg(myl7:lifeActGFP); Tg(fli1a:AC-TagRFP) transgenic embryo. Dashed cyan line indicates position of optical cross-sections. (F) Example orthogonal view through the atrium of wild-type embryo in (E). Blue dashed lines indicate radial positions for measuring ECM thickness (yellow lines). Scale bar = 50μm. (G) Schematic of radial plot corresponding to radial ECM positions in (F). (H) Quantification of ECM width in atrial cross-sections at defined angular positions along the longitudinal axis of the atrium from AVC (cross-section 2) towards the venous pole (cross-section 8) at 50hpf in wild-type (blue) or hapln1aΔ241 mutants (orange). Asymmetric ECM width is reduced in the outer curvature close to the AVC (cross-sections 2–4) in hapln1aΔ241 mutants compared to wild-type siblings. Mean ± SD are plotted, radial-axis is consistent between plots, n ≥ 4 at each location.
Figure 5
Figure 5
Regionalized hapln1a expression in the atrium promotes heart morphogenesis. (A) Schematic of DNA construct used to misexpress hapln1a specifically in cardiomyocytes. (B–G) Example images of heart morphology (myl7, red) upon different levels of hapln1a misexpression (blue) at 55hpf, related to the quantification method depicted in (I–M). Percentage indicates hapln1a coverage of the atrium. (H) Scatter plot depicting looping ratio as a function of percentage of the heart covered by hapln1a expression together with linear regression of the data (n = 174). Spearman’s correlation coefficient (r) deviates significantly from zero (P < 0.0001) demonstrating that increased coverage of hapln1a in the myocardium results in reduced heart looping morphogenesis. Red dashed box indicates embryos with wild-type levels of hapln1a expression. (IM) Quantification approach to analyze pan-cardiac or chamber-specific hapln1a misexpression at 55hpf. The number of hapln1a-positive pixels within each chamber is measured alongside the total chamber area, quantifying the percentage of the chamber expressing hapln1a. (N–O) Analysis of looping ratio (N) and chamber area (O) as a function of the level of hapln1a expression in each chamber of the heart. Embryos are categorized depending on the percentage of the chamber expressing hapln1a. Misexpression of hapln1a in the ventricle does not affect looping ratio, whereas misexpression of hapln1a in the atrium significantly reduces looping ratio at ≥30% coverage (N). hapln1a misexpression in either chamber does not appear to alter overall heart size (O). ns = not significant. In both (N) and (O), atrium misexpression categories: n = 92 (0–10%); 43 (10–20%); 17 (20–30%); 12 (30–40%); 9 (40+%); ventricle misexpression categories: n = 73 (0–10%); 41 (10–20%); 25 (20–30%); 12 (30–40%); 23 (40+%). Comparative statistics carried out using a Kruskal–Wallis test with multiple comparisons.
Figure 6
Figure 6
Posterior up-regulation of hapln1a in the cardiac disc is independent of left–right asymmetry. (A–G) mRNA in situ hybridization analysis of hapln1a expression in an incross of spaw (A and B) or pkd2hu2173 (C–G) heterozygous carriers. At 19hpf hapln1a is expressed in the posterior cardiac disc of both spaw mutant embryos (B, n = 17/19), and pkd2 mutant embryos (D, n = 13/13), similar to sibling embryos. At 26hpf pkd2 mutant hearts that have jogged to the left exhibit left side up-regulation of hapln1a (E, n = 18), pkd2 mutant hearts on the right have right side up-regulation of hapln1a (F, n = 9), and pkd2 mutant hearts that remain at the midline have no clear left–right asymmetry in expression (G, n = 13). (H) Quantification of position of hapln1a expression in sibling and pkd2hu2173 mutant embryos at 26hpf, n = 138 pkd2hu2173 siblings, 40 pkd2hu2173 mutants. (I–P) Fluorescent immunostaining of Hapln1a (magenta) and cardiac troponin (green) at 26hpf in wild-type siblings (I–L) or spaw mutant embryos (M–P). Wild-type siblings exhibit left-sided deposition of Hapln1a in the heart tube (I–L, n = 6), whereas spaw mutant embryos exhibit ventral localization of Hapln1a (M–P, n = 6). (I and M) Dorsal views. (J–L and N–P) Optical transverse sections. Scale bar = 50μm. L, left; R, right; D, dorsal; V, ventral.
Figure 7
Figure 7
Left–right asymmetry orients ECM asymmetry in the heart tube to fine tune cardiac morphogenesis. Model depicting the interaction between embryonic laterality and ECM regionalization in cardiac morphogenesis. LPM, lateral plate mesoderm; L, left; R, right.

Similar articles

Cited by

References

    1. Linde D V D, Konings EEM, Slager MA, Witsenburg M, Helbing WA, Takkenberg JJM, Roos-Hesselink JW. Birth prevalence of congenital heart disease worldwide: a systematic review and meta-analysis. J Am Coll Cardiol 2011;58:2241–2247. - PubMed
    1. Desgrange A, Garrec J-FL, Meilhac SM. Left-right asymmetry in heart development and disease: forming the right loop. Development 2018;145:dev162776. - PubMed
    1. Levin M, Johnson RL, Sterna CD, Kuehn M, Tabin C. A molecular pathway determining left-right asymmetry in chick embryogenesis. Cell 1995;82:803–814. - PubMed
    1. Long S, Ahmad N, Rebagliati M. The zebrafish nodal-related gene southpaw is required for visceral and diencephalic left-right asymmetry. Development 2003;130:2303–2316. - PubMed
    1. Brennan J, Norris DP, Robertson EJ. Nodal activity in the node governs left-right asymmetry. Genes Dev 2002;16:2339–2344. - PMC - PubMed

Publication types

MeSH terms