. 2021 May 19;38(6):2597-2614.
doi: 10.1093/molbev/msab054.

Mitonuclear Coevolution, but not Nuclear Compensation, Drives Evolution of OXPHOS Complexes in Bivalves

Affiliations

Mitonuclear Coevolution, but not Nuclear Compensation, Drives Evolution of OXPHOS Complexes in Bivalves

Giovanni Piccinini et al. Mol Biol Evol. .

Abstract

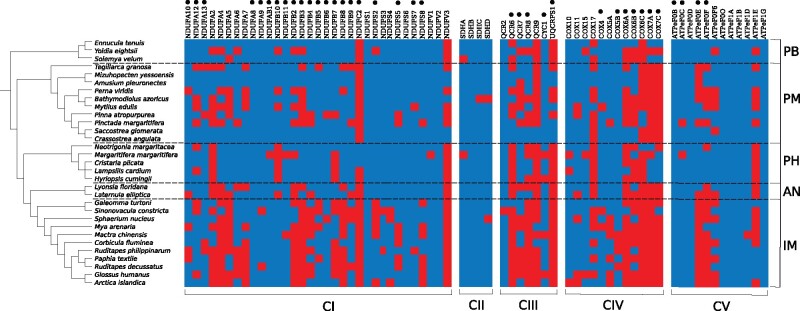
In Metazoa, four out of five complexes involved in oxidative phosphorylation (OXPHOS) are formed by subunits encoded by both the mitochondrial (mtDNA) and nuclear (nuDNA) genomes, leading to the expectation of mitonuclear coevolution. Previous studies have supported coadaptation of mitochondria-encoded (mtOXPHOS) and nuclear-encoded OXPHOS (nuOXPHOS) subunits, often specifically interpreted with regard to the "nuclear compensation hypothesis," a specific form of mitonuclear coevolution where nuclear genes compensate for deleterious mitochondrial mutations due to less efficient mitochondrial selection. In this study, we analyzed patterns of sequence evolution of 79 OXPHOS subunits in 31 bivalve species, a taxon showing extraordinary mtDNA variability and including species with "doubly uniparental" mtDNA inheritance. Our data showed strong and clear signals of mitonuclear coevolution. NuOXPHOS subunits had concordant topologies with mtOXPHOS subunits, contrary to previous phylogenies based on nuclear genes lacking mt interactions. Evolutionary rates between mt and nuOXPHOS subunits were also highly correlated compared with non-OXPHO-interacting nuclear genes. Nuclear subunits of chimeric OXPHOS complexes (I, III, IV, and V) also had higher dN/dS ratios than Complex II, which is formed exclusively by nuDNA-encoded subunits. However, we did not find evidence of nuclear compensation: mitochondria-encoded subunits showed similar dN/dS ratios compared with nuclear-encoded subunits, contrary to most previously studied bilaterian animals. Moreover, no site-specific signals of compensatory positive selection were detected in nuOXPHOS genes. Our analyses extend the evidence for mitonuclear coevolution to a new taxonomic group, but we propose a reconsideration of the nuclear compensation hypothesis.

Keywords: OXPHOS; bivalvia; compensatory evolution; evolutionary rates; mitonuclear coevolution.


Figures

Fig. 1.
Fig. 1.
Annotation of nuDNA-encoded OXPHOS subunits. Presence and absence of each subunit in each species are depicted in blue and red, respectively. Left: species tree as built recovering data from literature (see Evolutionary Rate Correlations subsection of Materials and Methods for details). Top: protein nomenclature; black dots indicate subunits in contact with mitochondria-encoded proteins. Right: taxonomic clades (PB: Protobranchia; PM: Pteriomorphia; PH: Palaeoheterodonta; AN: Anomalodesmata; IM: Imparidentia). Bottom: respective OXPHOS complex.
Fig. 2.
Fig. 2.
ML tree inference of mitochondrial and nuclear data sets. Trees were inferred with RAxML v8.2.11 on the two concatenated data sets. Only topologies are depicted in the figure. Bootstrap supports are depicted over each branch (supports lower than 70 were collapsed; 1,000 bootstrap replicates were performed). Left: mitochondrial topology (the star represents the omitted branching of unionids male mitochondria-encoded subunits. Other DUI species with both genomes available diverged terminally and the splits were collapsed in triangles, that is, Ruditapes philippinarum and Mytilus edulis). Right: nuclear topology. Clade acronyms as in fig. 1.
Fig. 3.
Fig. 3.
Evolutionary rate correlations analysis. (A, B) Correlation graphs between normalized branch lengths (per cumulative length of each tree, that is, cumulative sum of branch lengths for each tree = 1) of mtOXPHOS subunits versus nuOXPHOS subunits (ρ = 0.967; 95% confidence interval: 0.931–0.984; p = 2.2e−16), and mtOXPHOS subunits versus random orthologues (ρ = 0.437; 95% confidence interval: 0.098-0.686 p = 1.39e−2), respectively. (C) The black line represents the values of normalized mtOXPHOS branch lengths for each species in both graphs, the red line follows the values of normalized branch lengths on the same species for nuOXPHOS (average difference = 0.00219), and the blue line represents the branch lengths of random orthologues (average difference = 0.00819). This graph is useful to visualize the greater average difference in random orthologues’ branch lengths with respect to mtOXPHOS ones, compared with the differences between the latter and nuOXPHOS subunits. The lines that link the species are virtual and their purpose is simply to highlight the differences in the three relative trends of branch lengths.
Fig. 4.
Fig. 4.
Evolutionary rate correlations between each complex component. Graphical correlation matrix (Pearson’s r) between each component of each complex and the random orthologues. CII and the random orthologues data set shared lower correlation values with all other complex components, which were generally all consistently correlated with each other.
Fig. 5.
Fig. 5.
Evolutionary rate correlations with positional information of nuOXPHOS subunits. (A, B) Correlations between normalized branch lengths (per cumulative length of each tree) of mtOXPHOS subunits against contact nuOXPHOS subunits (A; ρ = 0.969; p < 2.2e−16) and noncontact ones (B; ρ = 0.951; p = 2.77e−16). (C, D) Correlations between normalized branch lengths (per cumulative length of each tree) of random orthologues against contact nuOXPHOS subunits (C; ρ = 0.533; p = 2.01e−3) and noncontact ones (D; ρ = 0.572; p = 7.83e−4).
Fig. 6.
Fig. 6.
dN/dS distributions of mtOXPHOS subunits, contact nuOXPHOS subunits, and noncontact nuOXPHOS. MtOXPHOS distributions are depicted in orange, nuOXPHOS ones in blue. Black lines within the boxes are the medians; the two hinges of the boxes approximate the first and the third quartile; whiskers extend to a roughly 95% confidence interval. Outliers are represented as black dots. Stars represent statistical significance of the relationship highlighted (single stars indicate statistically significant differences with all other distributions). Top: number of outliers not depicted in the figure. Bottom: Number of subunits included in the distributions. (A) Overall distributions. Noncontact nuOXPHOS subunits had a distribution statistically lower than both the other distributions (indicated by the star). MtOXPHOS and contact nuOXPHOS subunits shared statistically similar distributions. (B) Distributions of dN/dS for each complex and each compartment. Contact subunits are displayed as “cont” while noncontact subunits are displayed as “ncont.”

Similar articles

Cited by

References

    1. Adrion JR, White PS, Montooth KL.. 2016. The roles of compensatory evolution and constraint in aminoacyl tRNA synthetase evolution. Mol Biol Evol. 33(1):152–161. - PMC - PubMed
    1. Allio R, Donega S, Galtier N, Nabholz B.. 2017. Large variation in the ratio of mitochondrial to nuclear mutation rate across animals: implications for genetic diversity and the use of mitochondrial DNA as a molecular marker. Mol Biol Evol. 34(11):2762–2772. - PubMed
    1. Amporndanai K, Johnson RM, O’Neill PM, Fishwick CWG, Jamson AH, Rawson S, Muench SP, Hasnain SS, Antonyuk SV.. 2018. X-ray and cryo-EM structures of inhibitor-bound cytochrome bc1 complexes for structure-based drug discovery. IUCrJ. 5(2):200–210. - PMC - PubMed
    1. Anisimova M, Bielawski JP, Yang Z.. 2002. Accuracy and power of Bayes prediction of amino acid sites under positive selection. Mol Biol Evol. 19(6):950–958. - PubMed
    1. Ballard JW, Whitlock MC.. 2004. The incomplete natural history of mitochondria. Mol Ecol. 13(4):729–744. - PubMed

Publication types

LinkOut - more resources