. 2021 May 27;186(1):599-610.
doi: 10.1093/plphys/kiab074.

The mitochondrial AAA protease FTSH3 regulates Complex I abundance by promoting its disassembly

Affiliations

The mitochondrial AAA protease FTSH3 regulates Complex I abundance by promoting its disassembly

Aneta Ivanova et al. Plant Physiol. .

Abstract

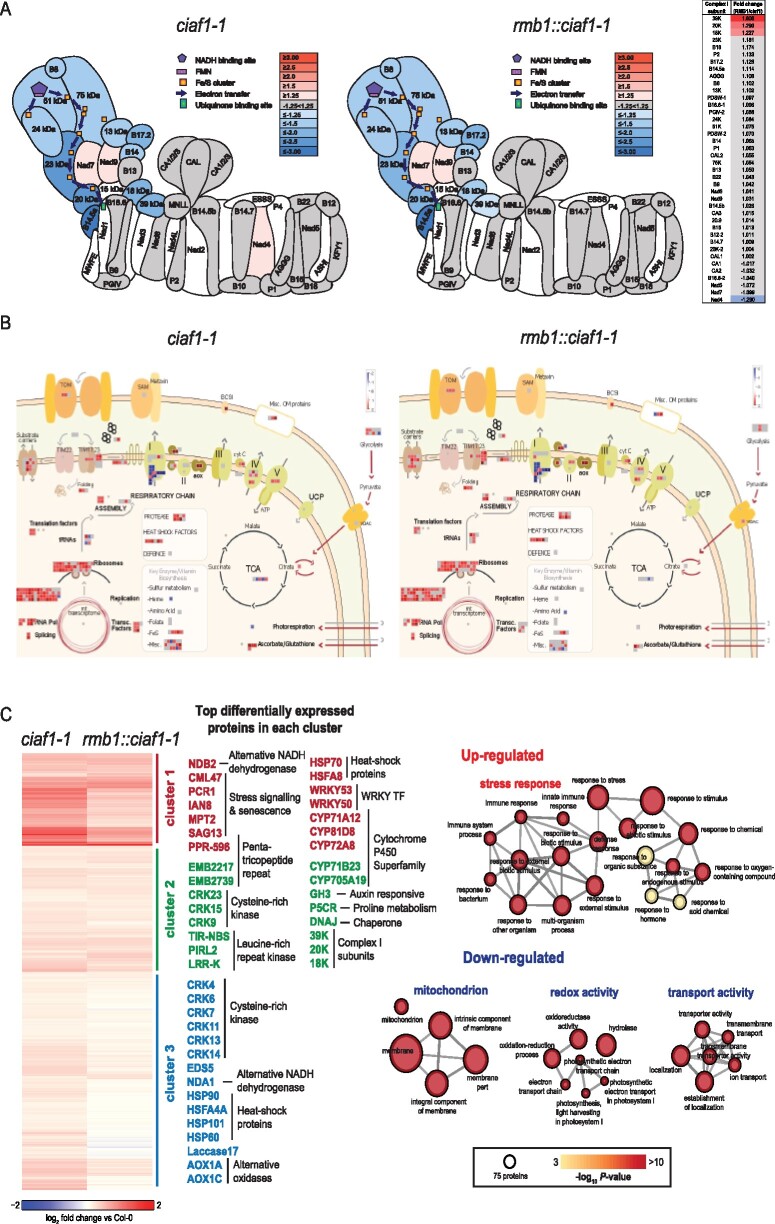
ATP is generated in mitochondria by oxidative phosphorylation. Complex I (NADH:ubiquinone oxidoreductase or NADH dehydrogenase) is the first multisubunit protein complex of this pathway, oxidizing NADH and transferring electrons to the ubiquinone pool. Typically, Complex I mutants display a slow growth rate compared to wild-type plants. Here, using a forward genetic screen approach for restored growth of a Complex I mutant, we have identified the mitochondrial ATP-dependent metalloprotease, Filamentous Temperature Sensitive H 3 (FTSH3), as a factor that is required for the disassembly of Complex I. An ethyl methanesulfonate-induced mutation in FTSH3, named as rmb1 (restoration of mitochondrial biogenesis 1), restored Complex I abundance and plant growth. Complementation could be achieved with FTSH3 lacking proteolytic activity, suggesting the unfoldase function of FTSH3 has a role in Complex I disassembly. The introduction of the rmb1 to an additional, independent, and extensively characterized Complex I mutant, ndufs4, resulted in similar increases to Complex I abundance and a partial restoration of growth. These results show that disassembly or degradation of Complex I plays a role in determining its steady-state abundance and thus turnover may vary under different conditions.


Figures

Figure 1
Figure 1
rmb1::ciaf1-1 is an EMS mutant within FTSH3 that partially restores ciaf1-1 developmental phenotype. A, The ciaf1-1 mutant has a defect in mitochondrial respiratory Complex I assembly and consequently results in a small, developmentally delayed phenotype. An EMS forward genetic screen was carried out on ciaf1-1 resulting in the identification of a mutant named rmb1::ciaf1-1 (restoration of mitochondrial biogenesis 1) where plant growth was partially restored. B, Comprehensive stage growth progression analysis on plates (1.5% [w/v] sucrose MS media) (i) and soil (ii) indicates rmb1::ciaf1-1 reached all growth stages earlier than ciaf1-1. Growth stages are as defined by Boyes et al. (2001). Analysis of growth parameters (iii) such as plant height, number of rosette leaves, rosette radius, and root length indicate rmb1::ciaf1-1 performed significantly better than ciaf1-1 (p < 0.05, Student’s t test, n = 20). C, DNA sequencing confirmed that the mutation responsible for the phenotype was a C to T mutation with the At2g29080 gene. At2g29080 encodes for the mitochondrial AAA ATPase FTSH3 and the C to T mutation at amino acid 415 is within the chaperone ATPase domain. Scale bar = 1 cm.
Figure 2
Figure 2
rmb1::ciaf1-1 partially restored Complex I abundance and activity in ciaf1-1. A, Phenotypic analysis of Col-0, the Complex I mutant ciaf1-1, the EMS mutant rmb1 in the ciaf1-1 background (rmb1::ciaf1-1), rmb1 in a Col-0 background (rmb1::Col-0), the FTSH3 T-DNA insertion line ftsh3-1 (SALK_037144), ftsh3-1 backcrossed to ciaf1-1 (ftsh3-1::ciaf1-1), complemented rmb1 (rmb1::proFTSH3), and a FTSH3 overexpressor (FTSH3 OE). B, Mitochondria were isolated from all lines and resolved by BN-PAGE and stained for Complex I abundance. The position of the major OXPHOS complexes is indicated on the left. Quantification averages of Complex I abundance relative to Col-0 are indicated below. Significant differences are indicated with a * (± se, p < 0.05, Student’s t test, n = 3). C, Mitochondria were isolated from all mutant lines and immunodetected with antibodies against FTSH3, its partner protein FTSH10, and mitochondrial controls COXII and porin. The abundance of Complex I subunits B14.7, 51 kDa, 75 kDa, and CAL were investigated showing little change in abundance across ciaf1-1 and rmb1::ciaf1-1. Phenotypic data is presented in Supplemental Figure S2 and Supplemental Table S2.
Figure 3
Figure 3
Proteomic analysis of rmb1::ciaf1-1 shows no substantial alterations to Complex I abundance. HiRiEF LC/MS proteomics was carried out on Col-0, ciaf1-1, and rmb1::ciaf1-1 rosette leaf tissue. A, Heatmap of Complex I subunits abundance fold change of ciaf1-1 and rmb1::ciaf1-1 compared to Col-0. Right-hand table shows fold-change of individual subunits in rmb1 compared to ciaf1-1, with a notable restoration on 39 kDa, 20 kDa, and 18 kDa subunits (see Supplemental Table S2 for data). B, Mapman visualization of fold changes of mitochondrial proteins in ciaf1-1 and rmb1::ciaf1-1 compared to Col-0. C, Left: heatmap of differentially expressed proteins in ciaf1-1 and rmb1::ciaf1-1 after Euclidian distribution and hierarchical clustering using Ward method (left-hand heatmap), showing a restoration of proteins mainly associated with stress response in all clusters (right-hand list). Right: GO term enrichment analysis of up- and downregulated proteins in ciaf1-1 compared to Col-0. The size of nodes represents the number of proteins in each GO term and the color represents the corresponding –log10  P-value for enrichment after Bonferroni correction. Full proteomic changes are listed in Supplemental Table S3.
Figure 4
Figure 4
Complementation of rmb1::ciaf1-1 with a proteolytic defective FTSH3. A, Complementation of rmb1::ciaf1-1 with FTSH3 (rmb1::proFTSH3) results in the reversion back to the small, developmental delayed phenotype of ciaf1-1. Complementation of rmb1::ciaf1-1 with FTSH3 where the proteolytic domain has been inactivated (rmb1::proFTSH3_TRAP) similarly results in a reversion of phenotype suggesting that the proteolytic domain is not required to achieve complementation. Scale bar = 1 cm. B, Mitochondria were isolated from all lines and resolved by BN-PAGE and stained for Complex I abundance. The position of OXPHOS complexes are indicated on the left. Quantification of Complex I and I+III abundances relative to Col-0 are indicated below. Significant differences are indicated with an asterisk (±sd, P < 0.05, Student’s t test, n = 3). A Coomassie stain of total mitochondrial protein resolved by SDS–PAGE is shown on the right.
Figure 5
Figure 5
The deletion of FTSH3 can restore Complex I abundance in an independent Complex I deletion mutant. A, ndufs4 is a T-DNA insertion knockout line within the Complex I subunit NDUFS4 (SAIL_596_E11; Meyer et al. 2009) that exhibits a substantial loss of Complex I abundance and activity. A filial cross between ftsh3-1 (SALK_037144) and ndufs4 resulted in plants that display an increased growth phenotype, as observed with rmb1::ciaf1-1. B, Mitochondria were isolated from all lines, resolved by BN-PAGE, and stained for Complex I abundance. The positions of OXPHOS complexes are indicated on the left. Quantification averages of Complex I and I+III abundance are indicated below. Significant differences are indicated with an asterisk (±sd, P < 0.05, Student’s t test, n = 3). C, Immunodetection of isolated mitochondria with antibodies against the Complex I subunits B14.7 and NDUFS4, FTSH3, and Tim17-2.

References

    1. Adam Z, Aviv-Sharon E, Keren-Paz A, Naveh L, Rozenberg M, Savidor A, Chen J (2019) The chloroplast envelope protease FTSH11 – interaction with CPN60 and identification of potential substrates. Front Plant Sci 10: 428. - PMC - PubMed
    1. Alonso JM, Stepanova AN, Leisse TJ, Kim CJ, Chen H, Shinn P, Stevenson DK, Zimmerman J, Barajas P, Cheuk R, et al. (2003) Genome-wide insertional mutagenesis of Arabidopsis thaliana. Science 301: 653–657 - PubMed
    1. Amthor JS, Bar-Even A, Hanson AD, Millar AH, Stitt M, Sweetlove LJ, Tyerman SD (2019) Engineering strategies to boost crop productivity by cutting respiratory carbon loss. Plant Cell 31: 297–314 - PMC - PubMed
    1. Bindea G, Mlecnik B, Hackl H, Charoentong P, Tosolini M, Kirilovsky A, Fridman WH, Pages F, Trajanoski Z, Galon J (2009) ClueGO: a Cytoscape plug-in to decipher functionally grouped gene ontology and pathway annotation networks. Bioinformatics 25: 1091–1093 - PMC - PubMed
    1. Boyes DC, Zayed AM, Ascenzi R, McCaskill AJ, Hoffman NE, Davis KR, Gorlach J (2001) Growth stage-based phenotypic analysis of Arabidopsis: a model for high throughput functional genomics in plants. Plant Cell 13: 1499–1510 - PMC - PubMed

Publication types

MeSH terms

Substances

LinkOut - more resources