

Trends in Trauma Admissions During the COVID-19 Pandemic in Los Angeles County, California
- PMID: 33616667
- PMCID: PMC7900857
- DOI: 10.1001/jamanetworkopen.2021.1320
Trends in Trauma Admissions During the COVID-19 Pandemic in Los Angeles County, California
Abstract
Importance: Describing the changes in trauma volume and injury patterns during the course of the coronavirus disease 2019 (COVID-19) pandemic could help to inform policy development and hospital resource planning.
Objective: To examine trends in trauma admissions throughout Los Angeles County (LAC) during the pandemic.
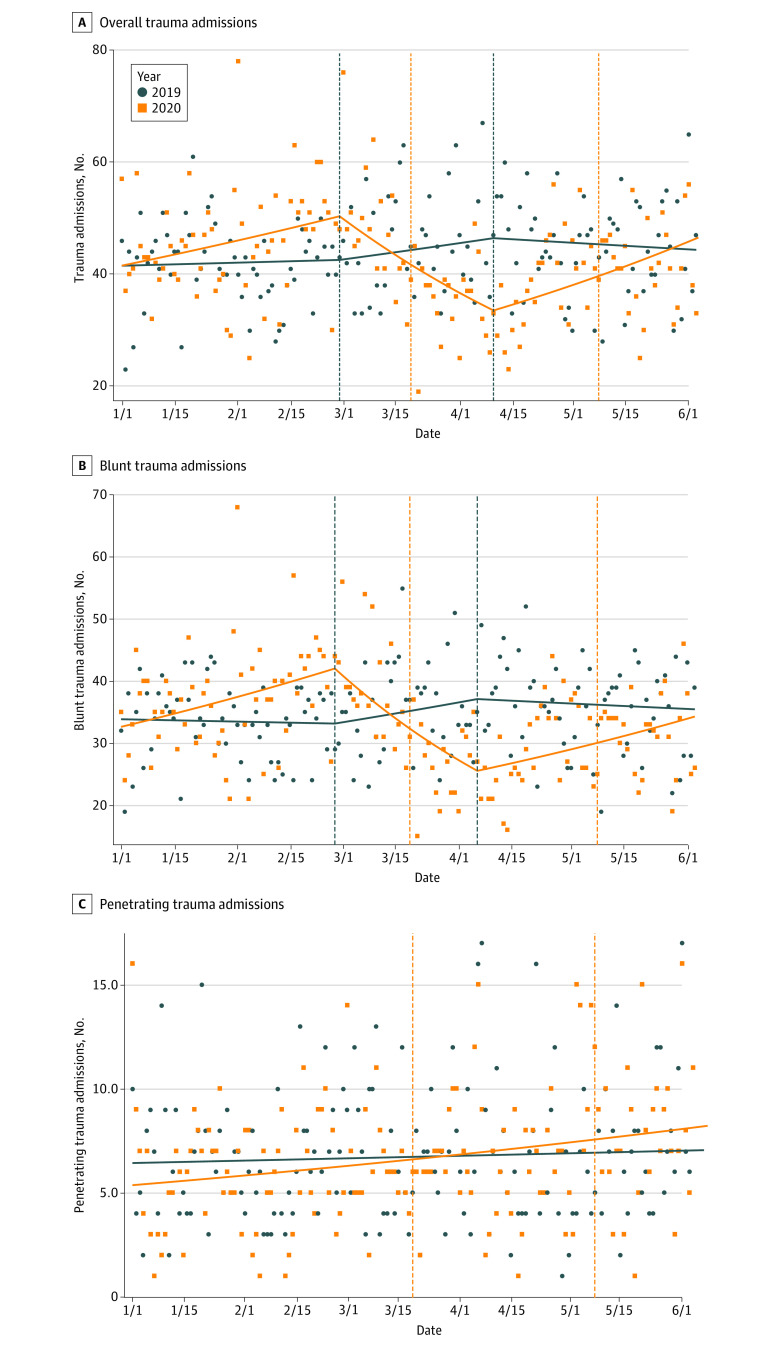
Design, setting, and participants: In this cohort study, all trauma admissions to the 15 verified level 1 and level 2 trauma centers in LAC from January 1 to June 7, 2020 were reviewed. All trauma admissions from the same period in 2019 were used as historical control. For overall admissions, the study period was divided into 3 intervals based on daily admission trend analysis (January 1 through February 28, March 1 through April 9, April 10 through June 7). For the blunt trauma subgroup analysis, the study period was divided into 3 similar intervals (January 1 through February 27, February 28 through April 5, April 6 through June 7).
Exposures: COVID-19 pandemic.
Main outcomes and measures: Trends in trauma admission volume and injury patterns.
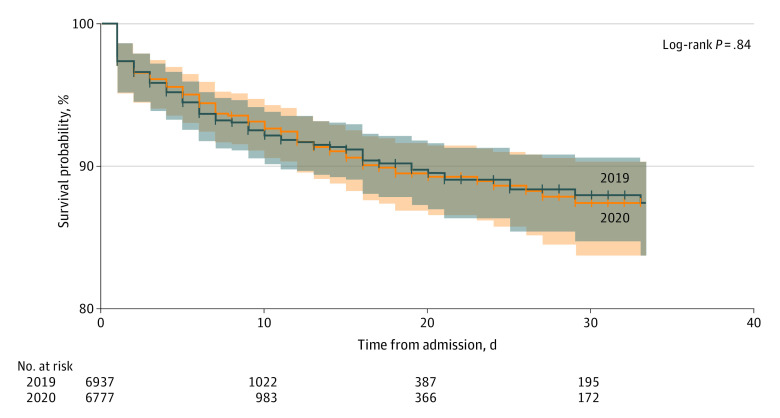
Results: A total of 6777 patients in 2020 and 6937 in 2019 met inclusion criteria. Of those admitted in 2020, the median (interquartile range) age was 42 (28-61) years and 5100 (75.3%) were men. Mechanisms of injury were significantly different between the 2 years, with a higher incidence of penetrating trauma and fewer blunt injuries in 2020 compared with 2019 (penetrating: 1065 [15.7%] vs 1065 [15.4%]; blunt: 5309 [78.3%] vs 5528 [79.7%]). Overall admissions by interval in 2020 were 2681, 1684, and 2412, whereas in 2019 they were 2462, 1862, and 2613, respectively. There was a significant increase in overall admissions per week during the first interval (incidence rate ratio [IRR], 1.02; 95% CI, 1.002-1.04; P = .03) followed by a decrease in the second interval (IRR, 0.92; 95% CI, 0.90-0.94; P < .001) and, finally, an increase in the third interval (IRR, 1.05; CI, 1.03-1.07; P < .001). On subgroup analysis, blunt admissions followed a similar pattern to overall admissions, while penetrating admissions increased throughout the study period.
Conclusions and relevance: In this study, trauma centers throughout LAC experienced a significant change in injury patterns and admission trends during the COVID-19 pandemic. A transient decrease in volume was followed by a quick return to baseline levels. Trauma centers should prioritize maintaining access, capacity, and functionality during pandemics and other national emergencies.
Conflict of interest statement
Figures
References
-
- County of Los Angeles Public Health Public Health confirms first case of 2019 novel coronavirus in Los Angeles County. Updated January 2, 2021. Accessed January 2, 2021. http://www.publichealth.lacounty.gov/phcommon/public/media/mediapubhpdet...
-
- Executive Department: State of California Executive Order N-33-20. Updated March 19, 2020. Accessed October 20, 2020. https://covid19.ca.gov/img/Executive-Order-N-33-20.pdf
-
- Johns Hopkins University and Medicine Coronavirus Resource Center COVID-19 United States cases by county. Updated October 7, 2020. Accessed October 15, 2020. https://coronavirus.jhu.edu/us-map
-
- Johns Hopkins University and Medicine Coronavirus Resource Center Impact of opening and closing decisions by states. Updated August 1, 2020. Accessed November 11, 2020. https://coronavirus.jhu.edu/data/state-timeline
Publication types
MeSH terms
Grants and funding
LinkOut - more resources
Full Text Sources
Other Literature Sources
Medical
Miscellaneous
