

Computational modeling of the gut microbiota reveals putative metabolic mechanisms of recurrent Clostridioides difficile infection
- PMID: 33617526
- PMCID: PMC7932513
- DOI: 10.1371/journal.pcbi.1008782
Computational modeling of the gut microbiota reveals putative metabolic mechanisms of recurrent Clostridioides difficile infection
Abstract
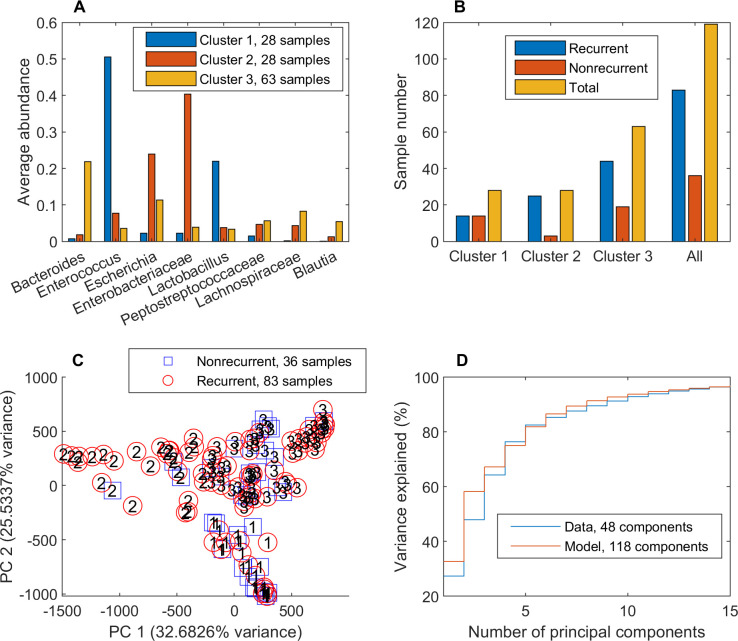
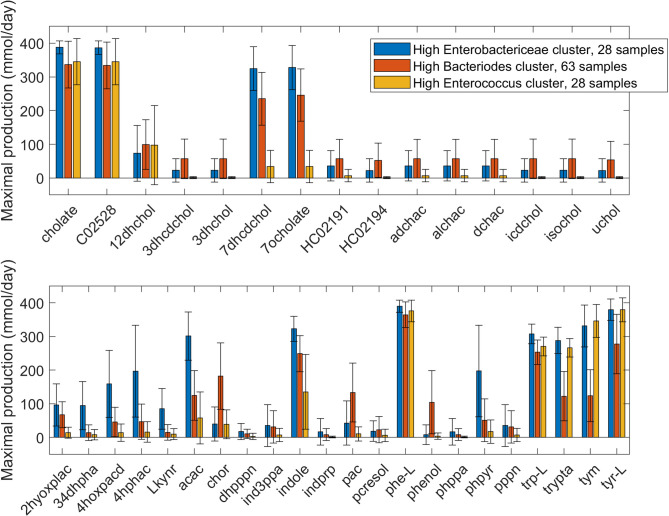
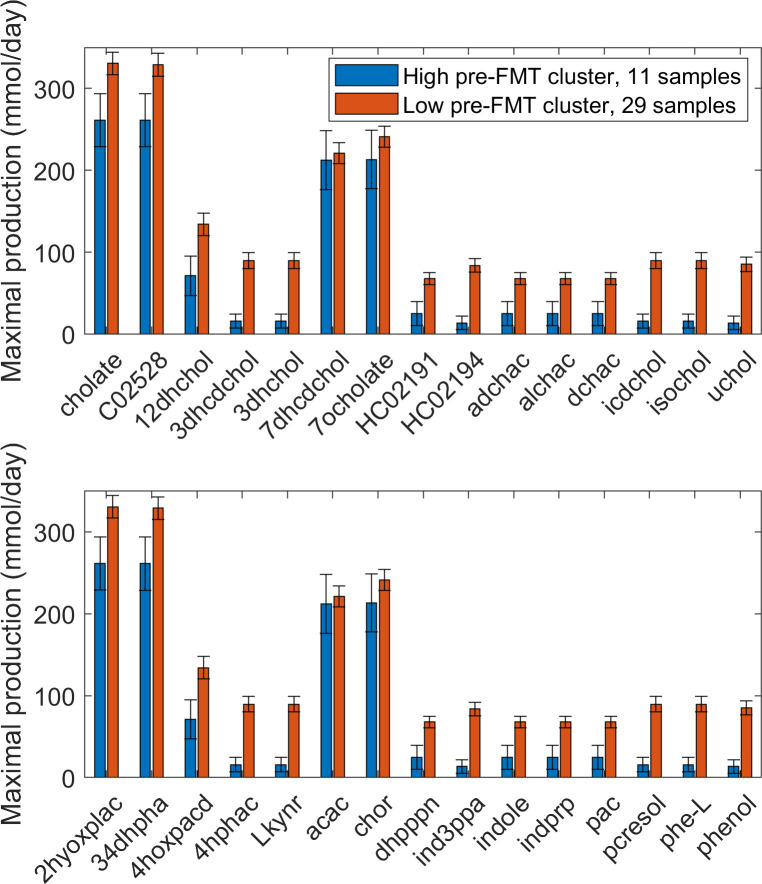
Approximately 30% of patients who have Clostridioides difficile infection (CDI) will suffer at least one incident of reinfection. While the underlying causes of CDI recurrence are poorly understood, interactions between C. difficile and commensal gut bacteria are thought to play an important role. In this study, an in silico pipeline was used to process 16S rRNA gene amplicon sequence data of 225 stool samples from 93 CDI patients into sample-specific models of bacterial community metabolism. Clustered metabolite production rates generated from post-diagnosis samples generated a high Enterobacteriaceae abundance cluster containing disproportionately large numbers of recurrent samples and patients. This cluster was predicted to have significantly reduced capabilities for secondary bile acid synthesis but elevated capabilities for aromatic amino acid catabolism. When applied to 16S sequence data of 40 samples from fecal microbiota transplantation (FMT) patients suffering from recurrent CDI and their stool donors, the community modeling method generated a high Enterobacteriaceae abundance cluster with a disproportionate large number of pre-FMT samples. This cluster also was predicted to exhibit reduced secondary bile acid synthesis and elevated aromatic amino acid catabolism. Collectively, these in silico predictions suggest that Enterobacteriaceae may create a gut environment favorable for C. difficile spore germination and/or toxin synthesis.
Conflict of interest statement
The authors have declared that no competing interests exist.
Figures


Similar articles
-
Metagenomic, metabolomic, and lipidomic shifts associated with fecal microbiota transplantation for recurrent Clostridioides difficile infection.mSphere. 2024 Oct 29;9(10):e0070624. doi: 10.1128/msphere.00706-24. Epub 2024 Oct 8. mSphere. 2024. PMID: 39377587 Free PMC article.
-
Microbiota transplantation restores normal fecal bile acid composition in recurrent Clostridium difficile infection.Am J Physiol Gastrointest Liver Physiol. 2014 Feb 15;306(4):G310-9. doi: 10.1152/ajpgi.00282.2013. Epub 2013 Nov 27. Am J Physiol Gastrointest Liver Physiol. 2014. PMID: 24284963 Free PMC article.
-
Inhibiting Growth of Clostridioides difficile by Restoring Valerate, Produced by the Intestinal Microbiota.Gastroenterology. 2018 Nov;155(5):1495-1507.e15. doi: 10.1053/j.gastro.2018.07.014. Epub 2018 Jul 17. Gastroenterology. 2018. PMID: 30025704 Free PMC article.
-
Understanding the mechanisms of efficacy of fecal microbiota transplant in treating recurrent Clostridioides difficile infection and beyond: the contribution of gut microbial-derived metabolites.Gut Microbes. 2020 Nov 9;12(1):1810531. doi: 10.1080/19490976.2020.1810531. Gut Microbes. 2020. PMID: 32893721 Free PMC article. Review.
-
Bile acids impact the microbiota, host, and C. difficile dynamics providing insight into mechanisms of efficacy of FMTs and microbiota-focused therapeutics.Gut Microbes. 2024 Jan-Dec;16(1):2393766. doi: 10.1080/19490976.2024.2393766. Epub 2024 Sep 3. Gut Microbes. 2024. PMID: 39224076 Free PMC article. Review.
Cited by
-
Animal and In Vitro Models as Powerful Tools to Decipher the Effects of Enteric Pathogens on the Human Gut Microbiota.Microorganisms. 2023 Dec 29;12(1):67. doi: 10.3390/microorganisms12010067. Microorganisms. 2023. PMID: 38257894 Free PMC article. Review.
-
Computational approaches to understanding Clostridioides difficile metabolism and virulence.Curr Opin Microbiol. 2022 Feb;65:108-115. doi: 10.1016/j.mib.2021.11.002. Epub 2021 Nov 25. Curr Opin Microbiol. 2022. PMID: 34839237 Free PMC article. Review.
-
Panera: An innovative framework for surmounting uncertainty in microbial community modeling using pan-genera metabolic models.iScience. 2024 Jun 22;27(7):110358. doi: 10.1016/j.isci.2024.110358. eCollection 2024 Jul 19. iScience. 2024. PMID: 39092173 Free PMC article.
-
Wolf in Sheep's Clothing: Clostridioides difficile Biofilm as a Reservoir for Recurrent Infections.Microorganisms. 2021 Sep 10;9(9):1922. doi: 10.3390/microorganisms9091922. Microorganisms. 2021. PMID: 34576818 Free PMC article. Review.
-
Metagenome-Scale Metabolic Network Suggests Folate Produced by Bifidobacterium longum Might Contribute to High-Fiber-Diet-Induced Weight Loss in a Prader-Willi Syndrome Child.Microorganisms. 2021 Dec 1;9(12):2493. doi: 10.3390/microorganisms9122493. Microorganisms. 2021. PMID: 34946095 Free PMC article.
References
MeSH terms
Substances
LinkOut - more resources
Full Text Sources
Other Literature Sources
