. 2021 Feb 22;16(2):e0247294.
doi: 10.1371/journal.pone.0247294. eCollection 2021.

A model of infection in honeybee colonies with social immunity

Affiliations

A model of infection in honeybee colonies with social immunity

Teeraphan Laomettachit et al. PLoS One. .

Abstract

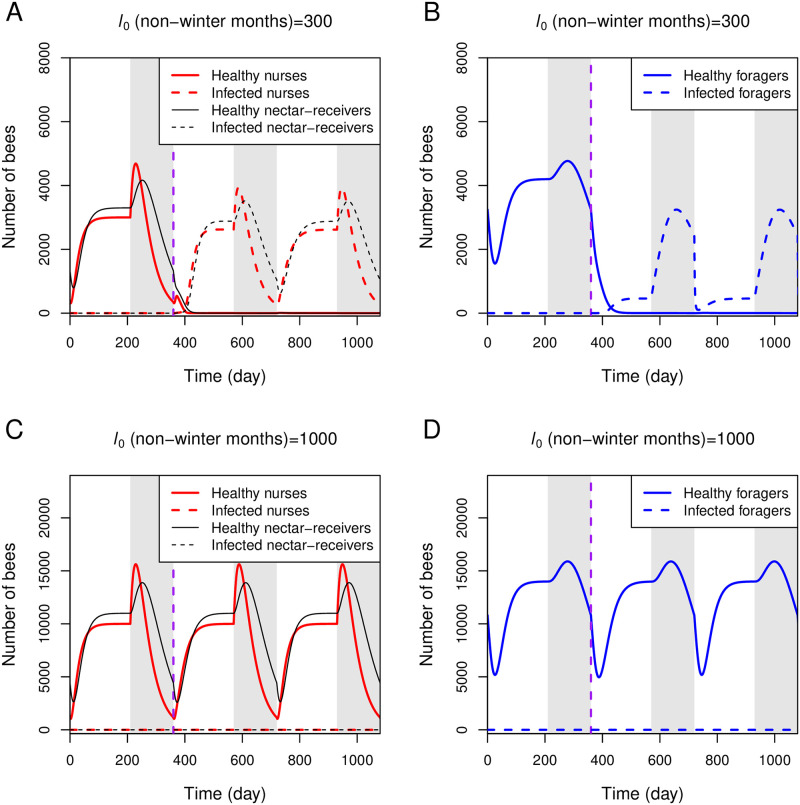
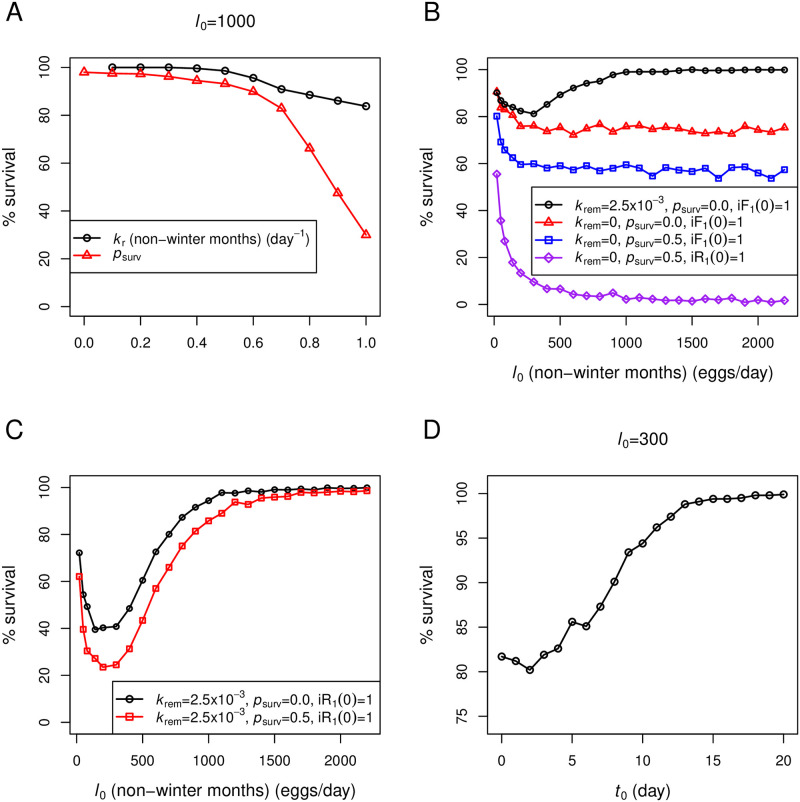
Honeybees (Apis mellifera) play a significant role in the pollination of various food crops and plants. In the past decades, honeybee management has been challenged with increased pathogen and environmental pressure associating with increased beekeeping costs, having a marked economic impact on the beekeeping industry. Pathogens have been identified as a contributing cause of colony losses. Evidence suggested a possible route of pathogen transmission among bees via oral-oral contacts through trophallaxis. Here we propose a model that describes the transmission of an infection within a colony when bee members engage in the trophallactic activity to distribute nectar. In addition, we examine two important features of social immunity, defined as collective disease defenses organized by honeybee society. First, our model considers the social segregation of worker bees. The segregation limits foragers, which are highly exposed to pathogens during foraging outside the nest, from interacting with bees residing in the inner parts of the nest. Second, our model includes a hygienic response, by which healthy nurse bees exterminate infected bees to mitigate horizontal transmission of the infection to other bee members. We propose that the social segregation forms the first line of defense in reducing the uptake of pathogens into the colony. If the first line of defense fails, the hygienic behavior provides a second mechanism in preventing disease spread. Our study identifies the rate of egg-laying as a critical factor in maintaining the colony's health against an infection. We propose that winter conditions which cease or reduce the egg-laying activity combined with an infection in early spring can compromise the social immunity defenses and potentially cause colony losses.


Conflict of interest statement

The authors have declared that no competing interests exist.

Figures

Fig 1
Fig 1. Model diagram.
Upper: Core model. Lower: Extended model. The diagram illustrates class (horizontal arrows) and state (vertical arrows) transitions of honeybees. The queen produces new brood (B). As bees are older, they change their classes from brood (B), nurses (N), nectar-receivers (R0 and R1), to foragers (F0 and F1). Bees can change into an infection state (iB, iN, iR0, iR1) with a certain probability if they receive nectar from infected ones. Nectar-receivers and foragers can also change their nectar-loaded state between unloaded (subscript 0) and loaded (subscript 1). φ represents ‘death’. See the main text for a more detailed description of each transition. The full model is composed of both core and extended parts.
Fig 2
Fig 2. Role of the hygienic behavior (krem).
A: Healthy brood and nurses in a colony with the hygienic behavior are maintained against an infection. The simulation is based on Eqs 1–4 with model parameters listed in Table 1 with l0 = 120 and krem = 2.5 × 10⁻³. We treat pt1kRN ⋅ iR1 as a parameter, which is equal to 5 × 10⁻⁴. The infection is introduced (pt1kRN ⋅ iR1 = 5 × 10⁻⁴) at day 20 (vertical purple line). B: All brood and nurses in a colony without the hygienic behavior become infected. The simulation setting is the same as in panel A, except that krem = 0. C: The steady-state number of healthy nurses is plotted as krem is varied while other parameters are fixed. Bold lines represent a stable steady-state and a thin line represents an unstable steady-state. D: The 2-parameter bifurcation diagram is plotted as both krem and pt0 are varied. The diagram is divided into three regions depending on the state of the colony (healthy, bistable, and infected).
Fig 3
Fig 3. Role of the egg-laying rate (l0).
A: All brood and nurses in a small-size colony (e.g., colony with a low egg-laying rate) become infected even with the hygienic behavior response. The simulation setting is the same as in Fig 2A, except that l0 = 70. The infection is introduced (pt1kRN ⋅ iR1 = 5 × 10⁻⁴) at day 20 (vertical purple line). B: The two-parameter bifurcation diagram is plotted between l0 and pt0 while other parameters are fixed. The red letters a and b mark the critical values of l0, below which the colonies are always infected when pt0 is 0.3 and 0.5, respectively. C: Simulation of three colonies with the same parameter set from Fig 2A, but the simulation begins with 2400 initial healthy brood and different initial numbers of healthy nurses. The infection is introduced (pt1kRN ⋅ iR1 = 5 × 10⁻⁴) at day 0. D: Simulation setting is the same as that of panel C, except that the initial number of healthy brood is 600.
Fig 4
Fig 4. Role of the probability of nurses being infected from infected brood (pt,rem) and the death rate of infected bees (kd).
The two-parameter bifurcation diagrams are plotted between A: krem and pt,rem, B: l0 and pt,rem, C: krem and kd, and D: l0 and kd. The diagrams are divided into regions corresponding to the state of the colony (healthy, bistable, and infected).
Fig 5
Fig 5. Simulations of the full model.
The full model is simulated with parameters listed in Table 1 with l0 = 120 (panels A and B) and l0 = 70 (panels C and D). One infected forager returning from nectar-collecting (iF1) is introduced at day 20 (iF1(20) = 1) (vertical purple line).
Fig 6
Fig 6. Simulations of the full model under seasonal effects.
The full model is simulated with parameters listed in Table 1 under seasonal effects. During winter (grey stripes), which lasts five months a year, we set l0 = 0, kr = 0, and nN, nR, and nF are increased 4-folds. A and B: l0 during non-winter months = 300. C and D: l0 during non-winter months = 1000. One infected forager returning from nectar-collecting (iF1) is introduced at day 360 (vertical purple line).
Fig 7
Fig 7. Stochastic simulations of the full model under seasonal effects.
Stochastic simulations of two independent colonies under an identical condition are shown in upper and lower panels, respectively. Seasonal effects are implemented, as described in Fig 6 and the main text. Both colonies are simulated with the same parameter set (l0 during non-winter months = 1000 and other parameters from Table 1). One infected forager returning from nectar-collecting (iF1) is introduced at day 360 (vertical purple line).
Fig 8
Fig 8. Percentages of survived colonies from stochastic simulations.
Percentages of survived colonies are calculated from 1000 repeats of stochastic simulations. Model parameters are from Table 1, except those that are listed in each figure panel. Seasonal effects are implemented as described in the main text. A: kr during non-winter months (black line) or psurv (red line) is varied. B and C: l0 during non-winter months is varied. D: The timing of an infection (t0) is varied in relation to the onset of spring (i.e., iF1(t0) = 1).

References

    1. Klein AM, Vaissiere BE, Cane JH, Steffan–Dewenter I, Cunningham SA, Kremen C, et al. Importance of pollinators in changing landscapes for world crops. Proc Biol Sci. 2007;274(1608):303–13. 10.1098/rspb.2006.3721 - DOI - PMC - PubMed
    1. Gallai N, Salles JM, Settele J, Vaissiere BE. Economic valuation of the vulnerability of world agriculture confronted with pollinator decline. Ecol Econom. 2009;68(3):810–21. 10.1016/j.ecolecon.2008.06.014 - DOI
    1. Oldroyd BP. What’s killing American honey bees. PLOS Biol. 2007;5(6):e168 10.1371/journal.pbio.0050168 - DOI - PMC - PubMed
    1. Potts SG, Biesmeijer JC, Kremen C, Neumann P, Schweiger O, Kunin WE. Global pollinator declines: Trends, impacts and drivers. Trends Ecol Evol. 2010;25(6):345–53. 10.1016/j.tree.2010.01.007 - DOI - PubMed
    1. Potts SG, Roberts SPM, Dean R, Marris G, Brown MA, Jones R, et al. Declines of managed honey bees and beekeepers in Europe. J Apic Res. 2010;49(1):15–22. 10.3896/IBRA.1.49.1.02 - DOI

Publication types

LinkOut - more resources