. 2021 Jan-Jun:296:100442.
doi: 10.1016/j.jbc.2021.100442. Epub 2021 Feb 19.

AKAP79/150 coordinates leptin-induced PKA signaling to regulate KATP channel trafficking in pancreatic β-cells

Affiliations

AKAP79/150 coordinates leptin-induced PKA signaling to regulate KATP channel trafficking in pancreatic β-cells

Veronica A Cochrane et al. J Biol Chem. 2021 Jan-Jun.

Abstract

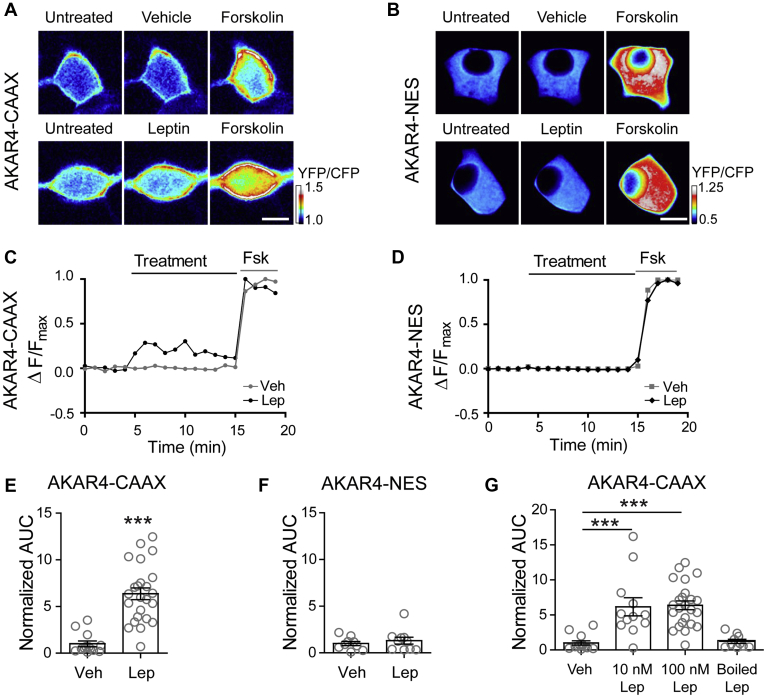
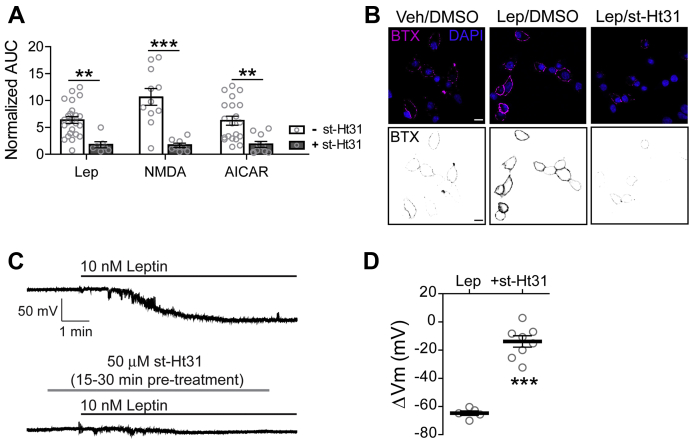
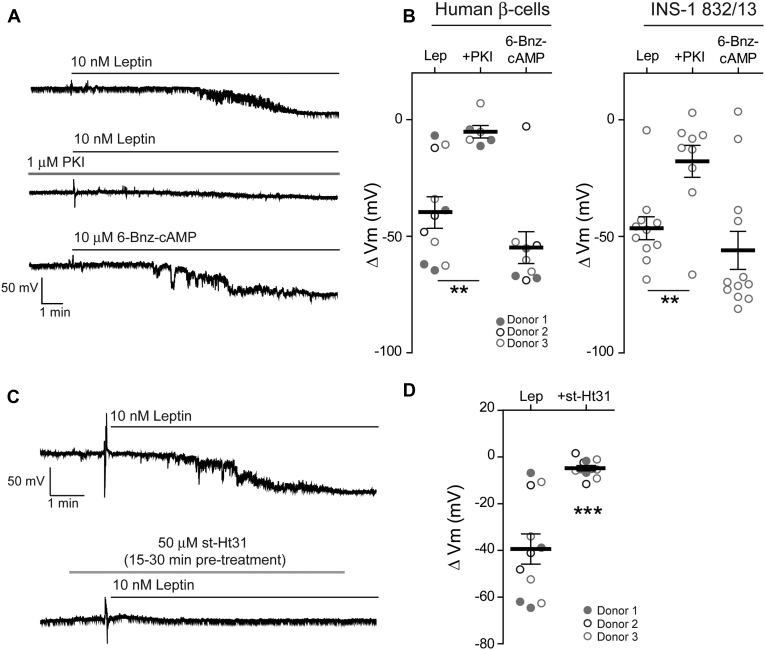
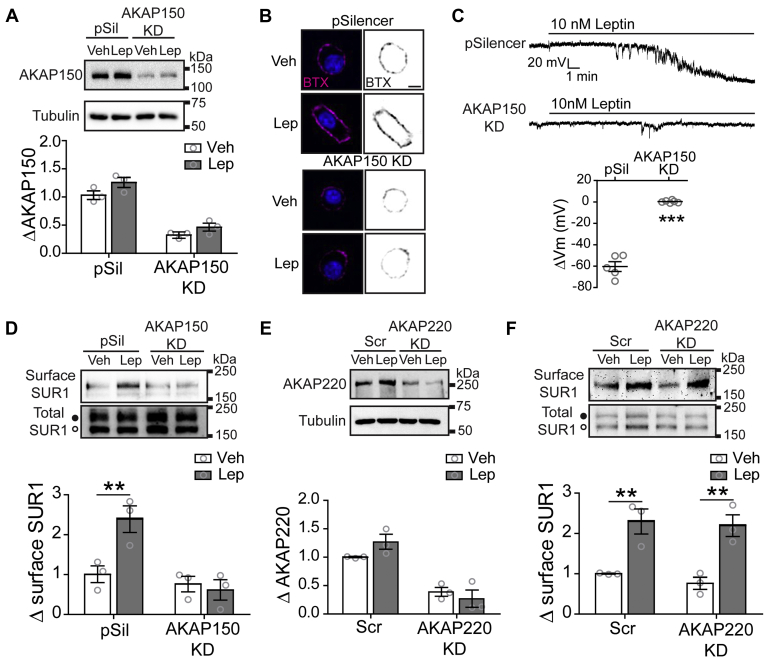
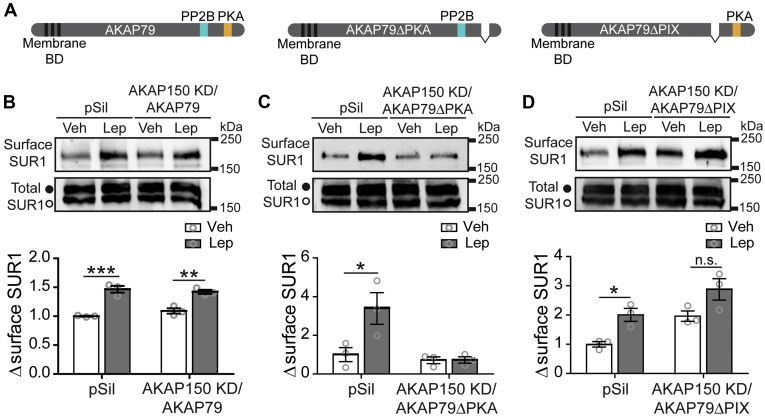
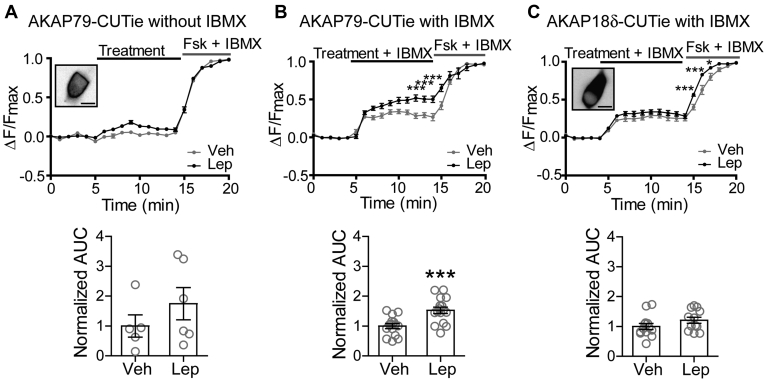
The adipocyte hormone leptin regulates glucose homeostasis both centrally and peripherally. A key peripheral target is the pancreatic β-cell, which secretes insulin upon glucose stimulation. Leptin is known to suppress glucose-stimulated insulin secretion by promoting trafficking of KATP channels to the β-cell surface, which increases K+ conductance and causes β-cell hyperpolarization. We have previously shown that leptin-induced KATP channel trafficking requires protein kinase A (PKA)-dependent actin remodeling. However, whether PKA is a downstream effector of leptin signaling or PKA plays a permissive role is unknown. Using FRET-based reporters of PKA activity, we show that leptin increases PKA activity at the cell membrane and that this effect is dependent on N-methyl-D-aspartate receptors, CaMKKβ, and AMPK, which are known to be involved in the leptin signaling pathway. Genetic knockdown and rescue experiments reveal that the increased PKA activity upon leptin stimulation requires the membrane-targeted PKA-anchoring protein AKAP79/150, indicating that PKA activated by leptin is anchored to AKAP79/150. Interestingly, disrupting protein phosphatase 2B (PP2B) anchoring to AKAP79/150, known to elevate basal PKA signaling, leads to increased surface KATP channels even in the absence of leptin stimulation. Our findings uncover a novel role of AKAP79/150 in coordinating leptin and PKA signaling to regulate KATP channel trafficking in β-cells, hence insulin secretion. The study further advances our knowledge of the downstream signaling events that may be targeted to restore insulin secretion regulation in β-cells defective in leptin signaling, such as those from obese individuals with type 2 diabetes.

Keywords: A-kinase anchoring protein (AKAP); ATP-sensitive potassium channel; cyclic AMP (cAMP); fluorescence resonance energy transfer (FRET); leptin; protein kinase A (PKA).


Conflict of interest statement

Conflict of interest The authors declare that they have no conflicts of interest with the contents of this article.

Figures

Figure 1
Figure 1
Leptin increases PKA activity.A, B, ratiometric images of INS-1 832/13 cells transfected with the FRET-based PKA activity reporter A-kinase activity reporter 4 (AKAR4), which has been targeted to the plasma membrane with a farnesylation motif (AKAR4-CAAX) or to the cytoplasm with a nuclear export signal (AKAR4-NES). Cells were treated with vehicle or leptin (100 nM) followed by the robust PKA activator forskolin (20 μM). Scale bar, 5 μm. C, D, FRET traces of the cells in (A, B) normalized to the maximal forskolin response. E, group analysis of AKAR4-CAAX cell traces. Graph shows the fold-change in area under the curve (AUC) normalized to vehicle treatment (n = 13). In total, 100 nM leptin (n = 24) was used for these experiments. ∗∗∗p < 0.0001 by unpaired student's t-test. F, group data of AKAR4-NES expressing cells treated with vehicle (n = 9) or 100 nM leptin (n = 10). G, group analysis for AKAR4-CAAX cells treated with vehicle (n = 13), 10 nM leptin (n = 12), 100 nM leptin (n = 24), or boiled 100 nM leptin (n = 10). ∗∗∗p < 0.001 by one-way ANOVA (F(3,55) = 15.05, p < 0.0001) followed by a post hoc Dunnett's multiple comparison test. In all figures, circles represent individual cells except as otherwise specified.
Figure 2
Figure 2
Leptin activates PKA via the NMDAR-CaMKKβ-AMPK signaling cascade. INS-1 832/13 cells were transfected with AKAR4-CAAX followed by various treatments. A, PKA activity in response to 100 nM leptin (n = 24) alone or in the presence of the NMDAR inhibitor D-APV (50 μM; n = 12), the Ca2+ chelator BAPTA (10 mM; n = 11), the CaMKKβ inhibitor STO-609 (1 μM; n = 9), or the AMPK inhibitor Compound C (CC, 1 μM; n = 15). Treatments were compared with vehicle control (n = 13). ∗∗∗p < 0.001 as determined by one-way ANOVA (F(4,66) = 12.13, p < 0.0001) followed by a post hoc Dunnett's multiple comparison test. B, effects of NMDAR coagonists NMDA/glycine (100 μM/100 μM; n = 11) and the AMPK activator AICAR (500 μM; n = 20) on PKA activity. ∗∗p < 0.01, ∗∗∗p < 0.001 by one-way ANOVA (F(3,64) = 15.77, p < 0.0001) followed by a post hoc Tukey's multiple comparison test. C, PKA activity in response to NMDAR activation by NMDA/glycine in the absence or presence of the AMPK inhibitor CC (1 μM; p = 0.002, n = 10) and to AMPK activation by AICAR in the absence or presence of the NMDAR inhibitor D-APV (50 μM; p = 0.99 n = 10). Statistical analysis by unpaired student's t-test.
Figure 3
Figure 3
Leptin signaling through PKA requires an A-kinase anchoring protein (AKAP).A, effects of the PKA–AKAP interaction disruptor peptide st-Ht31 on PKA activity. Group FRET data of cells expressing AKAR4-CAAX in response to various stimuli: 100 nM leptin (n = 7), NMDAR coagonists NMDA/glycine (100 μM/100 μM) (n = 8), and AMPK activator AICAR (500 μM) (n = 10) in the presence of st-Ht31 (50 μM). Results are compared with those shown in Figure 2B of cells treated with leptin (n = 24), NMDA/glycine (n = 11) and AICAR (n = 20) in the absence of st-Ht31 ∗∗p < 0.01, ∗∗∗p < 0.001. Data was analyzed by two-way ANOVA followed by a post hoc Bonferroni's test. Analysis revealed significant main effects of st-Ht31 (F1,74 = 54.17, p < 0.0001), but no significant main effects of stimuli (F2,74 = 2.76, p = 0.07) nor a significant interaction between these variables (F2,74 = 3.11, p = 0.05). B, INS-1 832/13 cells transduced with bungarotoxin binding motif-tagged SUR1 (BTX-SUR1) and Kir6.2 subunits of KATP channels and treated with leptin (10 nM) for 30 min in the presence of 0.01% DMSO or 50 μM st-Ht31. Surface KATP channels were then labeled with Alexa 555-conjugated bungarotoxin (BTX) and nuclei were stained with DAPI. Top panels show representative confocal microscopy images. Inverse gray scale representations of BTX-labeled surface KATP channels are shown in bottom panels. Scale bar, 10 μm. C, representative INS-1 832/13 cell-attached membrane recordings in response to leptin (10 nM) in the absence or presence of st-Ht31 (50 μM) preincubation (15–30 min). D, group data showing the extent of membrane hyperpolarization in response to leptin without st-Ht31 preincubation (−64.76 ± 1.61 mV, n = 5) or with st-Ht31 preincubation (−14.53 ± 3.96 mV, n = 8). ∗∗∗p < 0.001 by unpaired student's t-test. For graph analysis of membrane potential recordings, the mean is represented by a thick line with error bars depicting the standard error of the mean.
Figure 4
Figure 4
AKAP anchoring of PKA is necessary for leptin-induced hyperpolarization in human β-cells.A, representative cell-attached membrane recordings of individual human β-cells treated with 10 nM leptin (top), leptin in the presence of the PKA inhibitor PKI (middle; PKI, 1 μM), or the PKA-specific activator 6-Bnz-cAMP (bottom; 6-Bnz-cAMP, 10 μM). B, group analysis of the extent of membrane hyperpolarization of human β-cells (left) or INS-1 832/13 cells (right) treated with leptin (human β-cells: –39.40 ± 6.46 mV, n = 11; INS-1 832/13 cells: –46.49 ± 4.92 mV, n = 11), leptin with PKI (human β-cells: –5.18 ± 2.65 mV, n = 6; INS-1 832/13 cells: –17.82 ± 6.88 mV, n = 9), or 6-Bnz-cAMP (human β-cells: –54.84 ± 6.83 mV, n = 9; INS-1 832/13 cells: –56.00 ± 8.15 mV, n = 12). ∗∗p < 0.01 by one-way ANOVA followed by a post hoc Dunnett's multiple comparison test. C, representative membrane potential recordings of human β-cells in response to leptin (10 nM) following preincubation without (top) or with 50 μM st-Ht31 (bottom) for 15–30 min. D, group data of human β-cells showing the degree of membrane hyperpolarization in response to leptin without st-Ht31 preincubation (–39.40 ± 6.46 mV, n = 11) or with st-Ht31 preincubation (–4.81 ± 1.13 mV, n = 11). ∗∗∗p < 0.0001 by unpaired student's t-test. Donors are indicated by the circle color and fill.
Figure 5
Figure 5
AKAP150 is necessary for leptin-induced KATPchannel trafficking.A, INS-1 832/13 cells transfected with the control pSilencer vector (pSil) or AKAP150 shRNAi (AKAP150 KD) and analyzed for AKAP150 expression via western blot (top). Graph shows quantification of AKAP150 relative to tubulin (bottom). Analysis determined significant main effects of cells (F(1,8) = 113.37, p < 0.0001), treatment (F(1,8) = 6.68, p = 0.03), but no significant interaction between these variables (F(1,8) = 0.38, p = 0.55). B, confocal images of BTX labeled surface KATP channels following vehicle or 10 nM leptin treatment in pSil and AKAP150 KD cells (top panels). Bottom panels show inverse gray scale representations. Scale bar, 5 μm. C, representative membrane potential recordings from pSil (top; –60.40 ± 4.60 mV, n = 5) and AKAP150 KD (bottom; 0.30 ± 0.49 mV, n = 6) cells treated with 10 nM leptin. Below the traces is the group analysis of the extent of membrane hyperpolarization. ∗∗∗p < 0.0001 by unpaired student's t-test. D, surface biotinylation experiments. Western blots show surface expression of the KATP channel subunit SUR1 and total SUR1 in pSil and AKAP150 KD cells treated with vehicle or 10 nM leptin (top). Note, the upper band in the total SUR1 corresponds to the complex-glycosylated SUR1 (filled circles) that traffics to the surface and the lower band corresponds to the ER-core glycosylated SUR1 (open circle). Normalized quantification of surface SUR1 relative to total upper SUR1 band, which represents mature KATP channels that may be trafficked to the cell membrane (bottom). Data analysis revealed significant main effects of cells (F(1,8) = 15.79, p = 0.004), treatment (F(1,8) = 5.95, p = 0.04), and a significant interaction between these variables (F(1,8) = 9.18, p = 0.016). E, western blot analysis (top) and quantification (bottom) of AKAP220 expression in control scramble siRNA (Scr) or AKAP220 siRNA (AKAP220 KD) cells. Significant main effects of cells (F(1,8) = 56.41, p < 0.0001), no effect of treatment (F(1,8) = 0.43, p = 0.53), and no interaction (F(1,8) = 3.16, p = 0.11) by two-way ANOVA. F, western blots showing the effects of AKAP220 siRNA on surface SUR1 relative to total SUR1. Analysis determined no effect of cells (F(1,8) = 0.61, p = 0.48), a significant effect of treatment (F(1,8) = 38.89, p = 0.0002), and no significant interaction between these variables (F(1,8), = 0.10, p = 0.76). Biochemical experiments (A, D, E, F) were repeated three times (n = 3; represented as circles) and normalized to vehicle-treated controls. ∗∗p < 0.01, ∗∗∗p < 0.001 by two-way ANOVA followed by a post hoc Bonferroni's test unless stated otherwise.
Figure 6
Figure 6
AKAP79 rescues leptin-induced KATPchannel trafficking in AKAP150 KD cells.A, schematic of AKAP79 showing key membrane binding domains (BD) as well as PP2B and PKA binding regions. B, INS-1 832/13 cells were transfected with control pSilencer vector (pSil) or cotransfected with AKAP150 shRNAi and WT AKAP79 (AKAP150 KD/AKAP79). Transfected cells were treated with vehicle or 10 nM leptin for 30 min followed by surface biotinylation. Western blots show surface SUR1 and total SUR1 (top). Quantification of surface SUR1 relative to total upper SUR1 band (bottom). There was a significant effect of treatment (F(1,8) = 91.33, p < 0.0001), no significant effect of cells (F(1,8) = 0.33, p = 0.58), and no interaction between these variables (F(1,8) = 2.624, p = 0.14). C, same as (B) except AKAP150 KD cells were cotransfected with AKAP79 mutants that cannot bind PKA (AKAP150 KD/AKAP79ΔPKA). Both cells (F(1,8) = 10.18, p = 0.0128) and treatment (F(1,8) = 6.73, p = 0.0319) had significant effects in these experiments, and there was a significant interaction between these variables (F(1,8) = 6.573, p = 0.033). D, same as (B) except AKAP150 KD cells were cotransfected with AKAP79 mutants that cannot bind PP2B (AKAP150 KD/AKAP79ΔPIX). Analysis of these data revealed that both cells (F(1,8) = 15.08, p = 0.0047) and treatment (F(1,8) = 16.61, p = 0.0036) had significant effects, but there was no interaction between the two (F(1,8) = 0.039, p = 0.8485). Each experiment was performed three independent times (n = 3; shown as circles) and results were normalized to vehicle-treated control pSil cells. ∗p < 0.05, ∗∗p < 0.01, ∗∗∗p < 0.001 by two-way ANOVA followed by a post hoc Bonferroni's test.
Figure 7
Figure 7
Leptin increases cAMP levels near AKAP79.A, cAMP CUTie sensor targeted to AKAP79 (human orthologue of AKAP150) was utilized to detect changes in cAMP levels in response to vehicle or 100 nM leptin. The average FRET traces (top) and the group data of FRET traces analyzed for area under the curve (bottom) are shown. Inset shows INS-1 832/13 cell expressing AKAP79-CUTie sensor. Scale bar, 10 μm. B, experiments in (A) were repeated in the presence of the phosphodiesterase inhibitor IBMX (50 μM) to prevent rapid degradation of cAMP. Two-way ANOVA analysis of average traces determined a significant effect of treatment (F(1,629) = 40.08, p < 0.0001) and time (F(20,629) = 212.5, p < 0.0001) and there was a significant interaction between these variables (F(20,629) = 3.96, p < 0.0001). This was followed by a post hoc pairwise comparison of time points by Bonferroni's test ∗∗∗p < 0.0001 (top). Below, normalized AUC was analyzed by unpaired student's t-test (∗∗∗p < 0.0005). C, same as (B) except cAMP levels were monitored using the AKAP18δ-CUTie sensor, which is largely expressed in the cytosol as shown in the inset. Average traces were analyzed by two-way ANOVA, which revealed a significant effect of treatment (F(1,629) = 46.10, p < 0.0001) and time (F(20,629) = 339.8, p < 0.0001) and there was a significant interaction between these variables (F(20,629) = 2.27, p = 0.0014). ∗p < 0.05, ∗∗∗p < 0.001 by post hoc Bonferroni's test (traces, top). Scale bar, 10 μm.
Figure 8
Figure 8
Proposed model depicting AKAP79/150 mediates leptin signaling to regulate KATPchannel trafficking. AKAP79/150 is a scaffolding protein that creates PKA signaling microdomains localized at cell membranes. AKAP79/150 also anchors PP2B, which opposes PKA activity by dephosphorylating PKA substrates and ACs, which enhance PKA activity by producing the PKA activator cAMP. Signaling complexes coordinated by AKAP79/150 allow for PKA signaling to be tightly regulated. In pancreatic β-cells AKAP79/150 anchoring of PKA renders a localized increase of PKA activity following leptin activation of Src kinase to initiate the NMDAR–CaMKKβ–AMPK signaling cascade. This enhancement of PKA activity may at least in part be due to the leptin signaling axis increasing cAMP levels near AKAP79/150. Actin remodeling downstream of PKA allows for increased KATP channel trafficking and a subsequent increase in K+ conductance, which causes cell hyperpolarization and suppresses GSIS.

References

    1. Seufert J., Kieffer T.J., Leech C.A., Holz G.G., Moritz W., Ricordi C., Habener J.F. Leptin suppression of insulin secretion and gene expression in human pancreatic islets: Implications for the development of adipogenic diabetes mellitus. J. Clin. Endocrinol. Metab. 1999;84:670–676. - PMC - PubMed
    1. Kieffer T.J., Heller R.S., Leech C.A., Holz G.G., Habener J.F. Leptin suppression of insulin secretion by the activation of ATP-sensitive K + channels in pancreatic p-cells. Diabetes. 1997;46:1087–1093. - PMC - PubMed
    1. Emilsson V., Liu Y.L., Cawthorne M. a, Morton N.M., Davenport M. Expression of the functional leptin receptor mRNA in pancreatic islets and direct inhibitory action of leptin on insulin secretion. Diabetes. 1997;46:313–316. - PubMed
    1. Kulkarni R.N., Wang Z.L., Wang R.M., Hurley J.D., Smith D.M., Ghatei M.A., Withers D.J., Gardiner J.V., Bailey C.J., Bloom S.R. Leptin rapidly suppresses insulin release from insulinoma cells, rat and human islets and, in vivo, in mice. J. Clin. Invest. 1997;100:2729–2736. - PMC - PubMed
    1. Ookuma K., Ookuma M., York D.A. Effects of leptin on insulin secretion from isolated rat pancreatic islets. Diabetes. 1998;47:219–223. - PubMed

Publication types

MeSH terms

LinkOut - more resources