. 2021 Jan-Jun:296:100387.
doi: 10.1074/jbc.RA119.012358. Epub 2021 Feb 20.

The intracellular domain of homomeric glycine receptors modulates agonist efficacy

Affiliations

The intracellular domain of homomeric glycine receptors modulates agonist efficacy

Josip Ivica et al. J Biol Chem. 2021 Jan-Jun.

Abstract

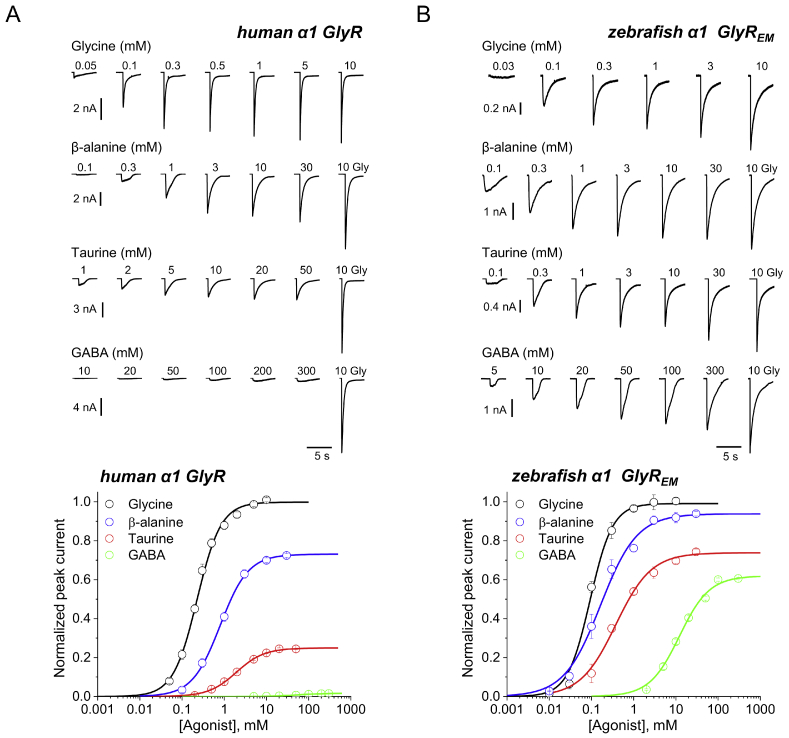
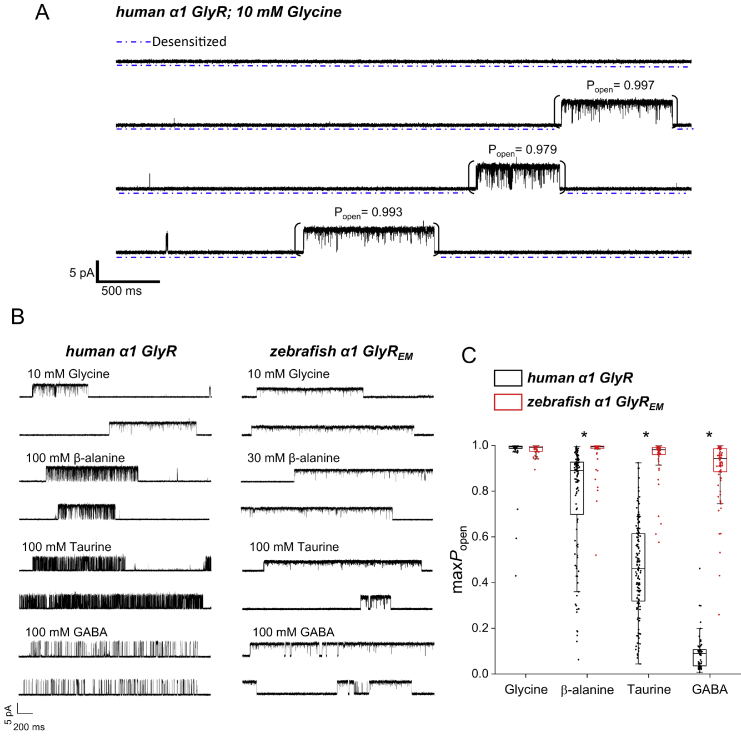
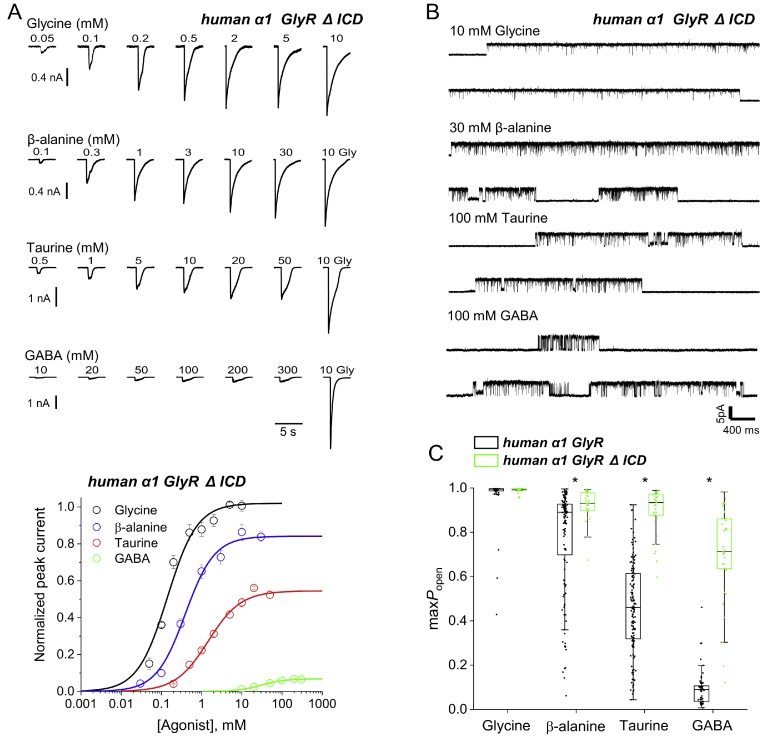
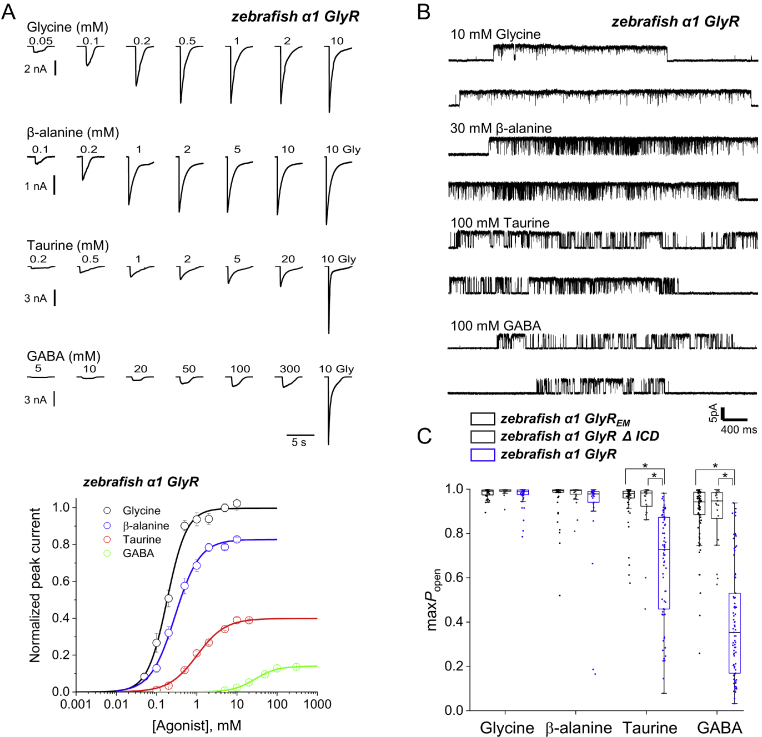
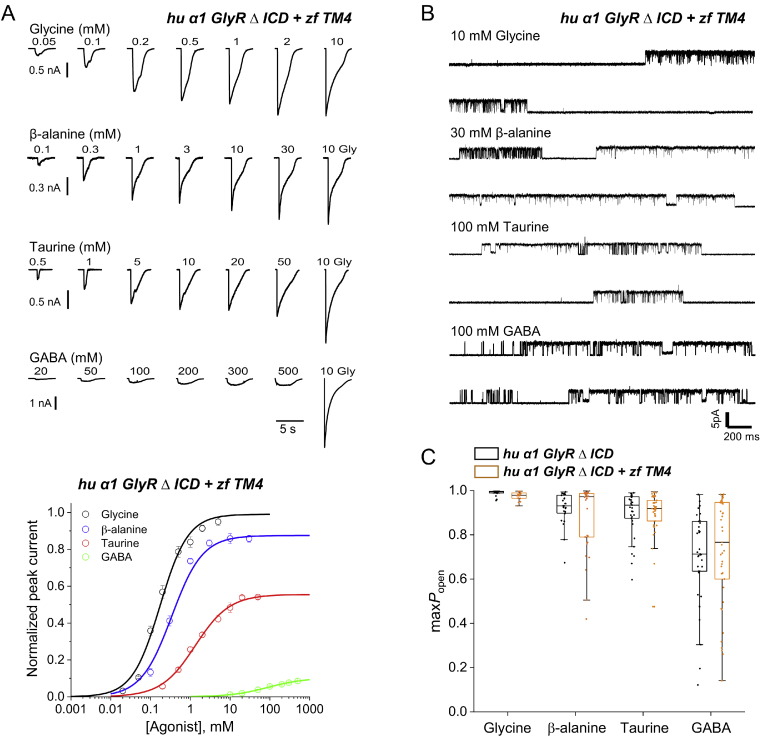
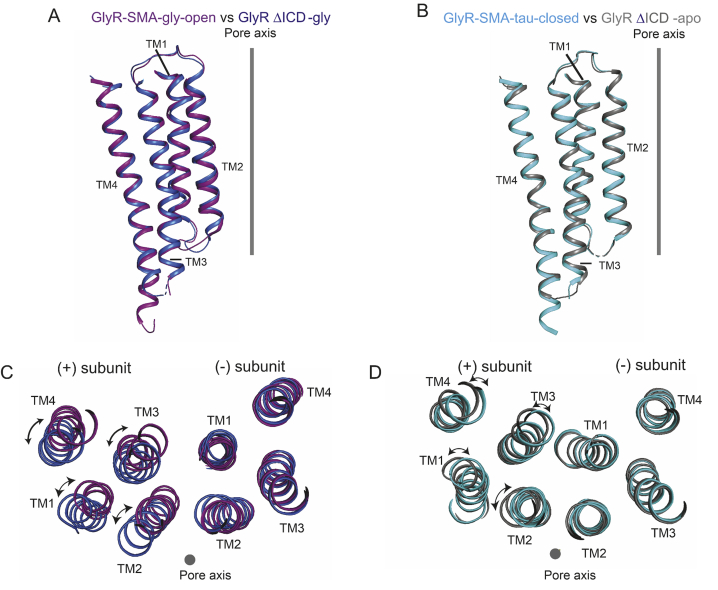
Like other pentameric ligand-gated channels, glycine receptors (GlyRs) contain long intracellular domains (ICDs) between transmembrane helices 3 and 4. Structurally characterized GlyRs are generally engineered to have a very short ICD. We show here that for one such construct, zebrafish GlyREM, the agonists glycine, β-alanine, taurine, and GABA have high efficacy and produce maximum single-channel open probabilities greater than 0.9. In contrast, for full-length human α1 GlyR, taurine and GABA were clearly partial agonists, with maximum open probabilities of 0.46 and 0.09, respectively. We found that the elevated open probabilities in GlyREM are not due to the limited sequence differences between the human and zebrafish orthologs, but rather to replacement of the native ICD with a short tripeptide ICD. Consistent with this interpretation, shortening the ICD in the human GlyR increased the maximum open probability produced by taurine and GABA to 0.90 and 0.70, respectively, but further engineering it to resemble GlyREM (by introducing the zebrafish transmembrane helix 4 and C terminus) had no effect. Furthermore, reinstating the native ICD to GlyREM converted taurine and GABA to partial agonists, with maximum open probabilities of 0.66 and 0.40, respectively. Structural comparison of transmembrane helices 3 and 4 in short- and long-ICD GlyR subunits revealed that ICD shortening does not distort the orientation of these helices within each subunit. This suggests that the effects of shortening the ICD stem from removing a modulatory effect of the native ICD on GlyR gating, revealing a new role for the ICD in pentameric ligand-gated channels.


Conflict of interest statement

Conflict of interest The authors declare that they have no conflicts of interest with the contents of this article.

Figures

Figure 1
Figure 1
GlyR agonist efficacy is lower in humanα1 GlyR than in zebrafishα1 GlyREM, a channel from which the ICD has been excised.A and B, upper panels, whole cell current responses to the application of glycine, β-alanine, taurine, and GABA by U-tube to HEK 293 cells expressing human α1 GlyR (A) or zebrafish α1 GlyREM (B). A and B, lower panels, averaged concentration-response curves of glycine (black), β-alanine (blue), taurine (red), and GABA (green) in human α1 GlyR (A) and zebrafish α1 GlyREM (B). Each dose-response curve is constructed by pooling individual concentration-response curves obtained in different cells (n = 4 –14, see Table 1). Error bars represent S.E. Responses were normalized to the response to 10 mm glycine in each cell.
Figure 2
Figure 2
Single-channel recordings show that agonists are more efficacious on zebrafishα1 GlyREMcompared with human GlyRα1.A, example of a cell-attached single-channel recording from human α1 GlyR activated by 10 mm glycine in the recording electrode. Three clusters of single-channel activity are separated by long desensitized intervals (dashed lines under the trace). Popen values shown above each cluster were obtained as ratios between cluster open time and cluster duration. Long desensitized intervals were not included in the analysis. B, single-channel activity evoked by saturating concentrations of glycine, β-alanine, taurine, and GABA for human α1 GlyR (left panel) and zebrafish α1 GlyREM (right panel). C, boxplot showing maximum Popen of glycine, β-alanine, taurine, and GABA for human α1 GlyR (black, left hand side in each pair) and zebrafish α1 GlyREM (red, right hand side). Each point is a Popen value obtained from a cluster of single-channel activity in the presence of 10 mm glycine, 100 mmβ-alanine, 100 mm taurine, or 100 mm GABA. Boxes show the 25th and 75th percentiles, and whiskers the furthest points that fall within 1.5 times of the interquartile range from the 25th to 75th percentiles. The horizontal line in each box shows the median. Asterisks denote significant differences in randomization tests, two-tail, unpaired; 10,000 iterations p < 0.005.
Figure 3
Figure 3
Removing the ICD loop from the human α1 GlyR increases agonist efficacy.A, upper panel, whole cell current responses to U-tube application of glycine, β-alanine, taurine and GABA to HEK 293 cells expressing human α1 GlyR Δ ICD. A, lower panel. Averaged concentration-response curves to glycine (black), β-alanine (blue), taurine (red) and GABA (green) on human α1 GlyR Δ ICD. Each curve is constructed from pooling individual concentration-response curves obtained in different cells (n = 4-6, see Table 1). Error bars represent S.E. Responses are normalised to the response to 10 mm glycine in each cell. B, cell-attached recordings of clusters of single-channel activity evoked in human α1 Δ ICD by saturating agonist concentrations (10 mm glycine, 30 mmβ-alanine, 100 mm taurine, 100 mm GABA). C, boxplot of maximum Popen values produced by at saturating agonist concentrations for human α1 GlyR (black, left hand side in each pair) and human α1 GlyR ΔICD (green, right hand side in each pair). Each point is the Popen value from a cluster of single-channel activity. Boxes and whiskers show the 25th and 75th percentiles and the furthest points that fall within 1.5 times of the interquartile range from the 25th to 75th percentiles, respectively. The horizontal line in the box is the median. Asterisks denote significant differences in randomization tests (two tail, unpaired; 10000 iterations; p < 0.005).
Figure 4
Figure 4
Reinstating the WT ICD in zebrafish GlyREM decreases agonist efficacy.A, upper panel, whole cell current responses to glycine, β-alanine, taurine, and GABA of zebrafish WT α1 GlyR. A, lower panel, averaged concentration-response curves to glycine (black), β-alanine (blue), taurine (red), and GABA (green) on zebrafish α1 GlyR. Each curve is constructed from pooling individual concentration-response curves obtained in different cells (n = 6–10). Error bars represent S.E. Responses are normalized to the response to 10 mm glycine in each cell. B, cell-attached recordings of clusters of zebrafish α1 single-channel activity evoked by saturating agonist concentrations (10 mm glycine, 30 mmβ-alanine, 100 mm taurine, 100 mm GABA). C, boxplot of the maximum Popen values produced by saturating concentrations of different agonists for zebrafish α1 GlyREM (black, left hand side), zebrafish α1 GlyR ΔICD (dark gray in the middle), and zebrafish α1 GlyR (blue, right hand side). Each point is a Popen value from a cluster of single-channel activity. Boxes and whiskers show the 25th and 75th percentiles and the furthest points that fall within 1.5 times of the interquartile range from the 25th to 75th percentiles, respectively. The horizontal line in the box is the median. Asterisks and brackets denote differences that reached statistical significance (randomization test, two tail, unpaired; 10,000 iterations; p < 0.005).
Figure 5
Figure 5
Replacing the TM4 domain of human GlyRα1 ΔICD with that of zebrafish GlyR does not increase agonist efficacy.A, upper panel, whole-cell current responses to U-tube application of glycine, β-alanine, taurine, and GABA to HEK 293 cells expressing human α1 GlyR ΔICD + zf TM4. A, lower panel, averaged concentration-response curves to glycine (black), β-alanine (blue), taurine (red), and GABA (green) on human α1 GlyR ΔICD+zf TM4. Each curve is constructed from pooling 5 to 8 curves obtained in different cells. Error bars represent S.E. Responses are normalized to the response to 10 mm glycine in each cell. B, cell-attached recordings of clusters of openings of human α1 GlyR ΔICD + zf TM4 evoked by saturating agonist concentrations (10 mm glycine, 30 mmβ-alanine, 100 mm taurine, 100 mm GABA). C, boxplot showing maximum Popen values obtained at saturating concentrations of four different agonists (as in panel B) for human α1 GlyR ΔICD (black, left hand side in each pair) and human α1 GlyR ΔICD + zf TM4 (orange, right hand side in each pair). Each point is the Popen value from a cluster of single-channel activity. Boxes and whiskers show the 25th and 75th percentiles and the furthest points that fall within 1.5 times of the interquartile range from the 25th to 75th percentiles, respectively. The horizontal line in the box is the median. None of the differences in open probability between constructs reached significance.
Figure 6
Figure 6
Conformational changes in the transmembrane domains of the zebrafish full-length GlyR andGlyR ΔICD. The full-length GlyR and the GlyR ΔICD are in the open (A and C) and closed (B and D) states, respectively. A and B, superposition of transmembrane domains from a single subunit from the full-length GlyR and the GlyR ΔICD from lateral view. C and D, superimposition of the (–)subunits illustrates the relative movements in the transmembrane domain of the (+)subunit. The view is from the intracellular side. GlyR full-length structures from Yu et al. (57), glycine bound open, PDB ID code 6PM6; taurine bound closed, PDB ID code 6PM3. GlyR ΔICD structures from Du et al. (2), glycine bound open, PDB ID code 3JAE; closed, PDB ID code 3JAD.

Similar articles

Cited by

References

    1. Lynch J.W. Molecular structure and function of the glycine receptor chloride channel. Physiol. Rev. 2004;84:1051–1095. - PubMed
    1. Du J., Lü W., Wu S., Cheng Y., Gouaux E. Glycine receptor mechanism elucidated by electron cryo-microscopy. Nature. 2015;526:224–229. - PMC - PubMed
    1. Huang X., Chen H., Michelsen K., Schneider S., Shaffer P.L. Crystal structure of human glycine receptor α3 bound to antagonist strychnine. Nature. 2015;526:277–280. - PubMed
    1. Huang X., Shaffer P.L., Ayube S., Bregman H., Chen H., Lehto S.G., Luther J.A., Matson D.J., McDonough S.I., Michelsen K., Plant M.H., Schneider S., Simard J.R., Teffera Y., Yi S., Zhang M., DiMauro E.F., Gingras J. Crystal structures of human glycine receptor α3 bound to a novel class of analgesic potentiators. Nat. Struct. Mol. Biol. 2017;24:108–113. - PubMed
    1. Bocquet N., Nury H., Baaden M., Le Poupon C., Changeux J.P., Delarue M., Corringer P.J. X-ray structure of a pentameric ligand-gated ion channel in an apparently open conformation. Nature. 2009;457:111–114. - PubMed

Publication types

LinkOut - more resources