. 2021;12(1):199-228.
doi: 10.1016/j.jcmgh.2021.02.004. Epub 2021 Feb 20.

Patient-Derived Mutant Forms of NFE2L2/NRF2 Drive Aggressive Murine Hepatoblastomas

Affiliations

Patient-Derived Mutant Forms of NFE2L2/NRF2 Drive Aggressive Murine Hepatoblastomas

Huabo Wang et al. Cell Mol Gastroenterol Hepatol. 2021.

Abstract

Background & aims: Hepatoblastoma (HB), the most common pediatric liver cancer, often bears β-catenin mutations and deregulates the Hippo tumor suppressor pathway. Murine HBs can be generated by co-expressing β-catenin mutants and the constitutively active Hippo effector YAPS127A. Some HBs and other cancers also express mutants of NFE2L2/NRF2 (NFE2L2), a transcription factor that tempers oxidative and electrophilic stress. In doing so, NFE2L2 either suppresses or facilitates tumorigenesis.

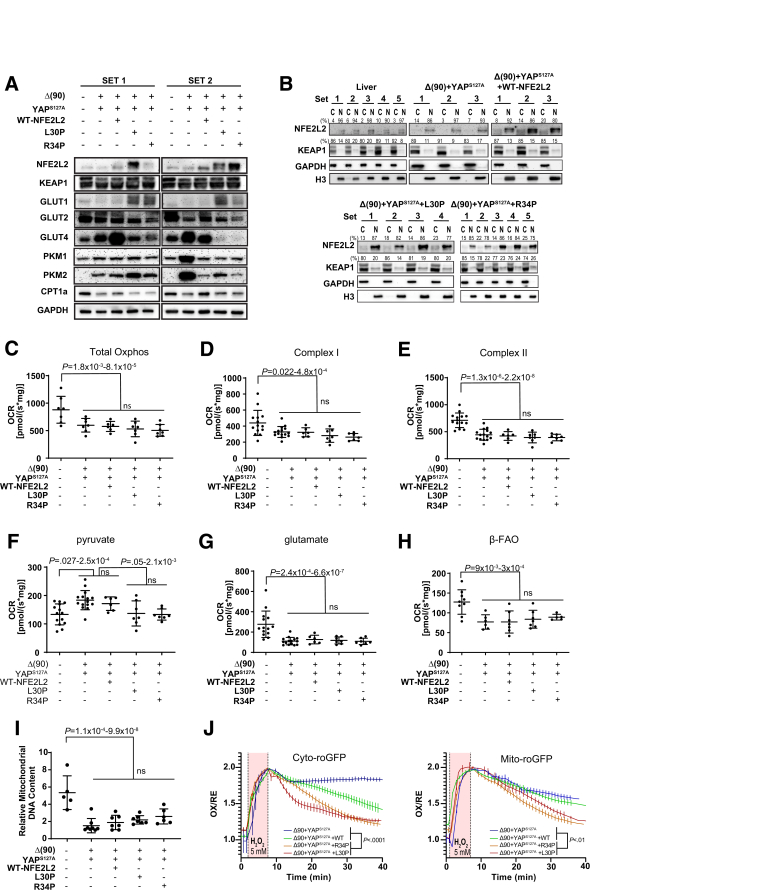
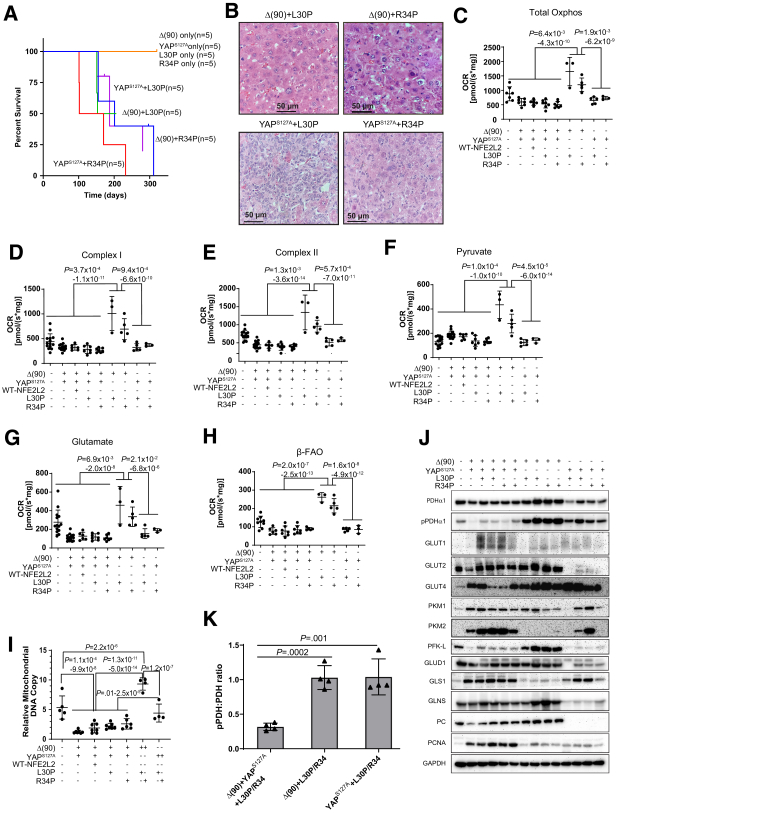
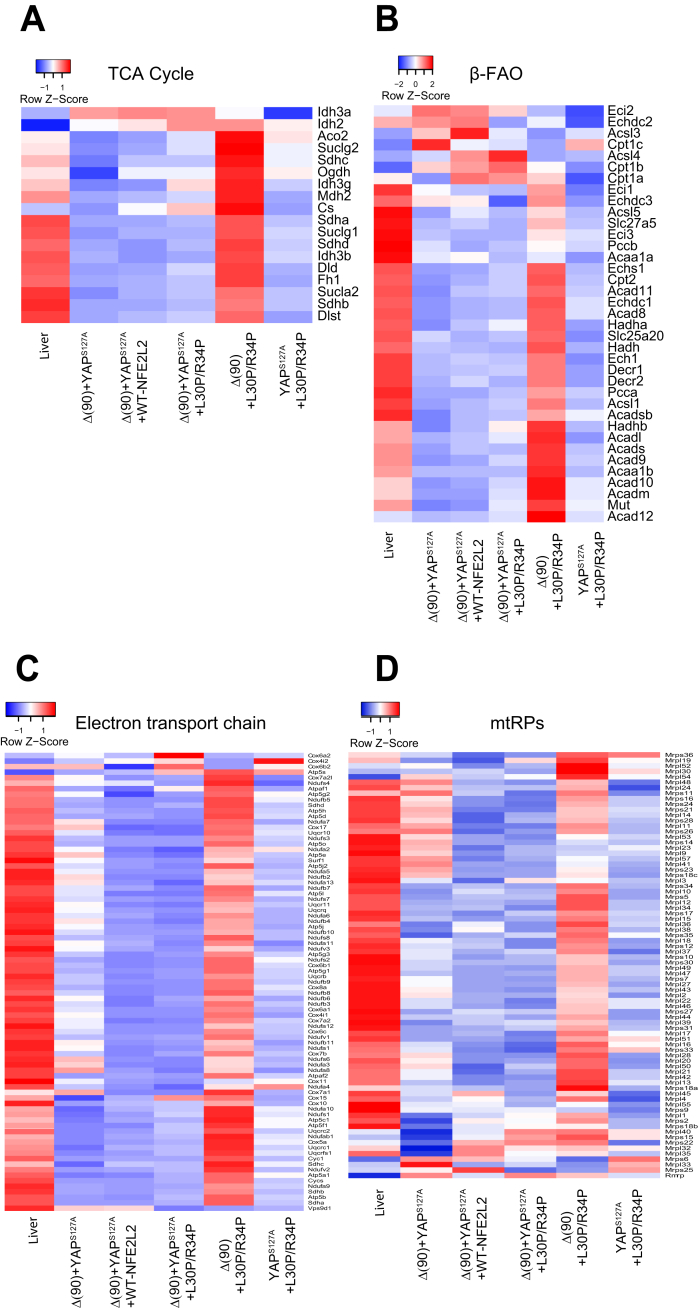
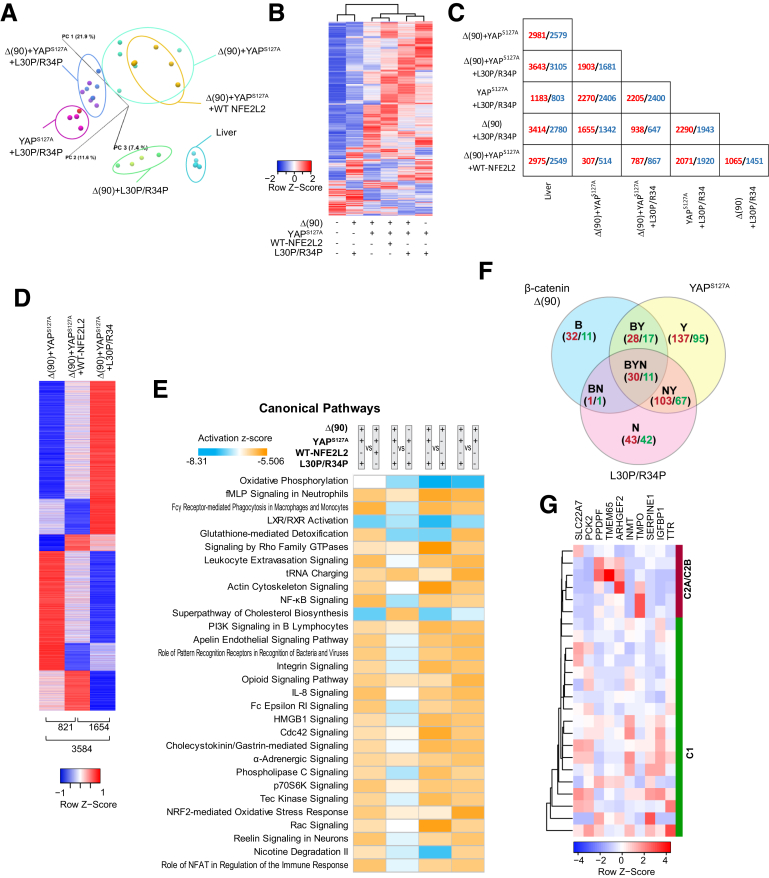
Methods: We evaluated NFE2L2's role in HB pathogenesis by co-expressing all combinations of mutant β-catenin, YAPS127A, and the patient-derived NFE2L2 mutants L30P and R34P in murine livers. We evaluated growth, biochemical and metabolic profiles, and transcriptomes of the ensuing tumors.

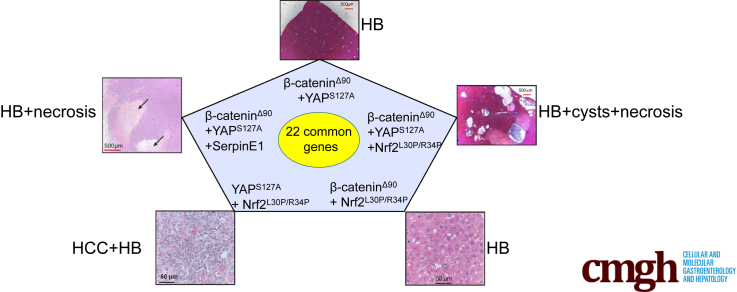
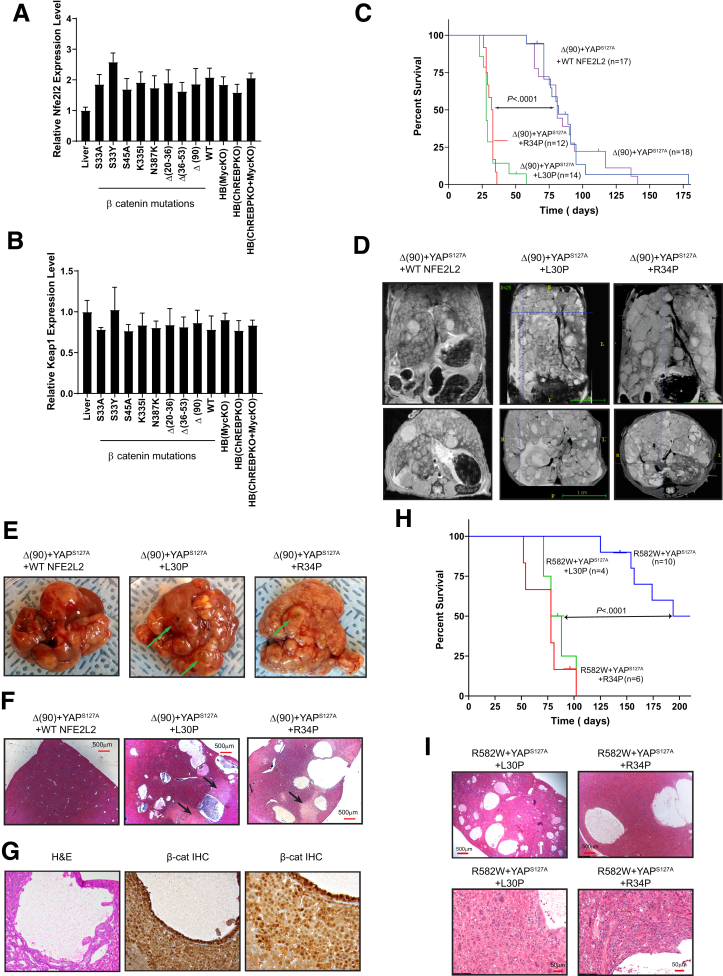
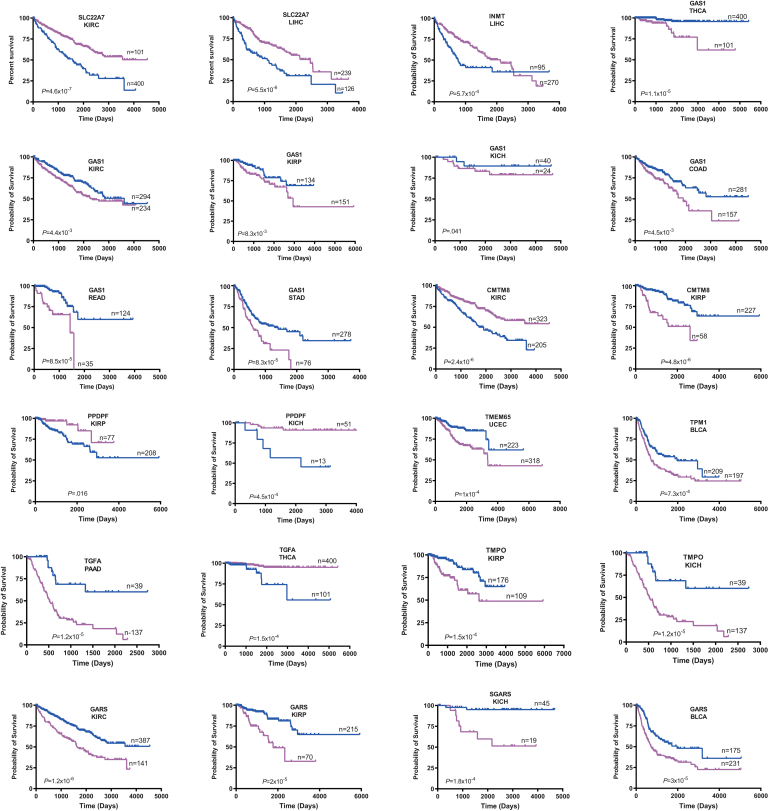
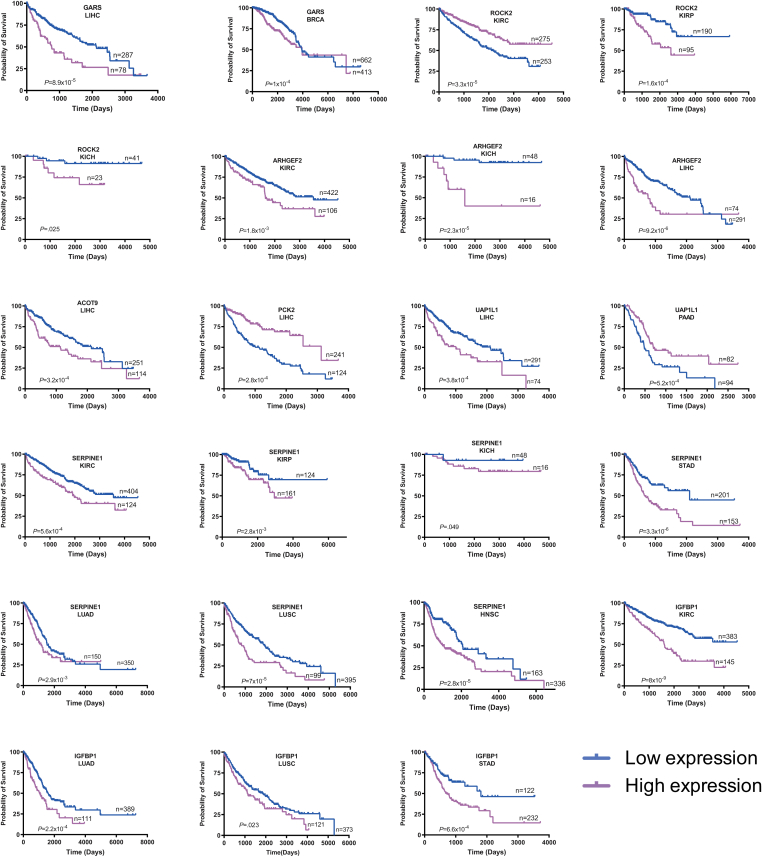
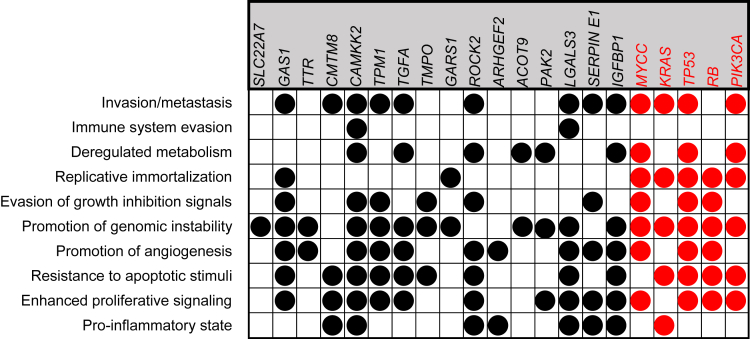
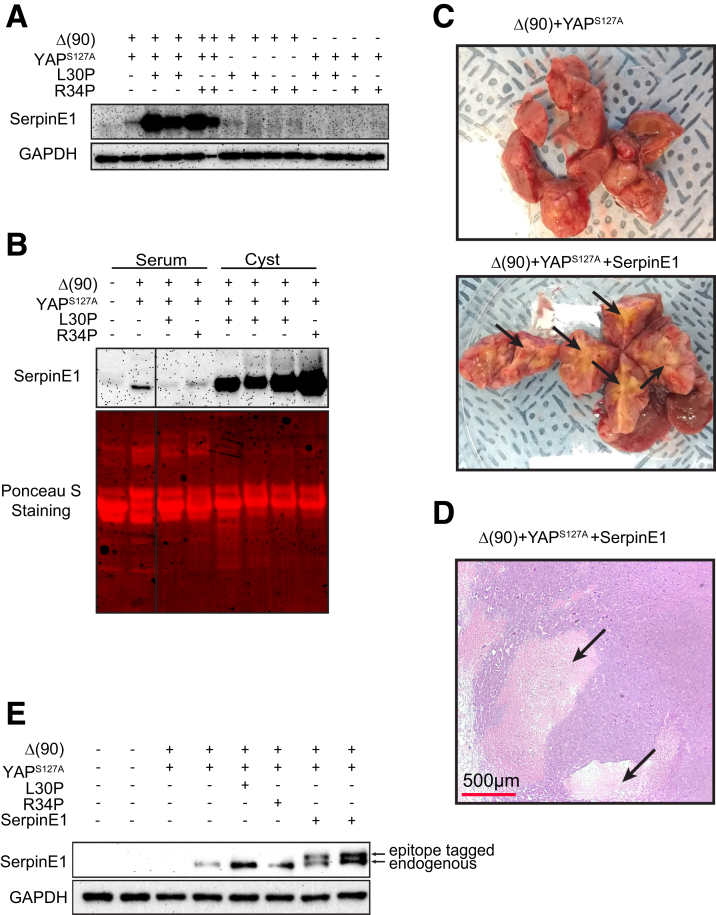
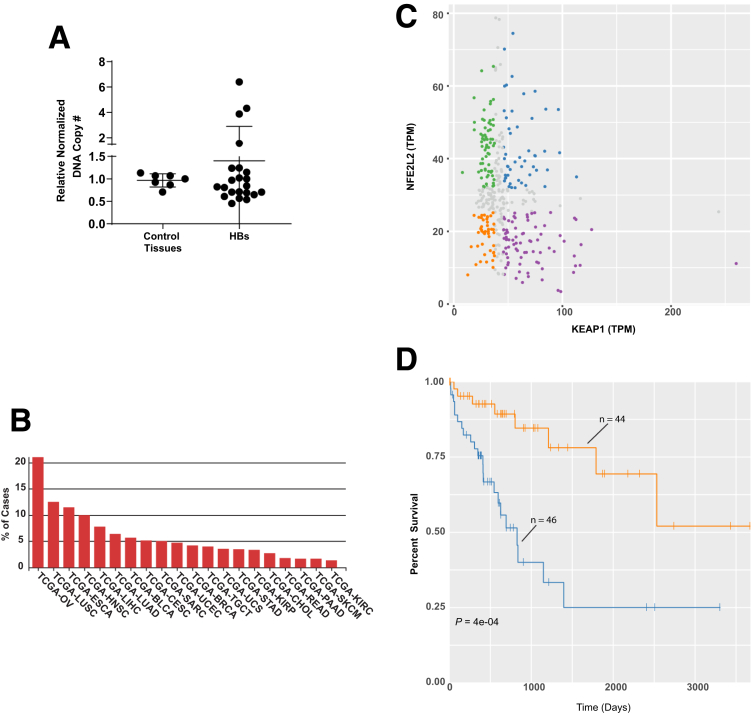
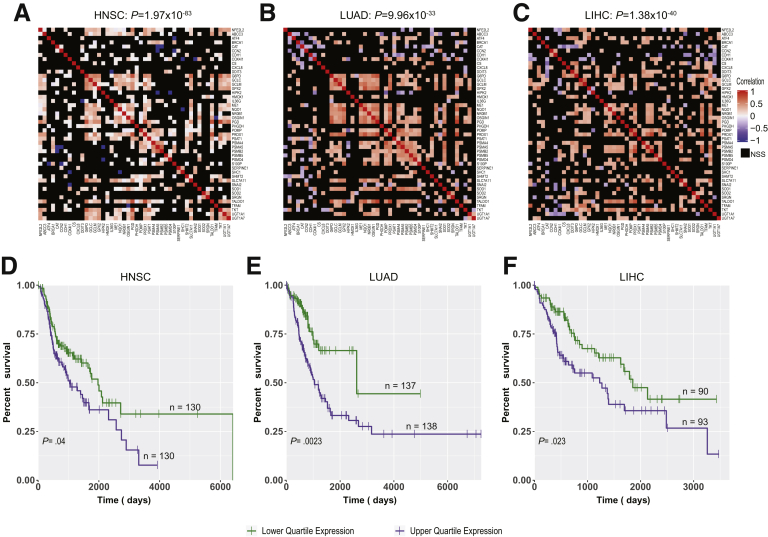
Results: In association with β-catenin+YAPS127A, L30P and R34P markedly accelerated HB growth and generated widespread cyst formation and necrosis, which are otherwise uncommon features. Surprisingly, any 2 members of the mutant β-catenin-YAPS127A-L30P/R34P triad were tumorigenic, thus directly establishing NFE2L2's oncogenicity. Each tumor group displayed distinct features but shared 22 similarly deregulated transcripts, 10 of which perfectly correlated with survival in human HBs and 17 of which correlated with survival in multiple adult cancers. One highly up-regulated transcript encoded serpin E1, a serine protease inhibitor that regulates fibrinolysis, growth, and extracellular matrix. Although the combination of mutant β-catenin, YAPS127A, and serpin E1 did not accelerate cystogenic tumor growth, it did promote the widespread necrosis associated with mutant β-catenin-YAPS127A-L30P/R34P tumors.

Conclusions: Our findings establish the direct oncogenicity of NFE2L2 mutants and key transcripts, including serpin E1, that drive specific HB features.

Keywords: Hepatocellular Carcinoma; KEAP1; Plasminogen Activator Inhibitor; Warburg Effect.


Figures

None
Graphical abstract
Figure 1
Figure 1
NFE2L2 mutants L30P and R34P accelerate HB growth. (A) NFE2L2 transcript levels were quantified from previously reported RNA-seq data obtained from murine HBs generated by the enforced hepatic overexpression of YAPS127A and 8 missense or in-frame deletion mutants of β-catenin or WT β-catenin. Transcripts were also quantified in Δ(90) β-catenin-generated HBs arising in myc-/-, chrebp-/-, and myc-/- x chrebp-/- hepatocyte backgrounds., All transcript levels are expressed relative to those in normal liver (n = 5 samples/group). (B) KEAP1 transcript levels in the tissues shown in (A). (C) Kaplan-Meier survival curves of the indicated cohorts, n = 10–12 mice/group. (D) Magnetic resonance images of comparably sized tumors just before death. (E) Gross appearance of typical tumors from each of the groups, with examples of typical fluid-filled cysts indicated by arrows. (F) H&E-stained sections of the tumors shown in (C) showing multiple cysts, with areas of prominent adjacent necrosis indicated by arrows. (G) Higher power magnification of H&E- and β-catenin immunohistochemistry-stained sections showing the lumens of cysts lined with cells resembling tumor cells that stain strongly for nuclearly localized β-catenin. (H) Kaplan-Meier survival curves of mice expressing β-catenin missense mutant R582W, YAPS127A, and the indicated NFE2L2 proteins. (I) H&E stained sections of the indicated tumors from (H).
Figure 2
Figure 2
Distribution and metabolic consequences of L30P/R34P expression in HBs. (A) Expression of NFE2L2, KEAP1, GLUT1, GLUT2, GLUT4, PKM-1, PKM-2, and Cpt1a in 2 representative sets of total lysates from the indicated tissues. (B) Nuclear (N)/cytoplasmic (C) fractionation of the indicated tissues, n = 3–5 samples/group. GAPDH and histone H3 (H3) immunoblots were performed as controls for protein loading and the purity of each fraction. Numbers above the NFE2L2 and KEAP1 panels indicate the fraction of protein associated with each compartment as determined by densitometric scanning of bands. (C) Total OCRs of mitochondria from the indicated tissues in the presence of malate, ADP, pyruvate, glutamate, and succinate. (D) Complex I responses, calculated after addition of rotenone to the reactions in (C) without succinate. (E) Complex II responses as determined from residual activity after addition of rotenone. (F) Responses to pyruvate. (G) Responses to glutamate. (H) β-FAO responses after addition of malate, L-carnitine, and palmitoyl-CoA. (I) Quantification of mitochondrial DNA (mtDNA) in representative tissues. TaqMan reactions amplified a segment of the mt D-loop region.,Each point represents the mean of triplicate TaqMan reactions after normalizing to a control TaqMan reaction for the ApoE nuclear gene. (J) In vitro recovery from oxidative stress. Monolayer cultures of the indicated tumor cells expressing cyto-roGFP or mito-roGFP were exposed to 5 mmol/L hydrogen peroxide (bar) while being monitored by live cell confocal microscope.
Figure 3
Figure 3
Characteristics of tumors generated by L30P and R34P co-expressed with Δ(90) or YAPS127A. (A) Kaplan-Meier survival curves. Survival was determined as described in Figure 1C. (B) Histopathologic features of representative tumors from the indicated cohorts. (C–H) OCRs performed as described in Figure 2C–H. (C) Total Oxphos; (D) Complex I; (E) Complex II; (F) pyruvate response; (G) glutamate response; (H) β-FAO. (I) Mitochondrial DNA content of representative tumors from the indicated cohorts performed as described in Figure 2I. (J) Immunoblots from representative tissues of the indicated cohorts. GAPDH was used as a loading control. (K) Quantification of PDH and pPDH immunoblot results from (J).
Figure 4
Figure 4
Differential expression of transcripts involved in mitochondrial function. Control livers or tumors from each of the indicated cohorts (n = 5/group) were subjected to RNAseq and analyzed for expression of transcripts encoding proteins in the following pathways or structures. (A) TCA cycle, (B) β-FAO, (C) electron transport chain, (D) mitochondria ribosomal proteins (mtRPs).
Figure 5
Figure 5
RNAseq analysis of tumors generated by combinations of Δ(90), YAPS127A, WT-NFE2L2, L30P, and R34P. (A) Principal components analysis of transcriptomic profiles of livers and tumors (n = 4–5 samples/group. (B) Heat maps of differentially expressed transcripts from the tissues depicted in (A) arranged by hierarchical clustering. Because only a single transcript difference was found between tumors expressing L30P and R34P, results were combined for this and subsequent analyses (L30P/R34P). (C) Pairwise comparisons showing the number of significant gene expression differences between any 2 of the tissues depicted in (B). Red and blue, up-regulated and down-regulated, respectively, in the tumors depicted at the left relative to those indicated at the bottom. (D) Distinct transcript patterns of Δ(90)+YAPS127A, Δ(90)+YAPS127A+WT-NFE2L2, and Δ(90)+YAPS127A+L30P/R34P tumor cohorts. Numbers at bottom of each column indicate the significant expression differences between each pairwise comparison. (E) Top IPA pathways among different tumor groups, expressed as z-scores. Orange, up-regulated; blue, down-regulated. (F) Shared gene expression subsets between and among the indicated cohorts. Red and green, number of transcripts up-regulated and down-regulated, respectively, relative to liver. (G) Hierarchical clustering of C1 and C2A/C2B subsets, of human HBs using the 10 “BYN” transcripts from Table 2 that were dysregulated in human tumors.
Figure 6
Figure 6
Correlation between expression levels of transcripts listed inTable 2and survival in select human cancers. Each depicted tumor type was divided into 2 groups displaying the highest and lowest expression of the indicated transcript. Standard Kaplan-Meir survival curves for each group were then generated, and P values were determined by a standard rank test.
Figure 6
Figure 6
Correlation between expression levels of transcripts listed inTable 2and survival in select human cancers. Each depicted tumor type was divided into 2 groups displaying the highest and lowest expression of the indicated transcript. Standard Kaplan-Meir survival curves for each group were then generated, and P values were determined by a standard rank test.
Figure 7
Figure 7
Association of relevant “BYN” transcripts with The Hallmarks of Cancer. Each gene was queried in The Cancer Hallmarks Analytics Tool website (http://chat.lionproject.net/) to identify the hallmarks that have been previously associated with the gene’s mutation or dysregulation. Those shown in red were included as examples of genes that have been broadly implicated in the causation of multiple different mammalian cancers.
Figure 8
Figure 8
In silico promoter analysis. Five kb of upstream promoter sequence for each of the genes listed in Table 2 were screened for the presence of consensus elements for Tcf/Lef, TEAD, and ARE binding sites. (A) Murine genes; (B) human genes. (C) True binding sites based on ChIP results for Tcf/Lef, TEAD, and ARE obtained from human HepG2 HB cells in the Encode v.5 database (https://www.encodeproject.org/datastandards/chip-seq/) were mapped to the promoter sequences from (B). (D) Binding sites for Tcf/Lef, TEAD, and ARE after the evaluation of Chip-Seq data from 8 other human cell lines (see Materials and Methods).
Figure 9
Figure 9
Serpin E1 deregulation recapitulates the extensive necrosis associated with L30P/R34P overexpression. (A) Serpin E1 levels in the indicated tumors. (B) Serpin E1 levels in plasma and cyst fluid from the indicated cohorts. Plasma and cyst fluids were diluted proportionately, and 40 μg of each was subjected to sodium dodecyl sulfate-polyacrylamide gel electrophoresis. To account for differences in the types of samples present, Ponceau acid red staining of the membrane was used to confirm protein concentrations. (C) Gross appearance of Δ(90)+YAPS127A+serpin E1 tumor sections showing extensive necrosis (arrows) relative to that of a typical Δ(90)+YAPS127A control. (D) Histologic appearance of typical section from the tumor shown in (C) with large pericystic necrotic areas indicated by arrows. (E) Immunoblots for serpin E1 expression in indicated tumor types. Note slower mobility of exogenously expressed, epitope-tagged serpin E1.
Figure 10
Figure 10
CNVs in HB and select human tumors. (A) NFE2L2 CNVs determined from FFPE samples of 7 normal tissues and 22 primary HBs. TaqMan-based assay was used to quantify the copy number ratios of NFE2L2 versus 2 control genes (GAPDH and RPPH1). Each reaction was performed in triplicate, and each point represents the calculated mean of the empirically determined CNVs relative to those of the 2 control genes. (B) Primary human tumors with the highest frequency of NFE2L2 gene amplification. Data were obtained from the Genomic Data Commons site in TCGA. (C) Scatterplots of NFE2L2 and KEAP1 transcript expression in 371 HCC samples from the TCGA PANCAN data set. Sets are divided into quadrants that indicate those samples with the highest and lowest expression of NFE2L2 and KEAP1. (D) Kaplan-Meier survival of individuals from (C) whose tumors contained the highest and lowest levels of NFE2L2 and KEAP1 expression.
Figure 11
Figure 11
Correlation between NFE2L2 and its target genes in 3 human cancer types. (A–C) Correlation matrices of NFE2L2 and 45 NFE2L2 target gene transcripts (Table 4) from 3 of the tumor groups depicted in Figure 10B. (A) Head and neck squamous cell cancer (HNSC), (B) lung adenocarcinoma (LUAD), (C) HCC (LIHC). The preponderance of positive correlations is apparent and was assessed using a binomial test. P values are shown at top of each panel. (D–F) Long-term survival of patients whose tumors are profiled in (A–C). Expression levels of the 45 NFE2L2 target genes (Table 4) were averaged across all samples for each cancer type. Survival differences between the 2 quartiles of individuals whose tumors expressed the highest and lowest levels of these transcripts were determined by using Kaplan-Meier survival and were assessed using log-rank tests.

Comment in

  • Help for Sick Kids: New Insights Into Hepatoblastoma.
    Timchenko NA. Timchenko NA. Cell Mol Gastroenterol Hepatol. 2021;12(1):350-351. doi: 10.1016/j.jcmgh.2021.03.001. Epub 2021 Mar 26. Cell Mol Gastroenterol Hepatol. 2021. PMID: 33775655 Free PMC article. No abstract available.

References

    1. Czauderna P., Lopez-Terrada D., Hiyama E., Haberle B., Malogolowkin M.H., Meyers R.L. Hepatoblastoma state of the art: pathology, genetics, risk stratification, and chemotherapy. Curr Opin Pediatr. 2014;26:19–28. - PubMed
    1. Bell D., Ranganathan S., Tao J., Monga S.P. Novel advances in understanding of molecular pathogenesis of hepatoblastoma: a Wnt/beta-catenin perspective. Gene Expr. 2017;17:141–154. - PMC - PubMed
    1. Zhang W., Meyfeldt J., Wang H., Kulkarni S., Lu J., Mandel J.A., Marburger B., Liu Y., Gorka J.E., Ranganathan S., Prochownik E.V. beta-Catenin mutations as determinants of hepatoblastoma phenotypes in mice. J Biol Chem. 2019;294:17524–17542. - PMC - PubMed
    1. Tao J., Calvisi D.F., Ranganathan S., Cigliano A., Zhou L., Singh S., Jiang L., Fan B., Terracciano L., Armeanu-Ebinger S., Ribback S., Dombrowski F., Evert M., Chen X., Monga S.P.S. Activation of beta-catenin and Yap1 in human hepatoblastoma and induction of hepatocarcinogenesis in mice. Gastroenterology. 2014;147:690–701. - PMC - PubMed
    1. Grobner S.N., Worst B.C., Weischenfeldt J., Buchhalter I., Kleinheinz K., Rudneva V.A., Johann P.D., Balasubramanian G.P., Segura-Wang M., Brabetz S., Bender S., Hutter B., Sturm D., Pfaff E., Hubschmann D., Zipprich G., Heinold M., Eils J., Lawerenz C., Erkek S., Lambo S., Waszak S., Blattmann C., Borkhardt A., Kuhlen M., Eggert A., Fulda S., Gessler M., Wegert J., Kappler R., Baumhoer D., Burdach S., Kirschner-Schwabe R., Kontny U., Kulozik A.E., Lohmann D., Hettmer S., Eckert C., Bielack S., Nathrath M., Niemeyer C., Richter G.H., Schulte J., Siebert R., Westermann F., Molenaar J.J., Vassal G., Witt H., IP-S Project, IM-S Project, Burkhardt B., Kratz C.P., Witt O., van Tilburg C.M., Kramm C.M., Fleischhack G., Dirksen U., Rutkowski S., Fruhwald M., von Hoff K., Wolf S., Klingebiel T., Koscielniak E., Landgraf P, Koster J., Resnick A.C., Zhang J., Liu Y., Zhou X., Waanders A.J., Zwijnenburg D.A., Raman P., Brors B., Weber U.D., Northcott P.A., Pajtler K.W., Kool M., Piro R.M., Korbel J.O., Schlesner M., Eils R., Jones D.T.W., Lichter P., Chavez L., Zapatka M., Pfister S.M. The landscape of genomic alterations across childhood cancers. Nature. 2018;555:321–327. - PubMed

Publication types