

A scoping review of studies using observational data to optimise dynamic treatment regimens
- PMID: 33618655
- PMCID: PMC7898728
- DOI: 10.1186/s12874-021-01211-2
A scoping review of studies using observational data to optimise dynamic treatment regimens
Abstract
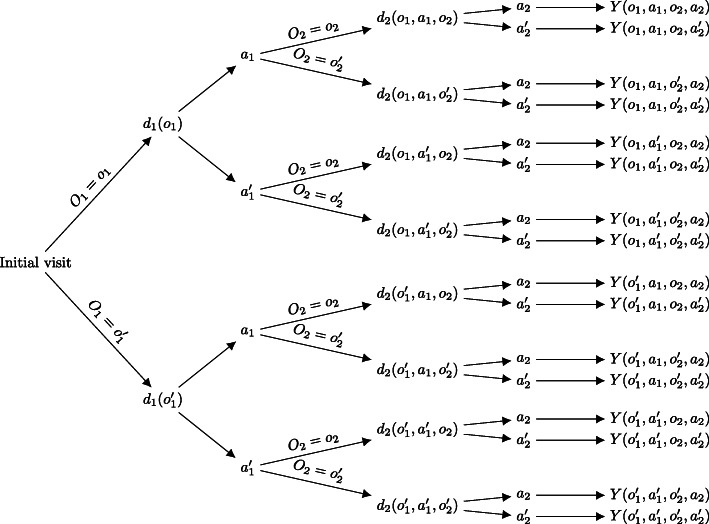
Background: Dynamic treatment regimens (DTRs) formalise the multi-stage and dynamic decision problems that clinicians often face when treating chronic or progressive medical conditions. Compared to randomised controlled trials, using observational data to optimise DTRs may allow a wider range of treatments to be evaluated at a lower cost. This review aimed to provide an overview of how DTRs are optimised with observational data in practice.
Methods: Using the PubMed database, a scoping review of studies in which DTRs were optimised using observational data was performed in October 2020. Data extracted from eligible articles included target medical condition, source and type of data, statistical methods, and translational relevance of the included studies.
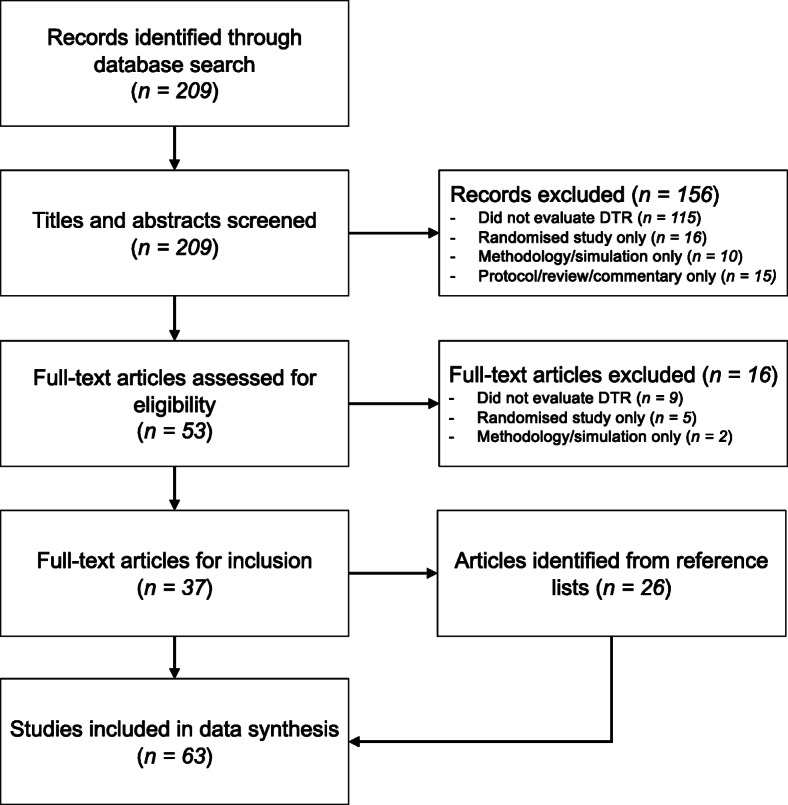
Results: From 209 PubMed abstracts, 37 full-text articles were identified, and a further 26 were screened from the reference lists, totalling 63 articles for inclusion in a narrative data synthesis. Observational DTR models are a recent development and their application has been concentrated in a few medical areas, primarily HIV/AIDS (27, 43%), followed by cancer (8, 13%), and diabetes (6, 10%). There was substantial variation in the scope, intent, complexity, and quality between the included studies. Statistical methods that were used included inverse-probability weighting (26, 41%), the parametric G-formula (16, 25%), Q-learning (10, 16%), G-estimation (4, 6%), targeted maximum likelihood/minimum loss-based estimation (4, 6%), regret regression (3, 5%), and other less common approaches (10, 16%). Notably, studies that were primarily intended to address real-world clinical questions (18, 29%) tended to use inverse-probability weighting and the parametric G-formula, relatively well-established methods, along with a large amount of data. Studies focused on methodological developments (45, 71%) tended to be more complicated and included a demonstrative real-world application only.
Conclusions: As chronic and progressive conditions become more common, the need will grow for personalised treatments and methods to estimate the effects of DTRs. Observational DTR studies will be necessary, but so far their use to inform clinical practice has been limited. Focusing on simple DTRs, collecting large and rich clinical datasets, and fostering tight partnerships between content experts and data analysts may result in more clinically relevant observational DTR studies.
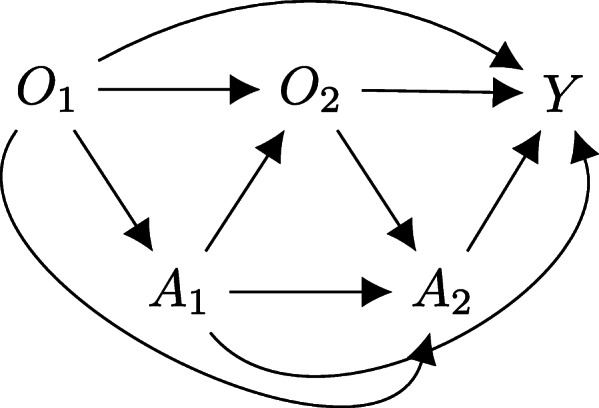
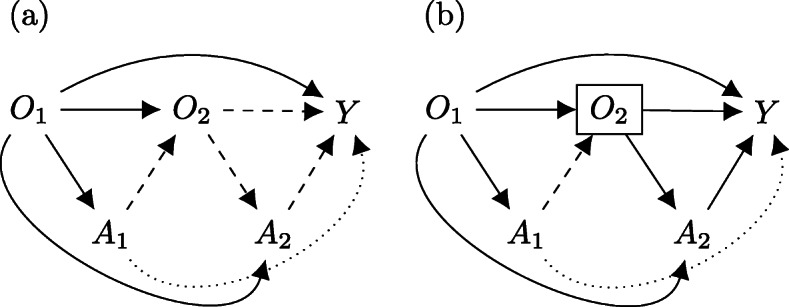
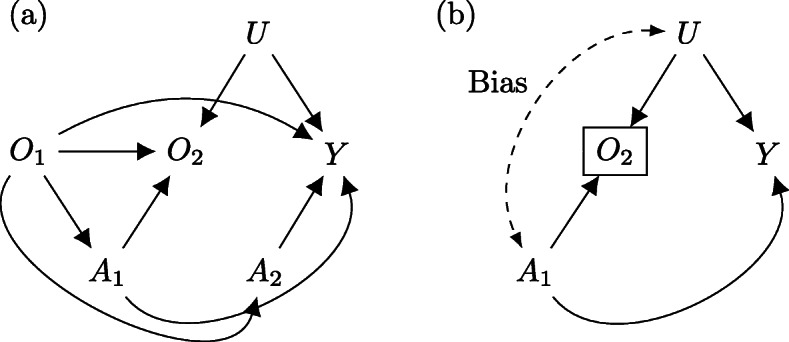
Keywords: Adaptive treatment policies; Causal inference; Directed acyclic graphs; Dynamic treatment regimens; Observational data; Sequential multiple assignment randomised trials.
Conflict of interest statement
The authors declare that there are no conflicts of interest.
Figures
References
-
- Chakraborty B, Moodie EEM. Statistical methods for dynamic treatment regimes. New York: Springer; 2013.
-
- Murphy SA. Optimal dynamic treatment regimes. J R Stat Soc B. 2003;62(2):331–366. doi: 10.1111/1467-9868.00389. - DOI
Publication types
MeSH terms
Grants and funding
LinkOut - more resources
Full Text Sources
Other Literature Sources
Research Materials
