. 2021 Feb 22;19(1):22.
doi: 10.1186/s12964-021-00710-5.

L-plastin Ser5 phosphorylation is modulated by the PI3K/SGK pathway and promotes breast cancer cell invasiveness

Affiliations

L-plastin Ser5 phosphorylation is modulated by the PI3K/SGK pathway and promotes breast cancer cell invasiveness

Raquel A C Machado et al. Cell Commun Signal. .

Abstract

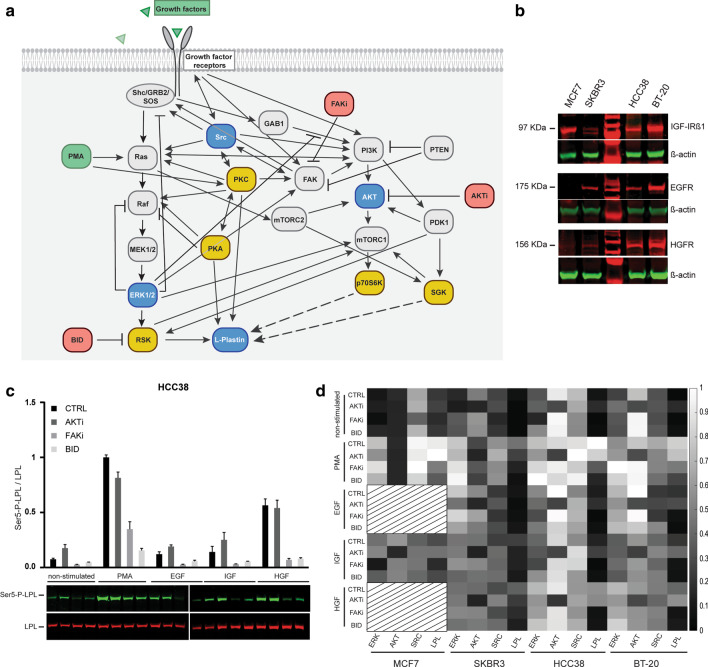
Background: Metastasis is the predominant cause for cancer morbidity and mortality accounting for approximatively 90% of cancer deaths. The actin-bundling protein L-plastin has been proposed as a metastatic marker and phosphorylation on its residue Ser5 is known to increase its actin-bundling activity. We recently showed that activation of the ERK/MAPK signalling pathway leads to L-plastin Ser5 phosphorylation and that the downstream kinases RSK1 and RSK2 are able to directly phosphorylate Ser5. Here we investigate the involvement of the PI3K pathway in L-plastin Ser5 phosphorylation and the functional effect of this phosphorylation event in breast cancer cells.

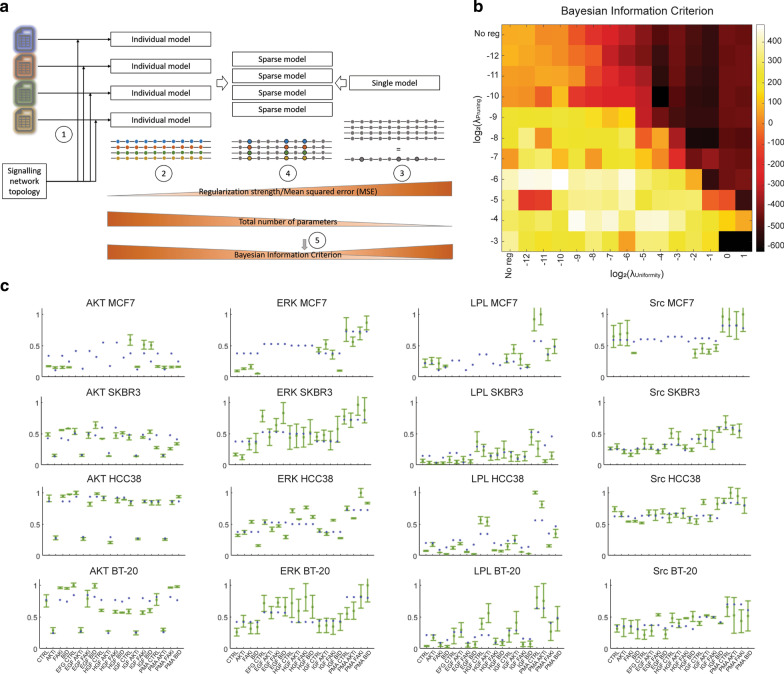
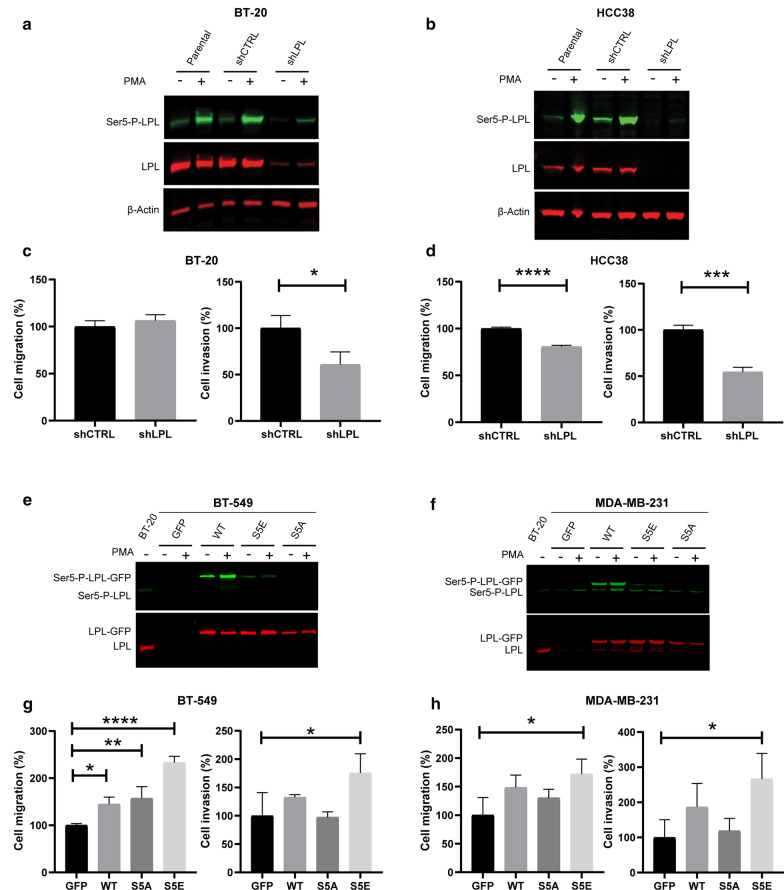
Methods: To unravel the signal transduction network upstream of L-plastin Ser5 phosphorylation, we performed computational modelling based on immunoblot analysis data, followed by experimental validation through inhibition/overexpression studies and in vitro kinase assays. To assess the functional impact of L-plastin expression/Ser5 phosphorylation in breast cancer cells, we either silenced L-plastin in cell lines initially expressing endogenous L-plastin or neoexpressed L-plastin wild type and phosphovariants in cell lines devoid of endogenous L-plastin. The established cell lines were used for cell biology experiments and confocal microscopy analysis.

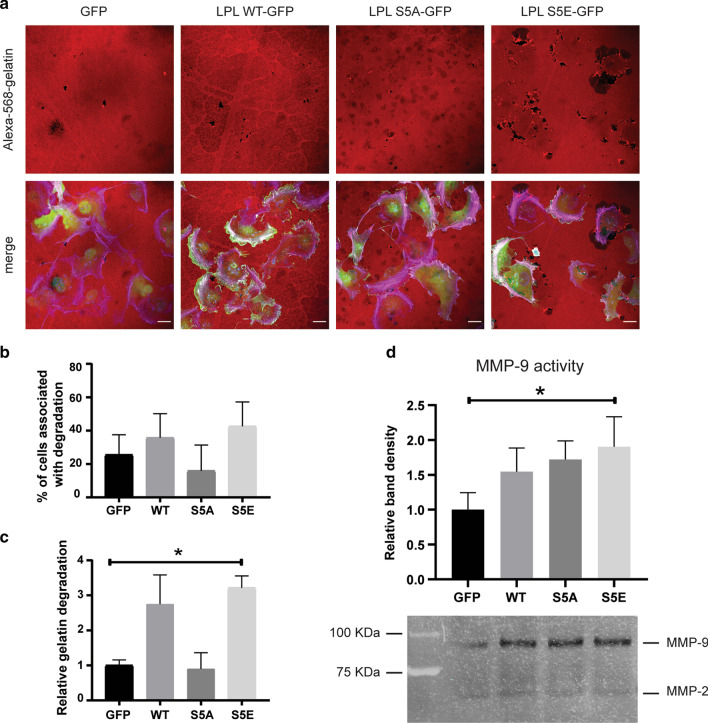
Results: Our modelling approach revealed that, in addition to the ERK/MAPK pathway and depending on the cellular context, the PI3K pathway contributes to L-plastin Ser5 phosphorylation through its downstream kinase SGK3. The results of the transwell invasion/migration assays showed that shRNA-mediated knockdown of L-plastin in BT-20 or HCC38 cells significantly reduced cell invasion, whereas stable expression of the phosphomimetic L-plastin Ser5Glu variant led to increased migration and invasion of BT-549 and MDA-MB-231 cells. Finally, confocal image analysis combined with zymography experiments and gelatin degradation assays provided evidence that L-plastin Ser5 phosphorylation promotes L-plastin recruitment to invadopodia, MMP-9 activity and concomitant extracellular matrix degradation.

Conclusion: Altogether, our results demonstrate that L-plastin Ser5 phosphorylation increases breast cancer cell invasiveness. Being a downstream molecule of both ERK/MAPK and PI3K/SGK pathways, L-plastin is proposed here as a potential target for therapeutic approaches that are aimed at blocking dysregulated signalling outcome of both pathways and, thus, at impairing cancer cell invasion and metastasis formation. Video abstract.

Keywords: Actin-bundling; ERK/MAPK pathway; Extracellular matrix degradation; Invadopodia; Invasion; L-plastin; Metastasis; PI3K pathway; RSK; SGK.


Conflict of interest statement

The authors declare that they have no competing interests.

Figures

Fig. 1
Fig. 1
Literature-derived L-plastin signalling network and activation state of the output nodes. a A candidate network for the signalling pathways upstream of L-plastin Ser5 phosphorylation was built based on literature information. Green indicates the stimulators used, red the inhibitors, blue the output nodes and yellow the kinases upstream of L-plastin Ser5 phosphorylation. The dashed arrows represent the interactions that are under investigation. b Characterization of the investigated breast cancer cell lines. Determination of the expression of different growth factor receptors in MCF7, SKBR3, HCC38 and BT-20 cells. 50 µg of total cell extract were loaded per sample and β-actin was stained as a loading control. c Example of an immunoblot analysis for L-plastin Ser5 phosphorylation (Ser5-P-LPL) and total L-plastin (LPL). The graph shows the ratio between Ser5-P-L-plastin and L-plastin. The values are represented as means ± SEM of three independent experiments. d The heatmap represents the activation states (scaled between 0 and 1) of the four output nodes in four different cell lines for all the conditions tested
Fig. 2
Fig. 2
Computational modelling approach. a Inference of the cell line-specific parameters: (1) input data consist of a generic network topology and measurements of the activation state of output nodes (ratio phosphoprotein/total protein) for four cell lines, each cell line being represented by a different colour. (2) Without any regularization, model parameters are independent across cell lines, which might result in overfitting of the dataset. (3) When, in contrast, model parameters are forced to be equal across all cell lines, the phenotypes of the different cell lines are smoothed out and only the average behavior can be inferred. (4) By applying various levels of regularization (penalizing model size), the sparsity of the model, i.e. the number of model parameters allowed to vary across cell lines, can be controlled. (5) The Bayesian Information Criterion (BIC) is a measure of adequacy of the model, balancing model fitness and model size. The model configuration with the lowest BIC, evidencing the most crucial differences in signalling between the cell lines, was chosen for the final analyses. b Regularization landscape. Heatmap of the BIC values for each regularized model. Optimal model parametrization was obtained by screening values of the lambda_Pruning and lambda_Uniformity regularization parameters and computing the BIC for each resulting model. The model with the lowest BIC is considered the most adequate to represent the data and is obtained with log2(lambda_Pruning) = − 10 and log2(lambda_Uniformity) = − 4. c Best fit. Comparison of the simulated activity of the different measured proteins (output nodes) with the measurements. X-axis: different experimental conditions. Y-axis: normalized activity. Green: average of experimental measurements. The error bars represent 1 standard deviation. Blue: activity as simulated with the FALCON toolbox under the optimized final model topology
Fig. 3
Fig. 3
The PI3K pathway is involved in L-plastin Ser5 phosphorylation through the PI3K/SGK3 axis. a BT-20, SKBR3 or HCC38 cells were treated with Apitolisib (A) or Trametinib (T) or with both inhibitors (A + T), with or without subsequent HGF stimulation. Following treatment, residual L-plastin Ser5 phosphorylation and total L-plastin were determined by immunoblot analysis. The graphs show the ratio between Ser5-P-L-plastin and L-plastin. Three independent experiments were performed for each cell line. Data were scaled to the highest signal obtained (= 1) and results are expressed as means ± SEM. Statistical analysis was performed doing one-way ANOVA, relative to the control (CTRL) condition with or without HGF stimulation, respectively (*p < 0.05, **p < 0.01, ***p < 0.001, ****p < 0.0001). b In vitro kinase assay. A total of 10 μg recombinant full-length L-plastin was incubated with 100 ng recombinant kinase and with 50 μM ATP in a reaction volume of 25 μl. RSK1 was used as a positive control kinase and a negative control (CTRL) was performed by omitting a kinase. L-plastin Ser5 phosphorylation and total L-plastin were determined by immunoblot analysis. c HEK 293 T cells were co-transfected with GFP-fused L-plastinWT and FLAG-tagged SGK3 WT, activated myristoylated SGK3 (Myr SGK3) or the empty vector (Ctrl). Cell extracts were prepared 48 h after transfection and immunoblot analysis was performed to determine L-plastin Ser5 phosphorylation and total L-plastin as well as SGK3 Thr320 phosphorylation and total SGK3
Fig. 4
Fig. 4
L-plastin Ser5 phosphorylation is important for migration and invasion of breast cancer cells in vitro. a, b L-plastin (red) and Ser5-P-L-plastin (green) immunoblotting of BT-20 (a) and HCC38 cells (b) transduced with shRNA control (shCTRL) and shRNA targeting L-plastin (shLPL). Cells were treated with 0.1 µM PMA for 1 h. β-actin (red) was stained as a loading control. c, d Statistical plots of transwell migration and Matrigel-coated transwell invasion assays. The number of cells which crossed the membrane was assessed after a 24 h incubation period and five fields at 20 × magnification objective were counted for each well. Three independent experiments were performed for each assay. Results are expressed as means ± SEM. Student’s t-test (*p < 0.05, ***p < 0.001, ****p < 0.0001). E) and F) L-plastin (red) and Ser5-P-L-plastin (green) immunoblotting of BT-549 (e) and MDA-MB-231 cells (f) transduced with GFP or GFP-fused L-plastinWT or the phosphorylation variants L-plastin S5E or L-plastin S5A. Cells were treated with 0.1 µM PMA for 1 h. BT-20 cell extract was loaded as a control for endogenous L-plastin expression. g, h Statistical plots of transwell migration and Matrigel-coated transwell invasion assays. The assays were performed as described under (c, d). Results are expressed as means ± SEM of three independent experiments. One way ANOVA followed by Dunnett’s multiple comparison test relative to GFP transduced cells (*p < 0.05, **p < 0.01, ****p < 0.0001)
Fig. 5
Fig. 5
Ser5 phosphorylation enhances L-plastin recruitment to invadopodia in MDA-MB-231 cells. a Expression pattern of the transduced MDA-MB-231 cells expressing the different GFP-fused L-plastin constructs. Cells were plated on gelatin-coated coverslips for 24 h and stained using anti-cortactin (blue) and Alexa Fluor 594-conjugated phalloidin (red) to visualize F-actin. GFP signal was amplified using the Alexa Fluor 488-conjugated GFP booster. Scale bar: 20 µm. Areas of actin, cortactin and L-plastin co-localization are seen in the overlay as white dot-like structures (right column). The insets show a higher magnification of the boxed areas. b Quantification of cortactin and F-actin-containing punctae per cell was performed using single confocal slices of the ventral surface of cells. Results are expressed as means ± SEM of three independent experiments in which 60–80 cells per conditions were assessed. One way ANOVA comparing all four groups showed no significance. c Percentage of GFP-positive invadopodia. Results are expressed as means ± SEM of three independent experiments. One way ANOVA followed by Tukey’s multiple comparison test (*p < 0.05). d Co-localization of Ser5 phosphorylated L-plastin with actin and cortactin in MDA-MB-231 cells. Cells were plated onto gelatin-coated coverslips for 24 h and stained using anti-cortactin (blue) and anti-Ser5-P-L-plastin (red) antibodies, followed by Alexa Fluor 633-conjugated phalloidin (magenta) to stain F-actin. Arrowheads point to areas of co-localization of proteins, which are seen in the overlay as white dot-like structures (right column). Scale bar: 10 µm
Fig. 6
Fig. 6
L-plastin Ser5 phosphorylation is not required for L-plastin/cortactin interaction. a L-plastinEF-ABD1 is phosphorylated upon PMA stimulation. HEK 293T cells were transfected with L-plastinWT-GFP or L-plastinEF-ABD1-GFP. Cells were treated with or without 0.1 μM PMA for 1 h and whole-cell lysates were submitted to L-plastin (red) and Ser5-P-L-plastin (green) immunoblotting. b Co-immunoprecipitation of cortactin with L-plastinWT in HEK 293T cells. Cells were transfected with GFP, L-plastinWT-GFP or L-plastinEF-ABD1-GFP and treated with 0.1 μM PMA for 1 h. Following cell lysis, protein extracts were subjected to immunoprecipitation with GFP-nanotrap. Aliquots of input [In], non-bound [NB], and bound [B] fractions were separated by SDS-PAGE and proteins were visualized by immunoblotting using an anti-cortactin antibody (#05-180). In the bound fraction, an intense unspecific signal is visible that corresponds to the important amount of precipitated L-plastinWT-GFP or L-plastinEF-ABD1-GFP. C) Co-immunoprecipitation of cortactin with L-plastinWT and L-plastin phosphovariants. Cells were transfected with GFP, L-plastinWT-GFP, L-plastinS5E-GFP and L-plastinS5A-GFP and treated with or without 0.1 μM PMA for 1 h. Protein extracts were subjected to immunoprecipitation with GFP-nanotrap. Aliquots of input [In], non-bound [NB], and bound [B] fractions were separated by SDS-PAGE and proteins were visualized by immunoblotting using an anti-cortactin antibody (#sc-11408). In the bound fraction, an intense unspecific signal is visible that corresponds to the important amount of precipitated L-plastin-GFP variants
Fig. 7
Fig. 7
Cells expressing the phosphomimetic L-plastinS5E variant exhibit higher ability to degrade gelatin. a Representative images of the transduced MDA-MB-231 cells expressing the different GFP-fused L-plastin variants and degraded gelatin. Cells were plated on Alexa Fluor 568-labeled gelatin (red)-coated coverslips for 6 h and stained using Alexa Fluor 633-conjugated phalloidin (magenta) to visualize F-actin. GFP signal was amplified using the Alexa Fluor 488-conjugated GFP booster. Single confocal slices of the ventral surface of cells are shown. Areas of gelatin degradation can be identified as dark spots. Scale bar: 20 µm. b Quantification of cells associated with gelatin degradation. Results are expressed as means ± SEM of three independent experiments in which 100–150 cells per condition were assessed. One way ANOVA comparing all four groups showed no significance. c Quantification of the total degradation area normalized against total cell area. Results are expressed as means ± SEM of three independent experiments. One way ANOVA followed by Dunnett’s multiple comparison test relative to GFP transduced cells (*p < 0.05). d MMP activities measured by gelatin zymography. Conditioned media were collected after 24 h and equal amounts were loaded on the gel. Shown is a representative gel. The graph shows the densitometry of the MMP-9 degraded band relative to GFP control sample. Results are expressed as means ± SEM of three independent experiments. One way ANOVA followed by Dunnett’s multiple comparison test relative to GFP transduced cells (*p < 0.05)
Fig. 8
Fig. 8
L-plastin Ser5 phosphorylation cascade in cancer cells. The ERK/MAPK and PI3K pathways are frequently dysregulated in cancer. Upon activation of these signalling pathways, their downstream effector kinases RSK1/2 and SGK3, respectively, are able to phosphorylate L-plastin on its residue Ser5. This phosphorylation leads to increased L-plastin bundling activity as well as enhanced recruitment to invadopodia and ECM degradation, promoting the invasiveness of the cancer cell

Similar articles

Cited by

References

    1. Day EK, Sosale NG, Lazzara MJ. Cell signaling regulation by protein phosphorylation: a multivariate, heterogeneous, and context-dependent process. Curr Opin Biotechnol. 2016;40:185–192. doi: 10.1016/j.copbio.2016.06.005. - DOI - PMC - PubMed
    1. Giancotti FG. Deregulation of cell signaling in cancer. FEBS Lett. 2014;588:2558–2570. doi: 10.1016/j.febslet.2014.02.005. - DOI - PMC - PubMed
    1. Velloso FJ, Bianco AFR, Torres NEC, Chang TH, Sogayar MC. The crossroads of breast cancer progression: insights into the modulation of major signaling pathways. OncoTargets Ther. 2017;10:5491–5524. doi: 10.2147/OTT.S142154. - DOI - PMC - PubMed
    1. Bailey MH, Tokheim C, Porta-Pardo E, Sengupta S, Bertrand D, Weerasinghe A, et al. Comprehensive characterization of cancer driver genes and mutations. Cell. 2018;173(2):371–385.e18. doi: 10.1016/j.cell.2018.02.060. - DOI - PMC - PubMed
    1. De Luca A, Maiello MR, D’Alessio A, Pergameno M, Normanno N. The RAS/RAF/MEK/ERK and the PI3K/AKT signalling pathways: role in cancer pathogenesis and implications for therapeutic approaches. Expert Opin Ther Targets. 2012;16(SUPPL.2):S17–27. doi: 10.1517/14728222.2011.639361. - DOI - PubMed

Publication types