. 2023 May 1;65(5):e02328-20.
doi: 10.1128/AAC.02328-20. Epub 2021 Feb 22.

GS-9822, a preclinical LEDGIN candidate, displays a block-and-lock phenotype in cell culture

Affiliations

GS-9822, a preclinical LEDGIN candidate, displays a block-and-lock phenotype in cell culture

Anne Bruggemans et al. Antimicrob Agents Chemother. .

Abstract

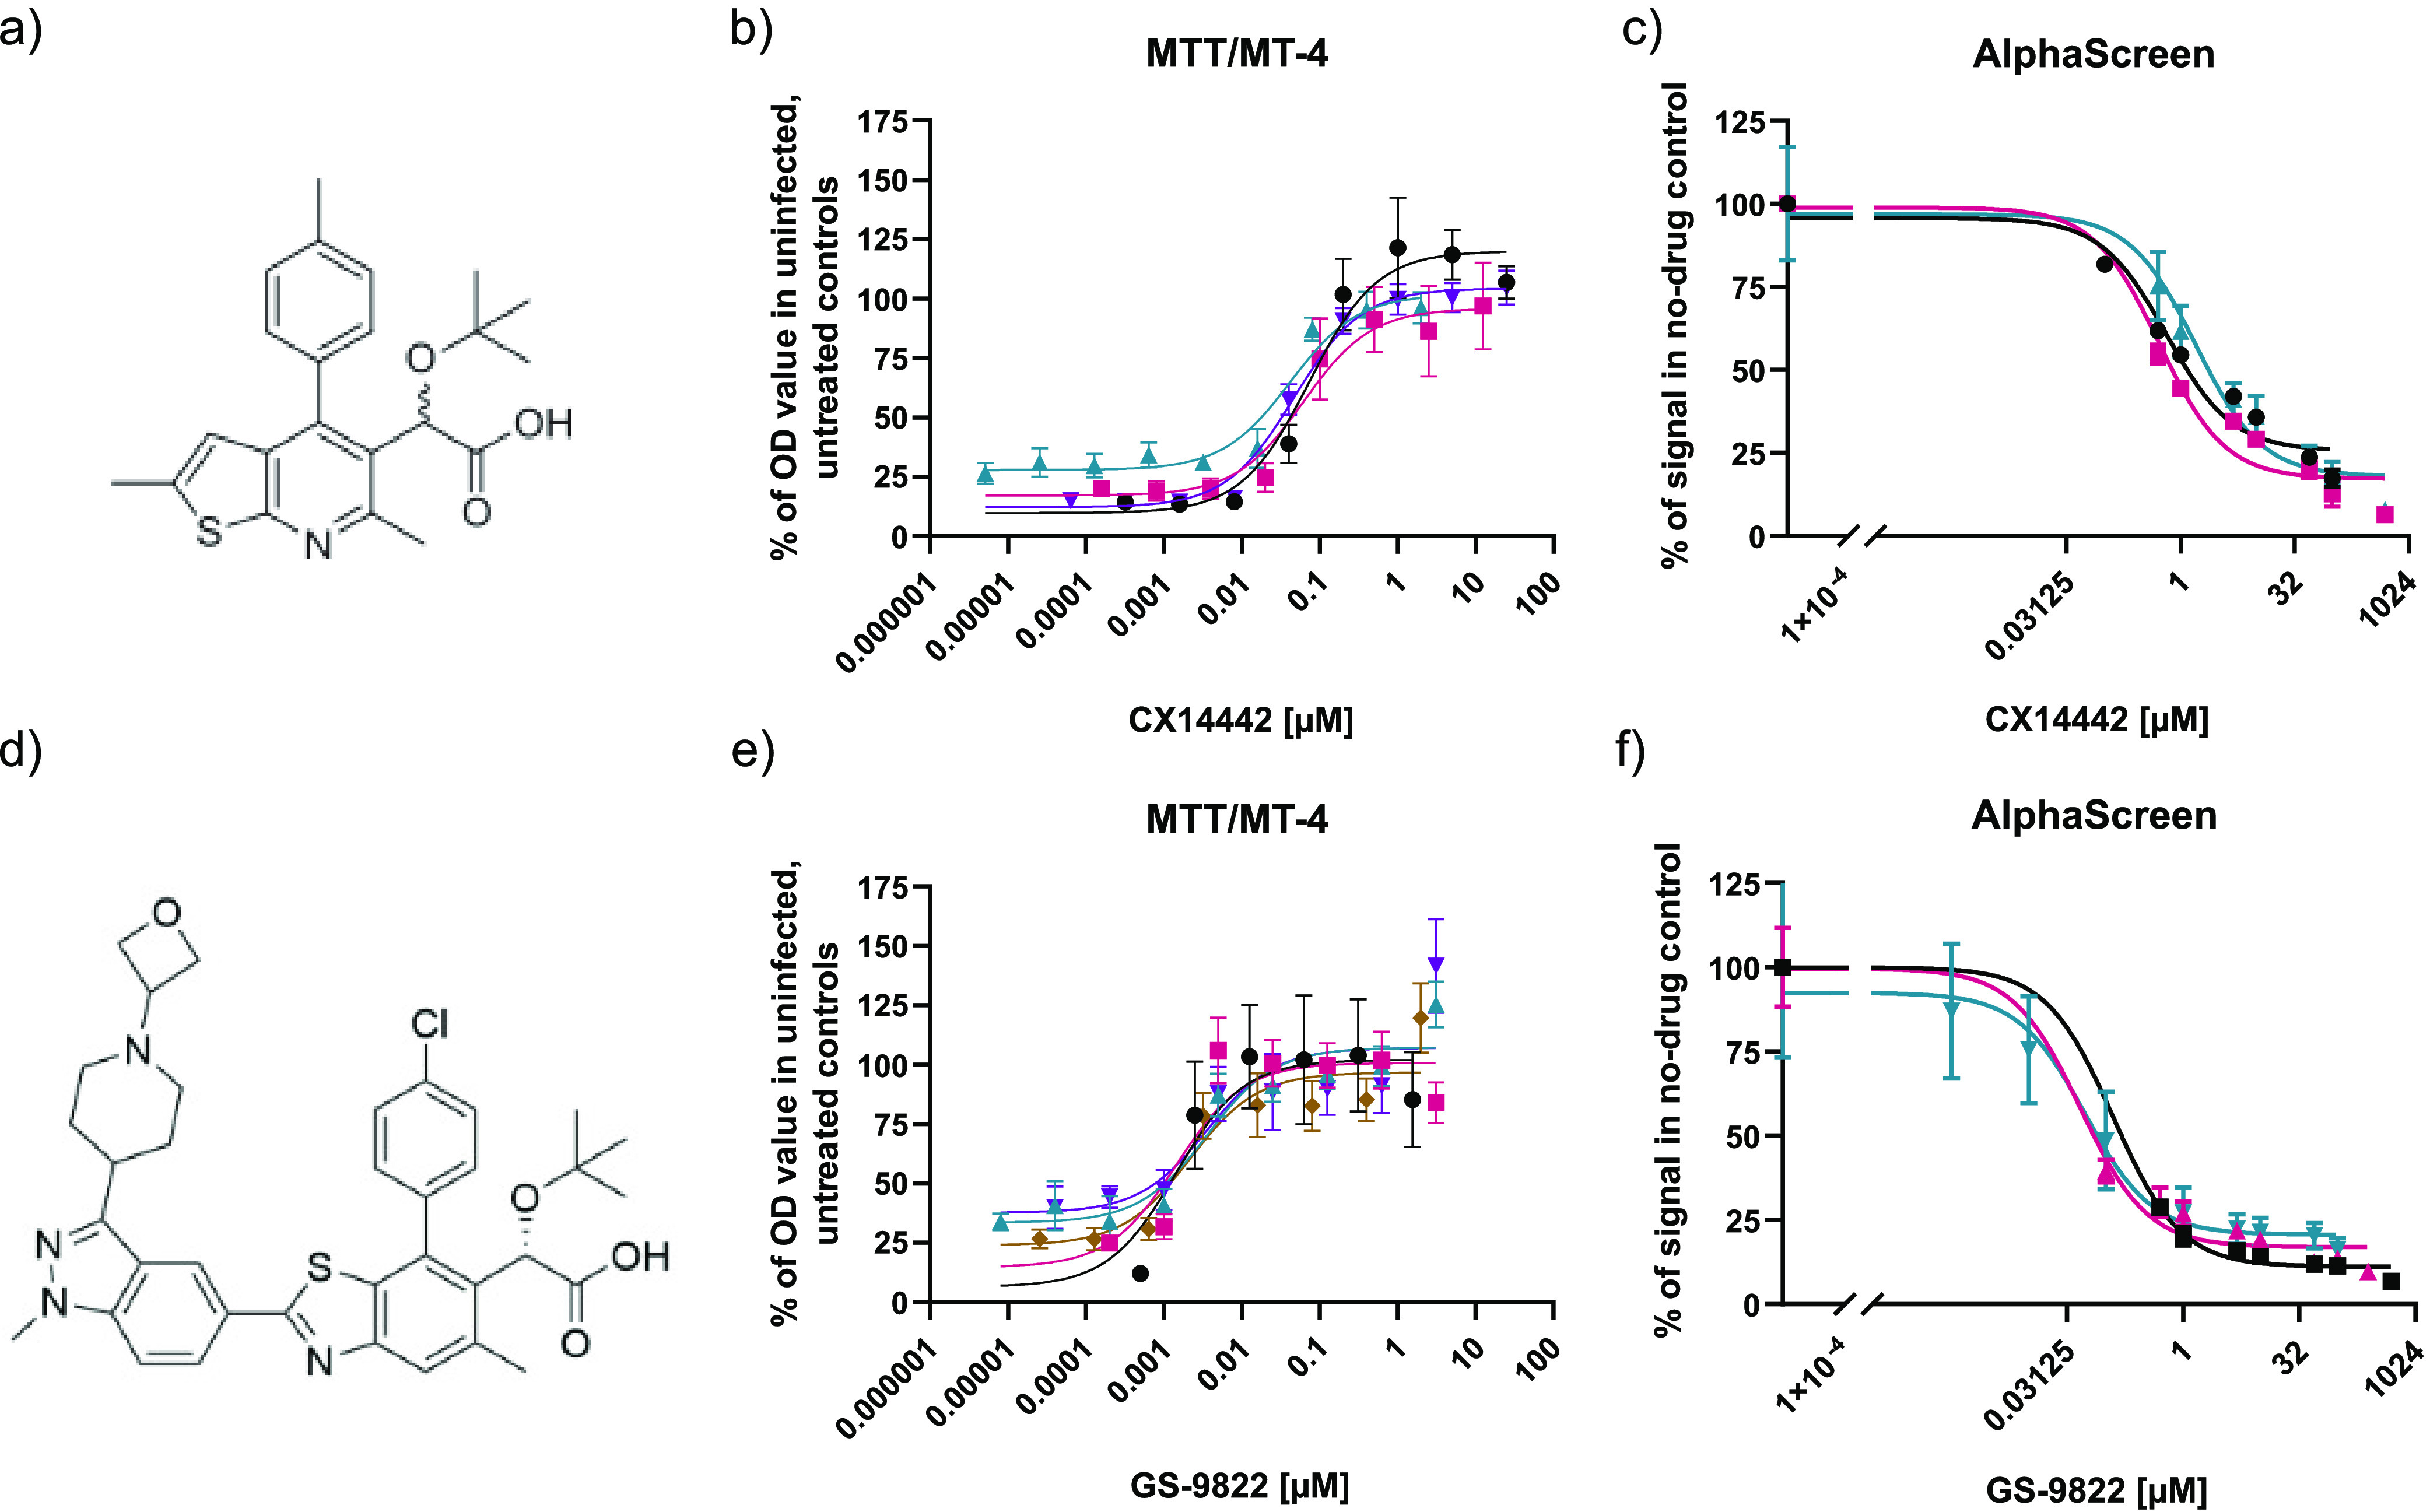
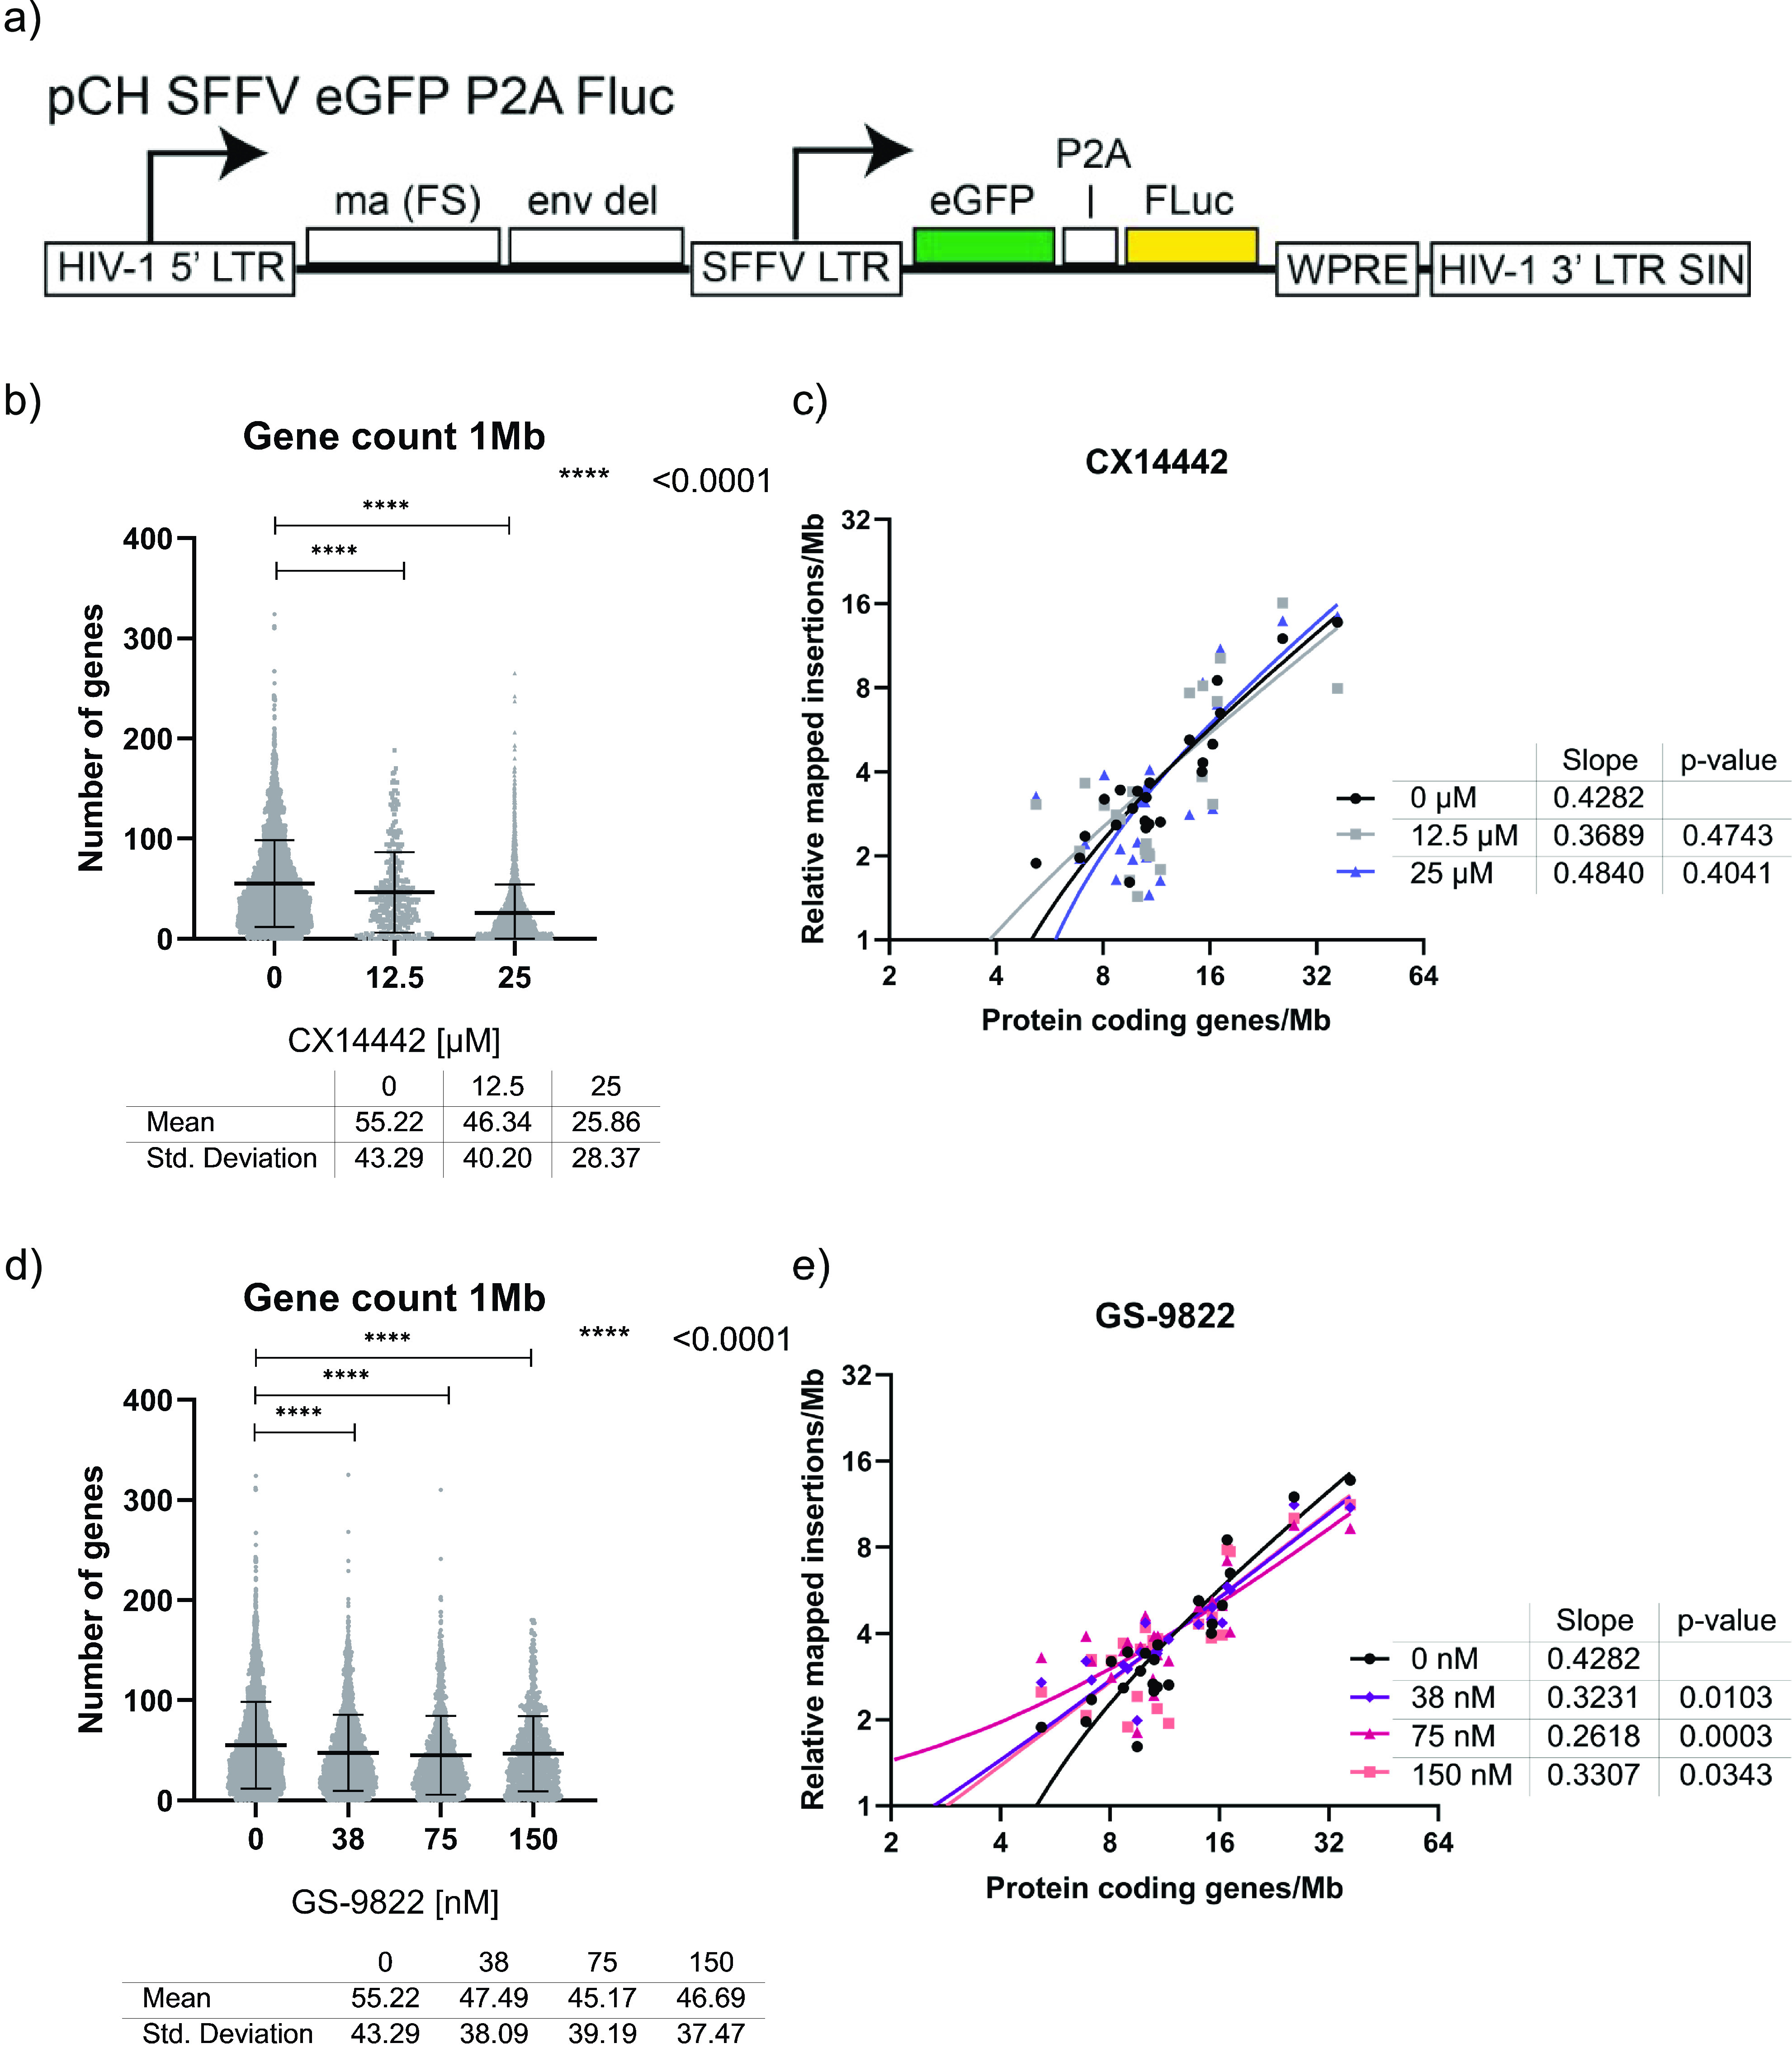
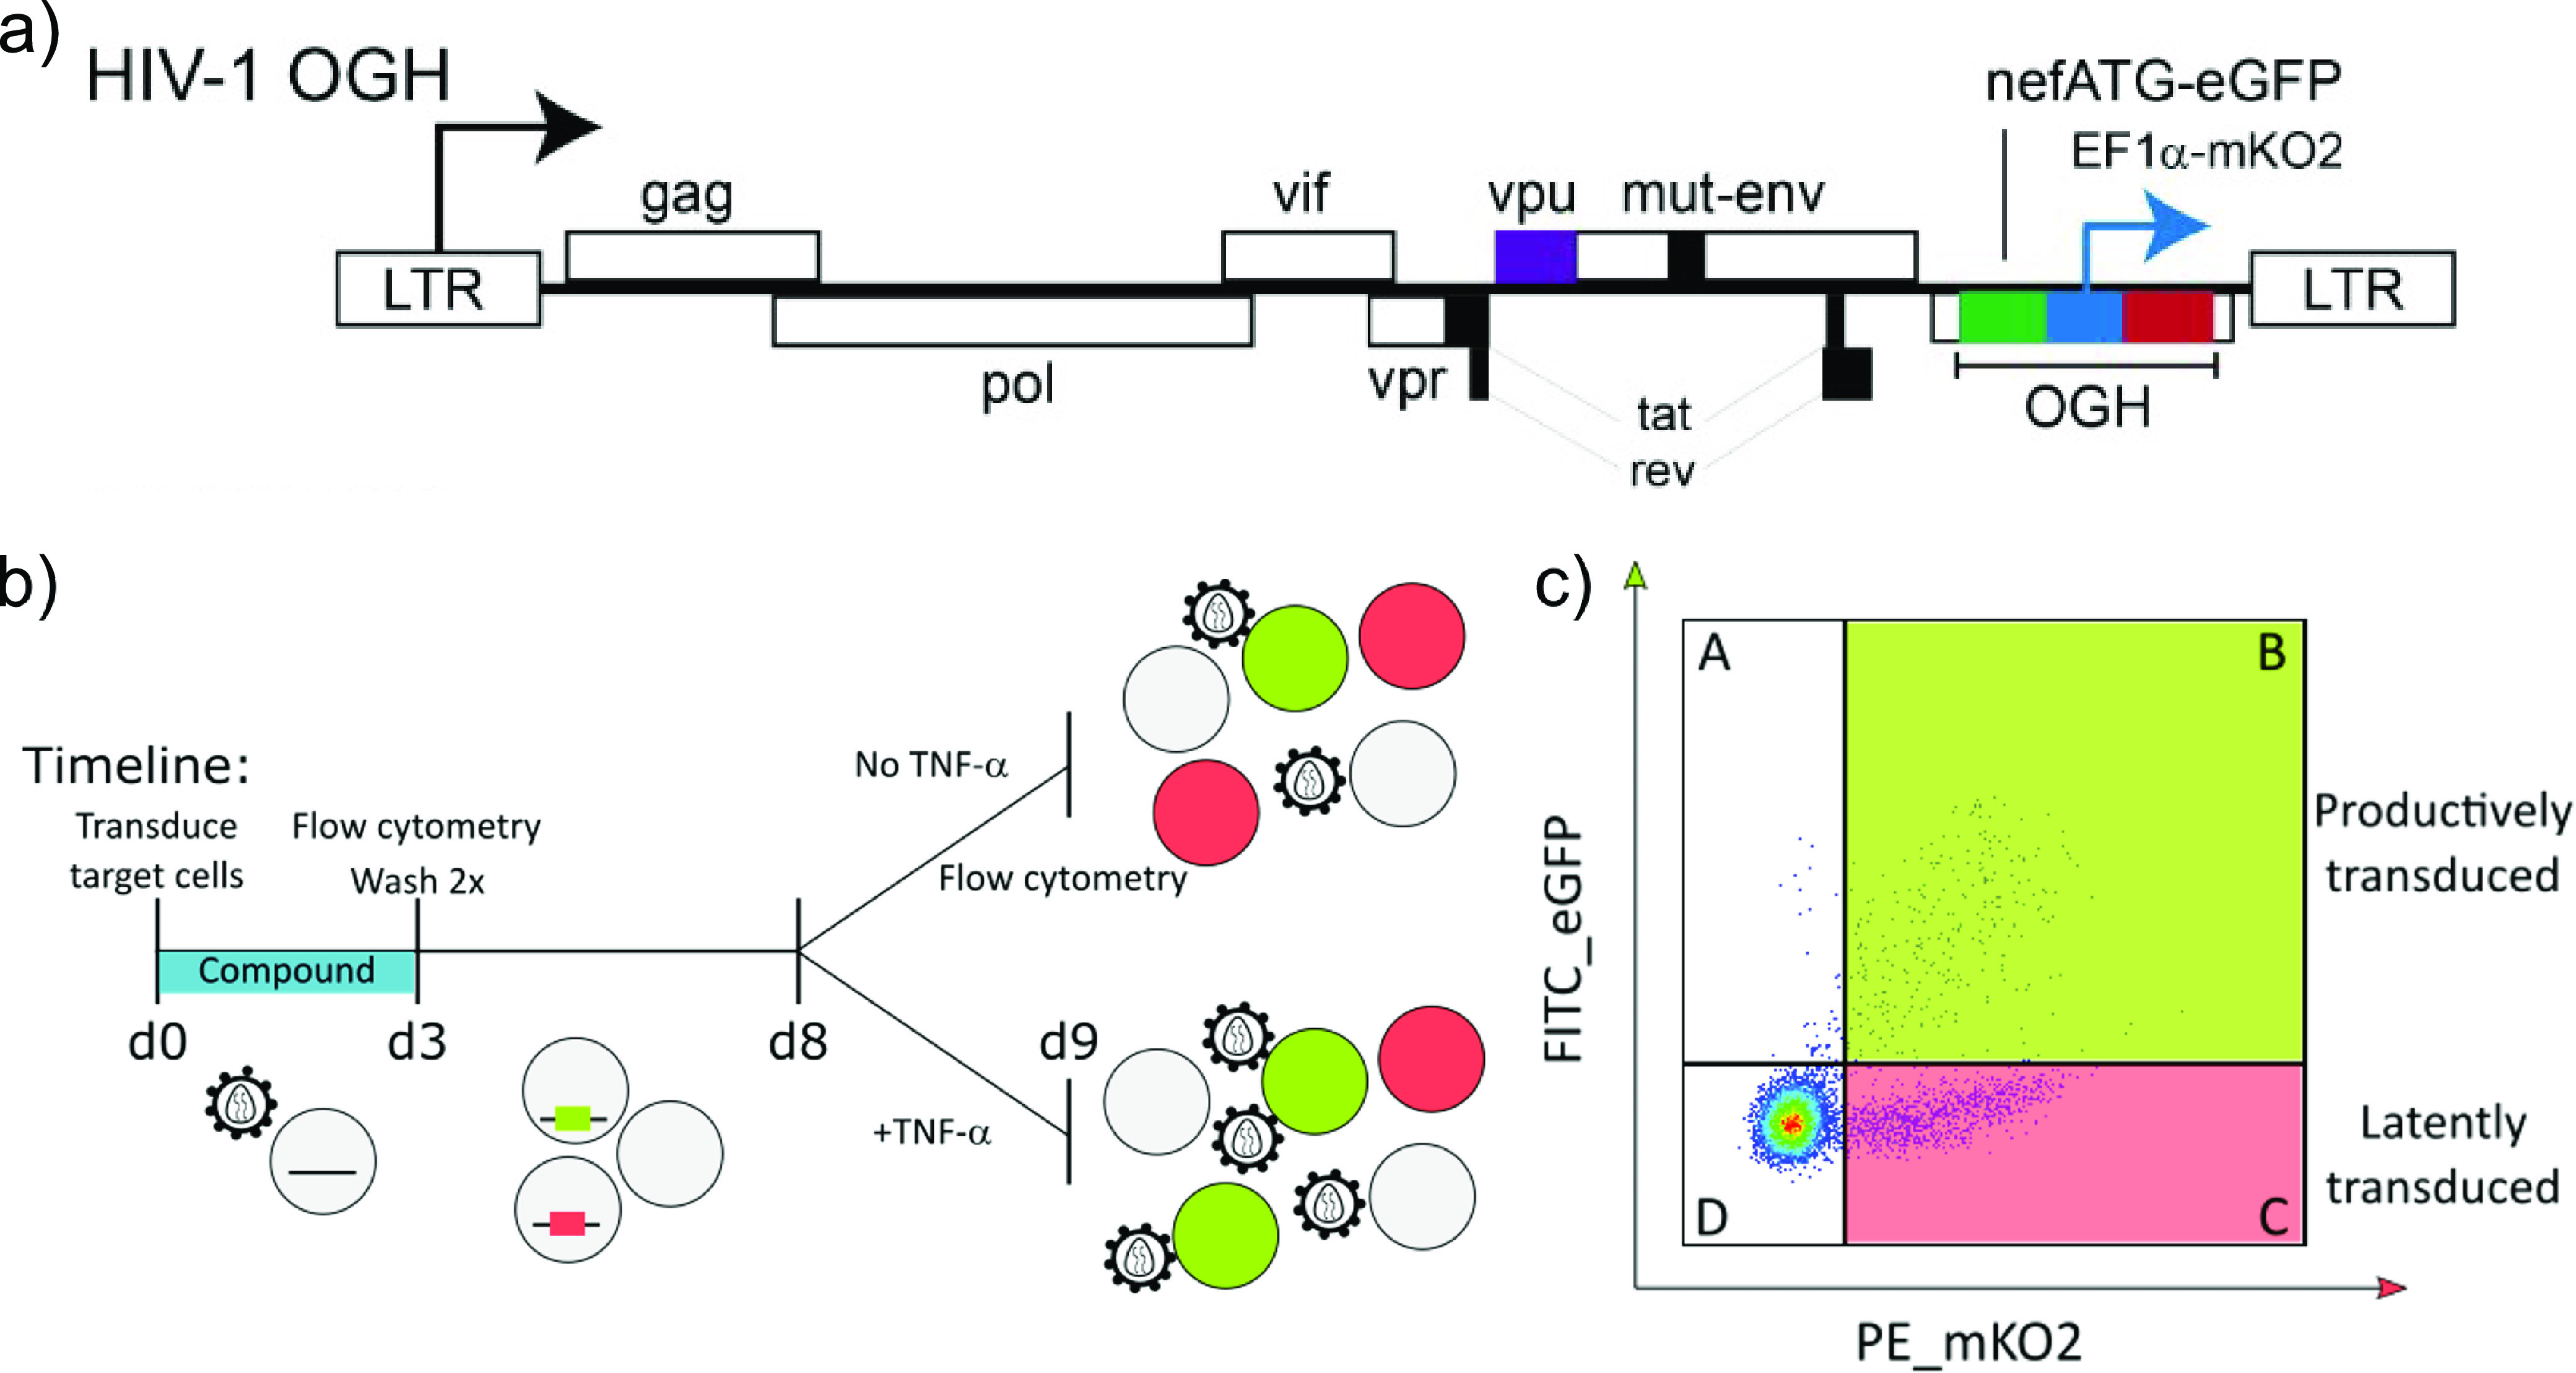
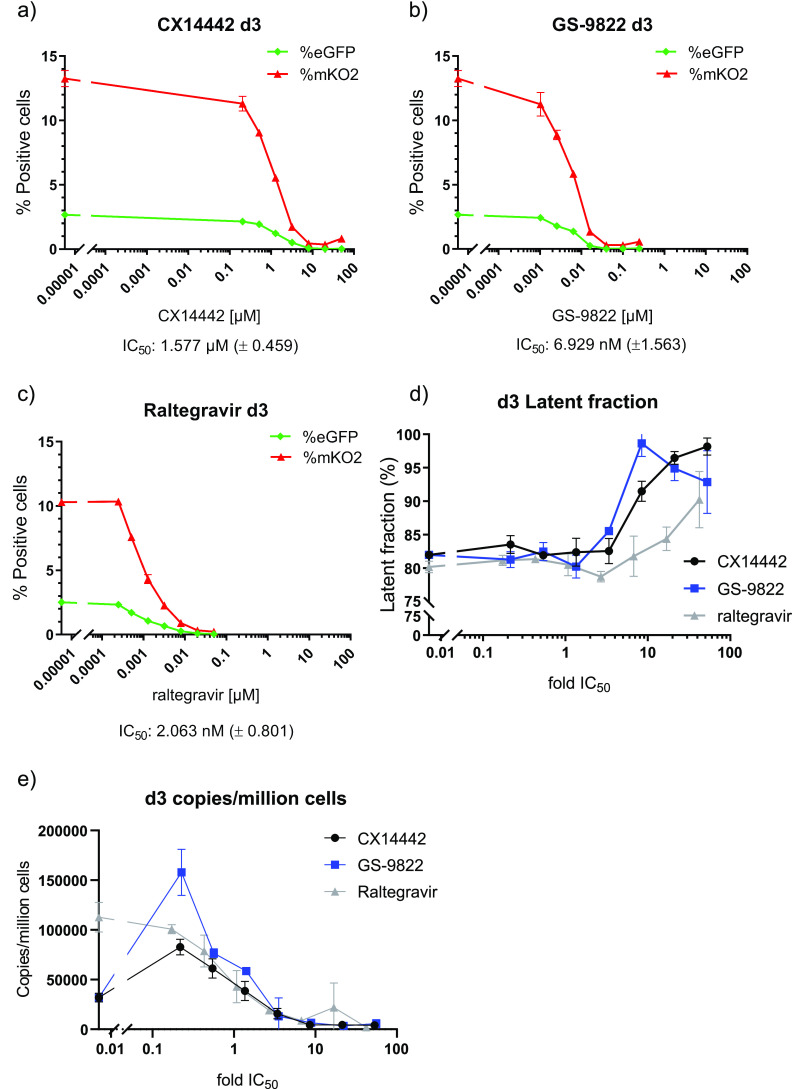
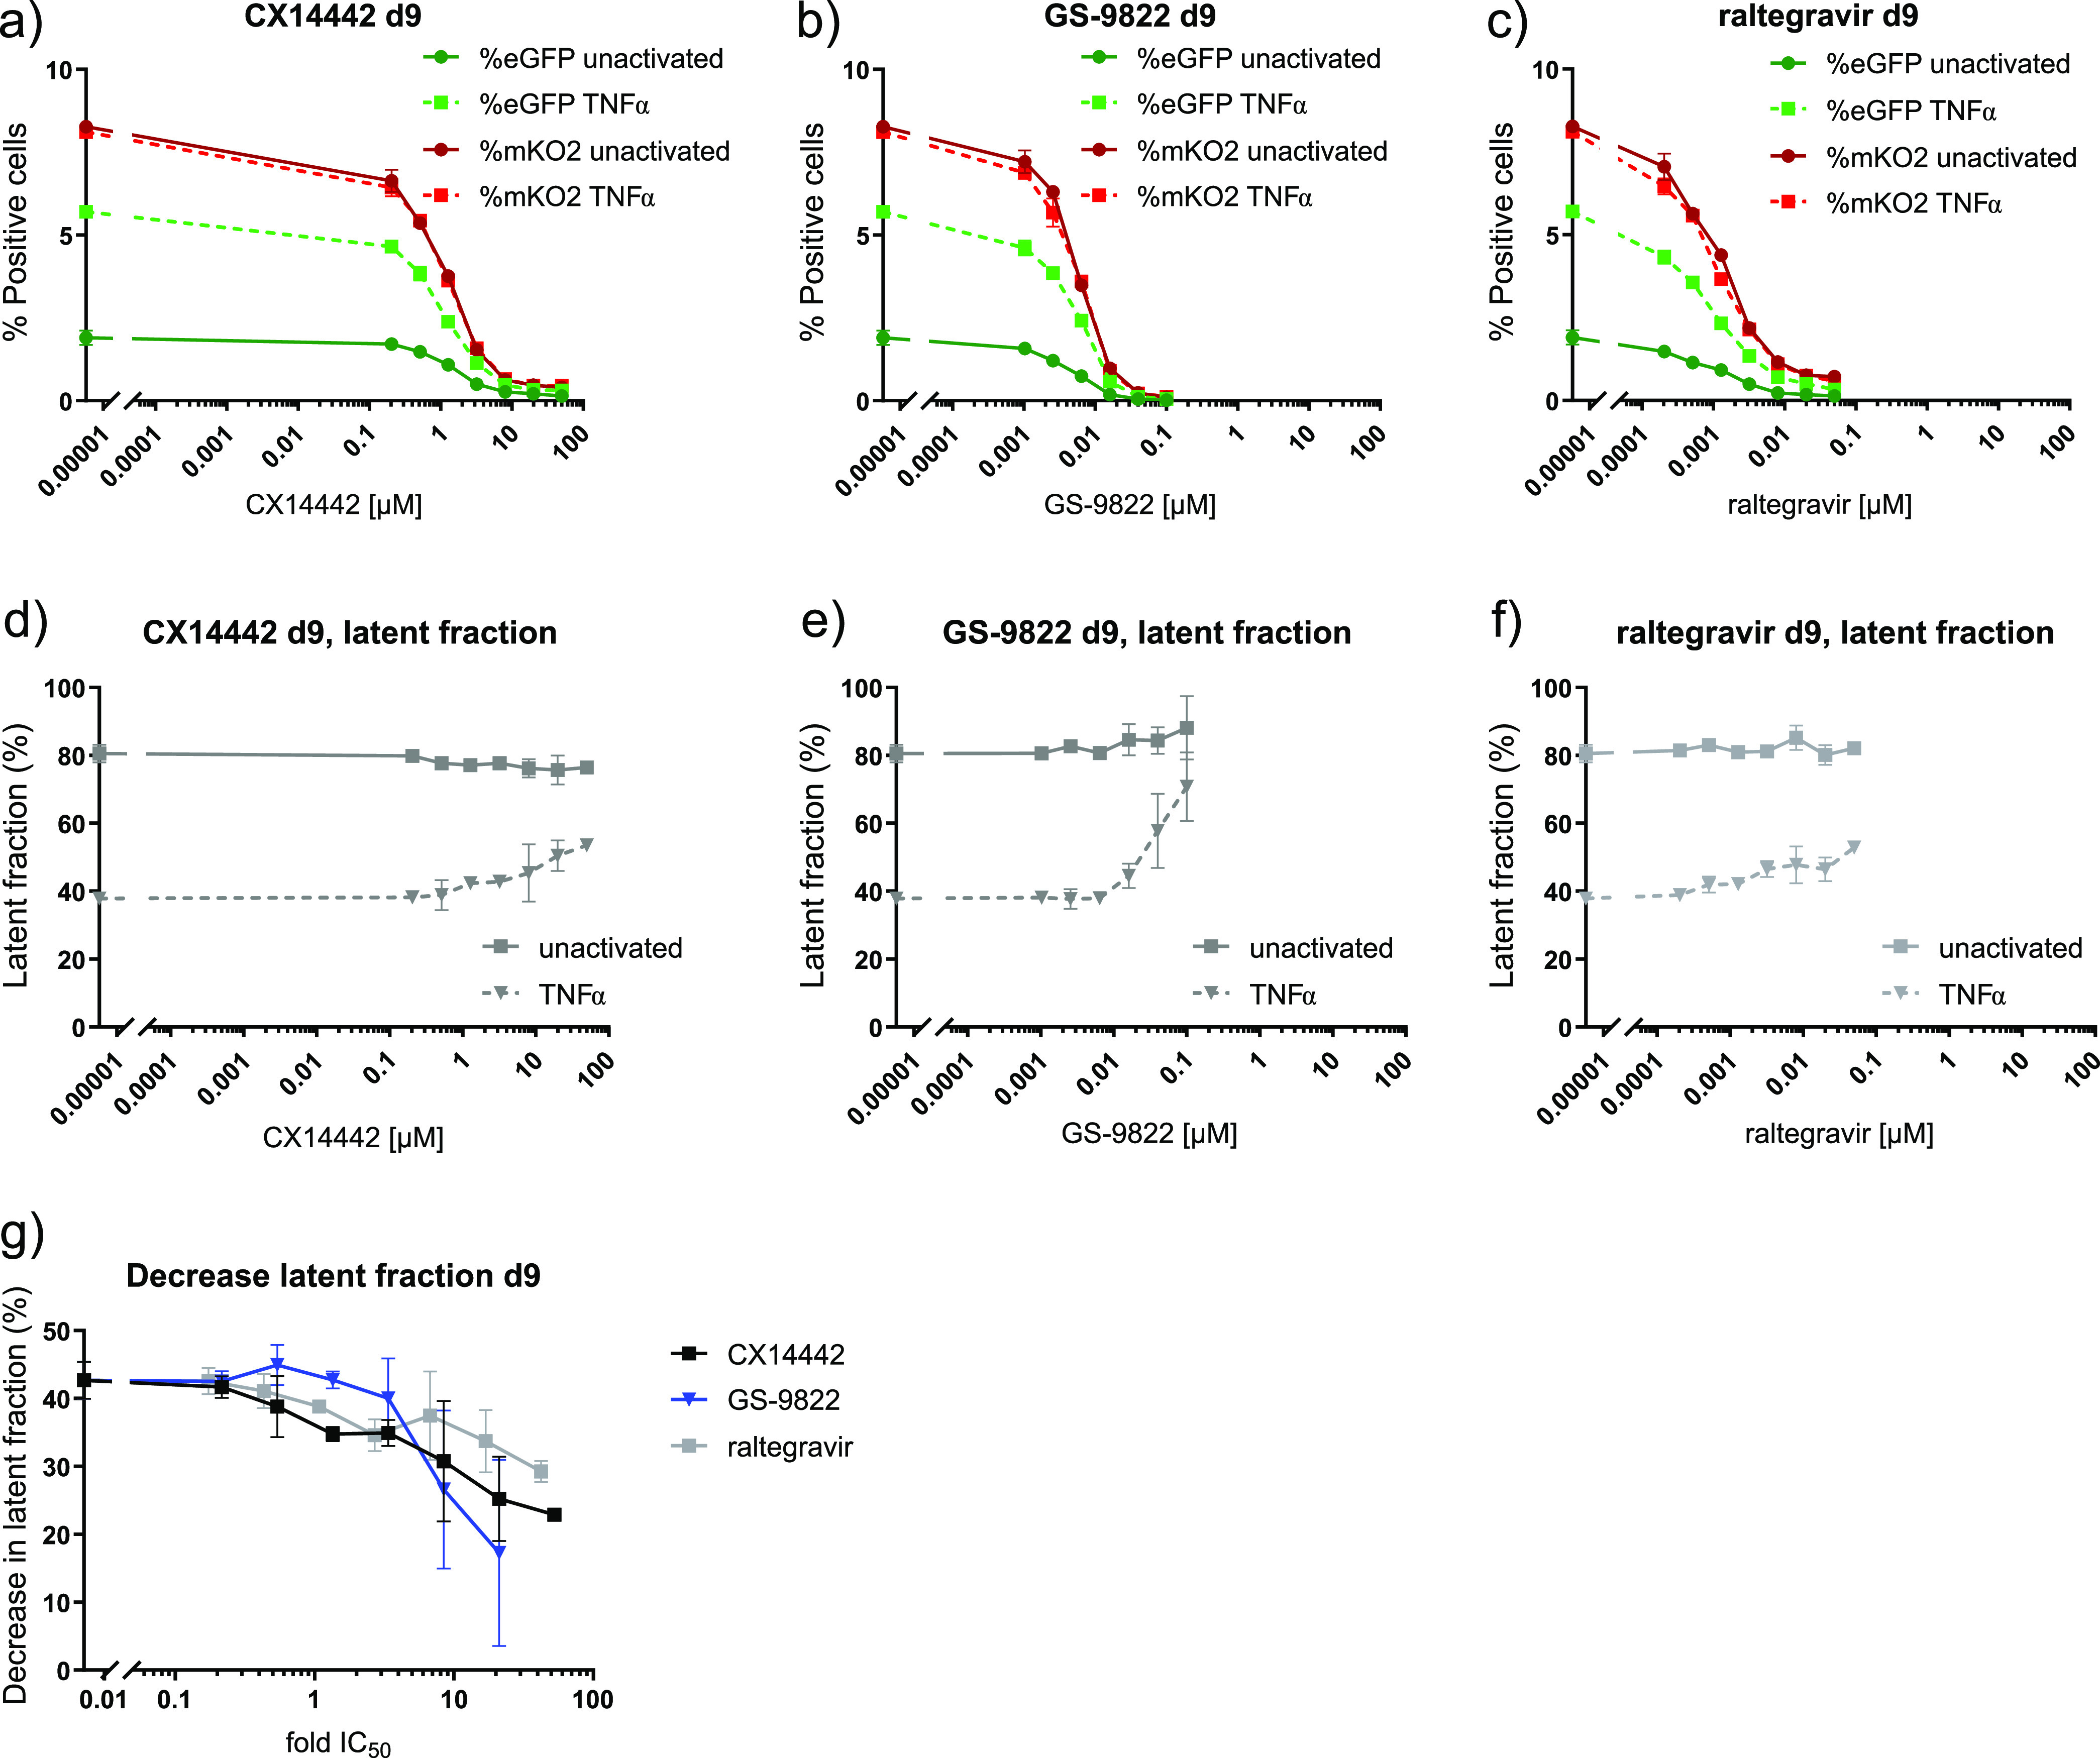
The ability of HIV to integrate into the host genome and establish latent reservoirs is the main hurdle preventing an HIV cure. LEDGINs are small-molecule integrase inhibitors that target the binding pocket of LEDGF/p75, a cellular cofactor that substantially contributes to HIV integration site selection. They are potent antivirals that inhibit HIV integration and maturation. In addition, they retarget residual integrants away from transcription units and towards a more repressive chromatin environment. As a result, treatment with the LEDGIN CX14442 yielded residual provirus that proved more latent and more refractory to reactivation, supporting the use of LEDGINs as research tools to study HIV latency and a functional cure strategy. In this study we compared GS-9822, a potent, pre-clinical lead compound, with CX14442 with respect to antiviral potency, integration site selection, latency and reactivation. GS-9822 was more potent than CX14442 in most assays. For the first time, the combined effects on viral replication, integrase-LEDGF/p75 interaction, integration sites, epigenetic landscape, immediate latency and latency reversal was demonstrated at nanomolar concentrations achievable in the clinic. GS-9822 profiles as a preclinical candidate for future functional cure research.


Figures

FIG 1
FIG 1
CX14442 and GS-9822 block HIV-1-induced cell toxicity and inhibit the interaction between HIV-1 integrase and LEDGF/p75. (a and d) Chemical structures of CX14442 and GS-9822. (b and e) Dose-response curves for MTT viability assays with CX14442 and GS-9822 in MT4-cells 5 days after infection with HIV-1 (strain IIIB). Cell viability, measured as optical density (OD) values, is greatly reduced upon HIV-1 infection but increases upon addition of the compounds. Results are plotted as a percentage of the OD values obtained in uninfected, untreated cells within the same experiment. Mean values and standard deviations (SD) are shown for CX14442 (n = 4) and GS-9822 (n = 5). Each sample was run in triplicate. (c and f) Dose-response curves of CX14442 and GS-9822 in AlphaScreen. Increasing concentrations of compound were added to 50 nM HIV-1 integrase (strain NL4.3) and 100 nM LEDGF/p75. Data shown are mean values and standard deviations for 3 experiments, with each analysis performed in duplicate. Data are plotted as a percentage of the signal in the no-drug control.
FIG 2
FIG 2
GS-9822 retargets integration away from gene-dense regions. SupT1 cells were transduced for 3 days with CH-SFFV-eGFP-P2A-fLuc in the presence or absence of various drug concentrations and kept in culture for at least 10 days. Next, genomic DNA was extracted for Illumina Miseq integration site sequencing, and data were analyzed via the INSPIIRED platform (59, 60). (a) Schematic representation of CH-SFFV-eGFP-P2A-fluc, a single round lentiviral vector containing an enhanced green fluorescent protein (eGFP) and firefly luciferase (fLuc) reporter gene used for integration site sequencing. (b and d) Graphs plotting the number of genes counted within a 1-Mb range of each integration site for samples treated with CX14442 and GS-9822, respectively. Annotated data were obtained using the University of California Santa Cruz (UCSC) Genome Browser website (http://genome.ucsc.edu, UCSC Known Genes) (90, 91). Mean values and standard deviations are plotted on top. Samples were compared to the no-compound condition using a Kruskall-Wallis test. (c and e) XY-plots showing the relative number of mapped insertions/Mb (y axis) over the UCSC protein coding gene density of each chromosome (x axis). For each sample, we calculated the insertions per Mb per chromosome, relative to the number of mapped insertions per condition to compensate for the differences in the number of integration sites between samples. For each condition, the total number of sites for all chromosomes is 100. Protein-coding genes were defined as gene entries containing a UniProt protein ID.
FIG 3
FIG 3
HIV-1 OGH: a double reporter construct used to analyze the impact of LEDGINs on immediate latency and reactivation. (a) Schematic representation of the HIV-1 OGH construct (51, 55, 56). HIV-1 OGH is a replication-deficient vector containing an eGFP gene under the control of the viral LTR promoter. HIV-1 OGH also carries a constitutively active transcriptional unit of an mKO2 reporter driven by an EF1α promoter. (b) Timeline of the transduction and reactivation experiments. SupT1 cells were transduced in the presence of CX14442 or GS-9822. Three days postransduction, vector and compounds were washed away, and flow cytometry analysis was performed. Eight days postransduction, cells were reactivated with 10 ng/ml TNF-α for 24 h. At day 9, 24 h postreactivation, cells were analyzed by flow cytometry. (c) Representative dot plot of SupT1 cells, transduced with 120 × 106 pg of HIV-1 OGH on day 9 (condition without TNF-α), showing how flow cytometry makes it possible to distinguish between different cell populations. Cells only expressing mKO2 from the constitutively active EF1α promoter have an inactive LTR and are thus considered to be latently transduced (quadrant C). If cells are productively transduced (quadrant B), the viral LTR promoter will drive eGFP expression as well, resulting in double positive cells.
FIG 4
FIG 4
Treatment with CX14442 or GS-9822 but not raltegravir increases immediate latency of HIV-1 OGH double reporter construct. (a to c) Data of one representative experiment out of 4 plotting the average of duplicate measurements with standard deviation. Percentage of eGFP and mKO2-positive cells 3 days postransduction of SupT1 cells with a 1/20,000 dilution of HIV-1 OGH. Cells were treated with increasing concentrations of CX14442, GS-9822, or raltegravir. eGFP-positive cells are shown in green, and mKO2 positive cells are plotted in red. Mean IC50 values with standard error of the mean (SEM) for CX14442, GS-9822 and raltegravir are listed below the graphs. (d) The latent fraction (percentage of single mKO2-positive cells/[percentage of single mKO2-positive cells + percentage of double positive cells] · 100) or (quadrant C/[quadrant B + quadrant C]) as shown in panel c was calculated 3 days postransduction of SupT1 cells with a 1/20,000 dilution of HIV-1 OGH virus. Compound concentrations are plotted as a fold of the IC50. (e) Copies/million cells as calculated by Alu-LTR and CCR5 qPCR on day 3 postransduction of SupT1 cells with a 1/20,000 dilution of HIV-1 OGH virus. Mean values and SD are shown for one representative experiment out of 2. Compound concentrations are plotted as a fold of the IC50.
FIG 5
FIG 5
Treatment with CX14442 or GS-9822 but not raltegravir decreases reactivation from latency. Flow cytometry data on day 9 or 24 h after reactivation of HIV-1 OGH transduced SupT1 cells with 10 ng/ml TNF-α are shown for a 1/20,000 virus dilution. Full lines represent nonactivated cells, and dotted lines represent TNF-α-treated cells. Data show one representative experiment out of 4, and the average of duplicate measurements with standard deviation is plotted. (a to c) The percentages of mKO2- and eGFP-positive cells for cells pretreated with CX14442, GS-9822, or raltegravir are shown. eGFP-positive cells are shown in green, and mKO2-positive cells are plotted in red. (d to f) The latent fraction, calculated as described above, for cells pretreated with CX14442, GS-9822, or raltegravir is shown. (g) Upon reactivation, the latent fraction decreases, and the plotted decrease in latent fraction is calculated by subtracting the latent fraction under the TNF-α-treated condition from the latent fraction under the nontreated condition. Compound concentrations for this graph are plotted as a fold of the IC50.

References

    1. National Institutes of Health. 2021. FDA-approved HIV medicines. Understanding HIV/AIDS. AIDSinfo. NIH, Bethesda, MD. https://hivinfo.nih.gov/understanding-hiv/fact-sheets/fda-approved-hiv-m....
    1. EACS. 2019. European guidelines for the treatment of people living with HIV (PLWH) in Europe. Guidelines 122. EACS, Brussels, Belgium. https://www.eacsociety.org/guidelines/eacs-guidelines/eacs-guidelines.html.
    1. DHHS Panel on Antiretroviral Guidelines for Adults and Adolescents–A Working Group of the Office of AIDS Research Advisory Council (OARAC). 2018. Panel on Antiretroviral Guidelines for Adults and Adolescents. Guidelines for the use of antiretroviral agents in adults and adolescents with HIV. Department of Health and Human Services, Washington, DC. https://clinicalinfo.hiv.gov/sites/default/files/inline-files/AdultandAd....
    1. World Health Organization (WHO). 2019. Policy brief: update of recommendations on first- and second-line antiretroviral regimens. WHO, Geneva, Switzerland. https://www.who.int/hiv/pub/arv/arv-update-2019-policy/en/.
    1. Joint United Nations Programme on HIV/AIDS (UNAIDS). 2019. UNAIDS data 2019. UNAIDS, Geneva, Switzerland. https://www.unaids.org/en/resources/documents/2019/2019-UNAIDS-data.

LinkOut - more resources