. 2021 Mar 2;118(9):e2021847118.
doi: 10.1073/pnas.2021847118.

Gatorbulin-1, a distinct cyclodepsipeptide chemotype, targets a seventh tubulin pharmacological site

Affiliations

Gatorbulin-1, a distinct cyclodepsipeptide chemotype, targets a seventh tubulin pharmacological site

Susan Matthew et al. Proc Natl Acad Sci U S A. .

Abstract

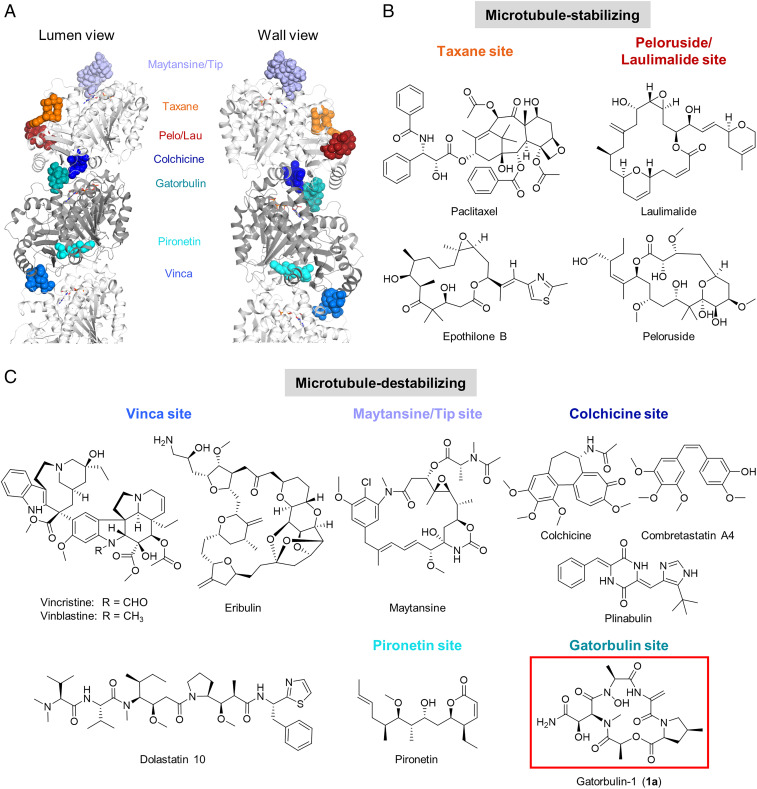
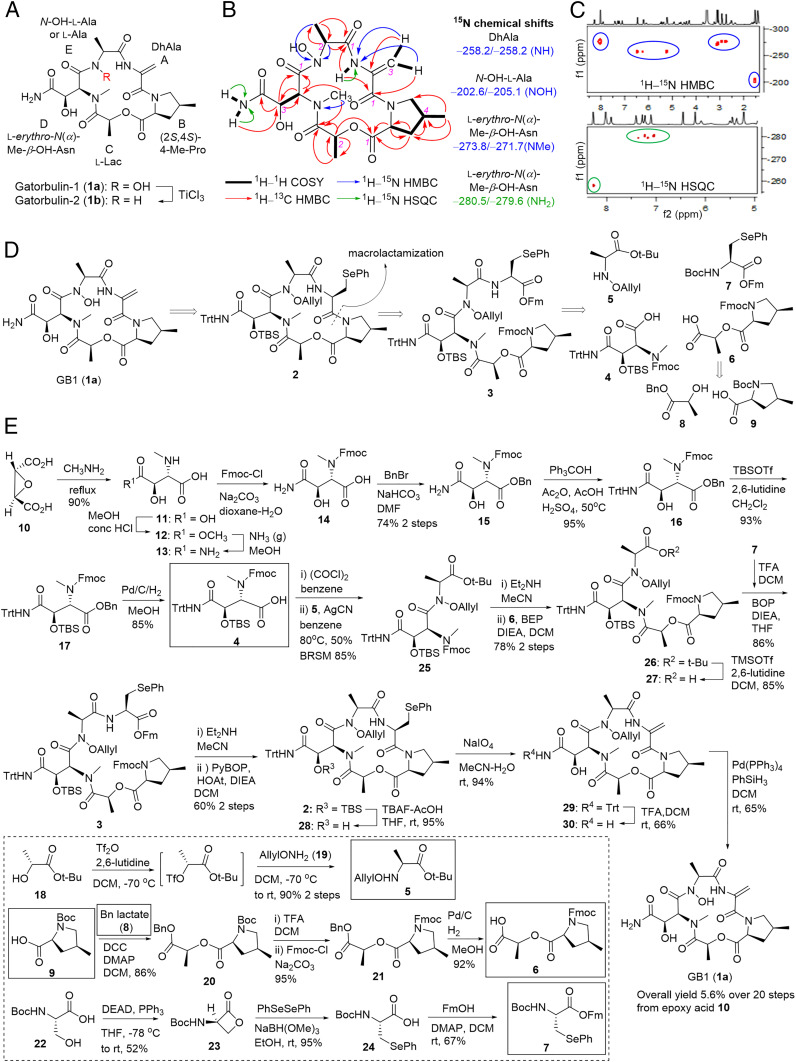
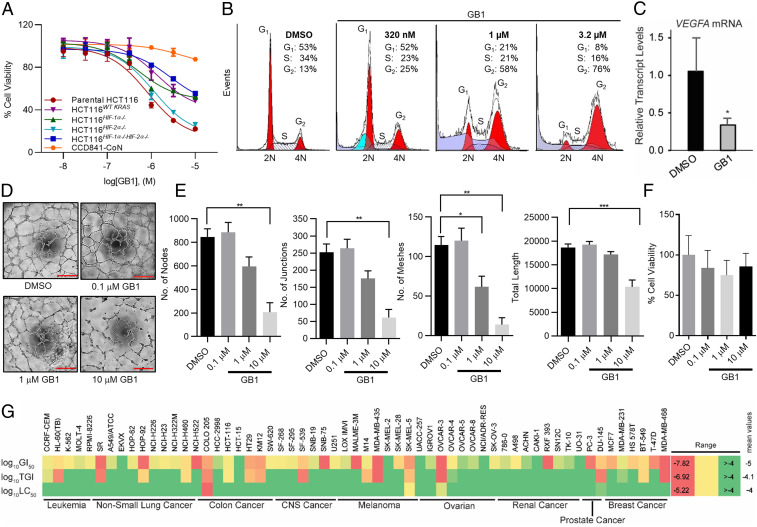
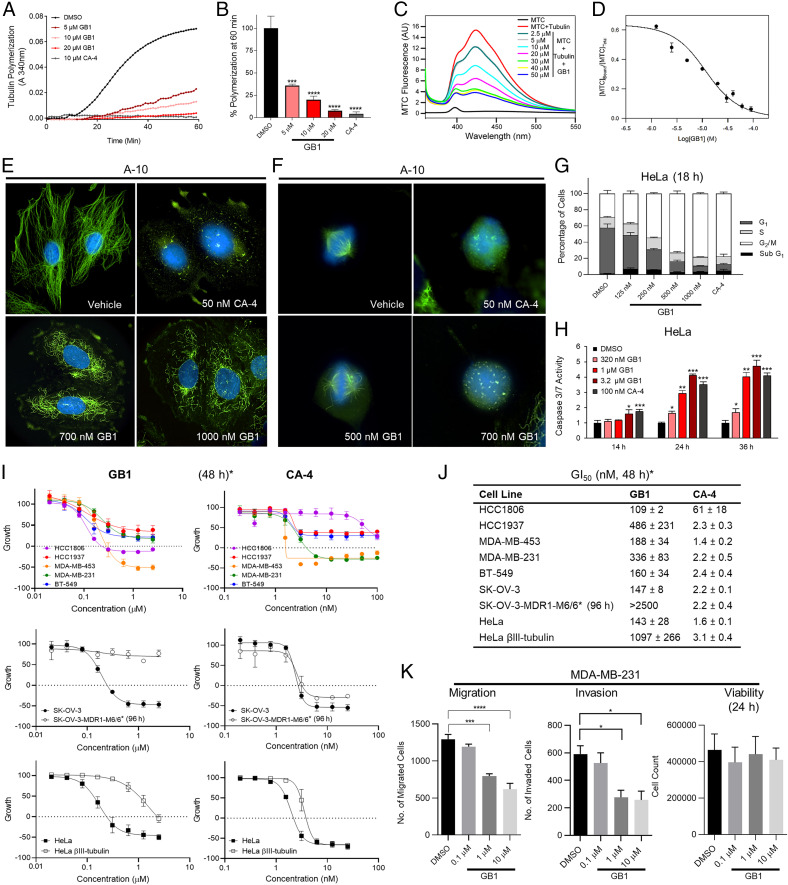
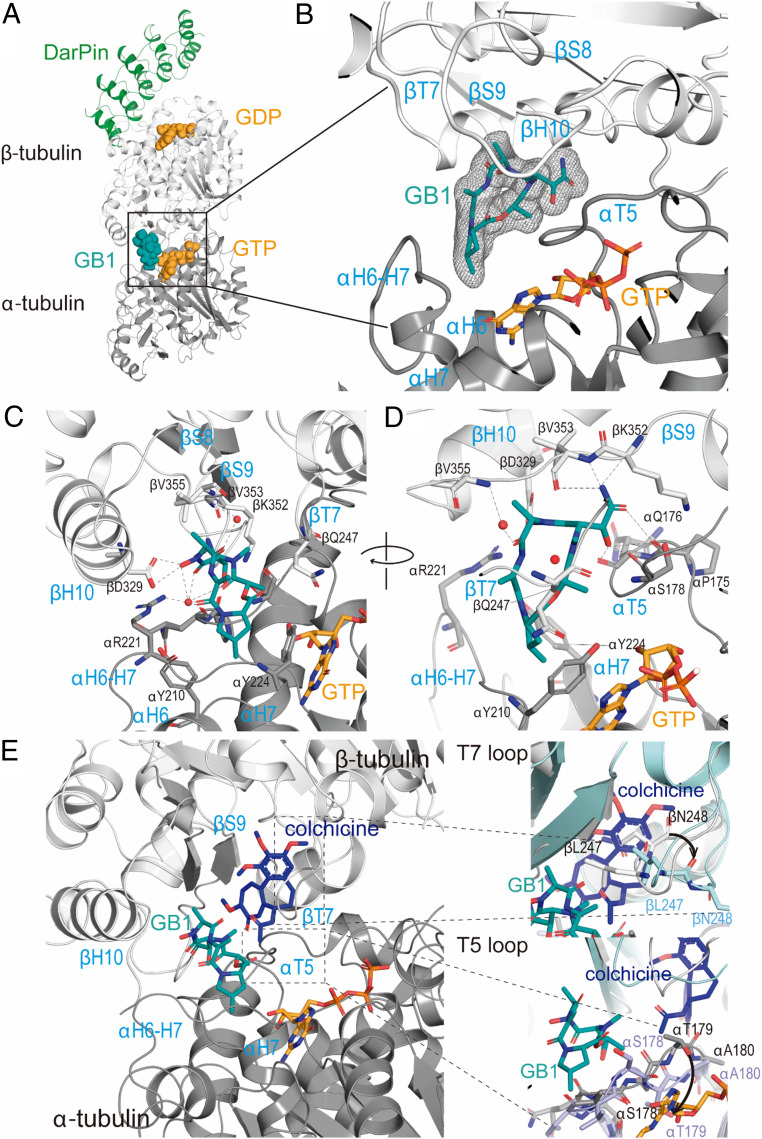
Tubulin-targeted chemotherapy has proven to be a successful and wide spectrum strategy against solid and liquid malignancies. Therefore, new ways to modulate this essential protein could lead to new antitumoral pharmacological approaches. Currently known tubulin agents bind to six distinct sites at α/β-tubulin either promoting microtubule stabilization or depolymerization. We have discovered a seventh binding site at the tubulin intradimer interface where a novel microtubule-destabilizing cyclodepsipeptide, termed gatorbulin-1 (GB1), binds. GB1 has a unique chemotype produced by a marine cyanobacterium. We have elucidated this dual, chemical and mechanistic, novelty through multidimensional characterization, starting with bioactivity-guided natural product isolation and multinuclei NMR-based structure determination, revealing the modified pentapeptide with a functionally critical hydroxamate group; and validation by total synthesis. We have investigated the pharmacology using isogenic cancer cell screening, cellular profiling, and complementary phenotypic assays, and unveiled the underlying molecular mechanism by in vitro biochemical studies and high-resolution structural determination of the α/β-tubulin-GB1 complex.

Keywords: cyanobacteria; marine natural product; microtubules; total synthesis; tubulin.


Conflict of interest statement

Competing interest statement: The University of Florida has filed a patent application relating to the content of this article.

Figures

Fig. 1.
Fig. 1.
Binding sites and structures of microtubule-targeting agents. (A) Tubulin heterodimer (α-tubulin in gray and β-tubulin in white) in ribbon representation, where six known binding sites have been highlighted showing representative ligands in sphere representation: maytansine (PDB ID code 4tv8, violet); epothilone (PDB ID code 4o4i, orange); peloruside (PBD ID code 4o4j, red); colchicine (PDB ID code 4o2b, dark blue); pironetin (PDB ID code 5fnv, cyan), and vinblastine (PDB ID code 4eb6, light blue). The gatorbulin binding site has been also included (PDB ID code 7alr, teal). (B and C) Representative compounds targeting tubulin binding sites. (B) Microtubule-stabilizing agents. (C) Microtubule-destabilizing agents, including the structure of GB1 (1a).
Fig. 2.
Fig. 2.
Structure determination and total synthesis of GB1. (A) Structures of the isolated natural products, GB1 (1a) and its N-deoxy derivative, GB2 (1b). GB1 units are labeled A–E. (B) Homonuclear and heteronuclear 2D NMR correlations for GB1. (C) Selected regions of the 1H–15N HMBC and 1H–15N HSQC spectra of GB1. (D) Retrosynthetic analysis for the total synthesis of GB1 (1a). (E) Forward synthetic route. Longest linear sequence is shown in the main scheme. Building blocks 4 to 9 from the retrosynthesis (in D) are indicated by boxes with solid lines. The synthesis of the building blocks 5 to 7 is provided in the box with the dashed line.
Fig. 3.
Fig. 3.
Mechanism of action of GB1 through cellular profiling. (A) Antiproliferative activity of GB1 in parental HCT116 colon cells, isogenic HCT116 knockout cells, and CCD-841CoN normal epithelial colon cells (48 h treatment). GB1 showed a marginal effect on the viability of CCD-841CoN normal epithelial colon cells (0.5% DMSO vehicle). Parental HCT116 cells and HCT116HIF-2α−/− were most susceptible, while the potency and efficacy of GB1 were reduced against HCT116HIF-1α−/−HIF-2α−/−, HCT116HIF-1α−/−,, and oncogenic KRAS knockout (HCT116WT KRAS). Cell viability was measured by MTT assay (n = 3). Data are represented as average ± SD. (B) Cell cycle analysis. HCT116 cells were treated with GB1 (320 nM, 1 µM, or 3.2 µM) or vehicle control (0.25% DMSO) for 24 h, and DNA content was assessed by flow cytometry of propidium iodide stained cells. GB1 induced G2/M accumulation. (C) HIF target gene (VEGFA) expression after 16-h exposure of parental HCT116 cells to GB1 (3.2 µM) or vehicle (0.25% DMSO). RNA was isolated, reverse transcribed, and subjected to qPCR using TaqMan analysis. β-actin served as endogenous control. Error bars indicate mean ± SD of three replicates (Student t test, *P < 0.05). (DF) GB1 inhibits HUVEC tube formation in vitro without toxicity. (D) Representative images of HUVEC tube formation in growth factor-reduced Matrigel upon treatment with DMSO (0.1%) or varying concentrations (10 μM, 1 μM, or 0.1 μM) of GB1 (9 h). (Scale bar: 200 μm.) All images shown are representative, and data are represented as mean ± SEM; one-way ANOVA followed by Tukey's multiple comparisons test; *P < 0.05, **P < 0.01, and ***P < 0.001. (E) Quantification of number of nodes, number of junctions, number of meshes, and total length of tubes (n = 3). (F) GB1 does not affect HUVEC cell viability. HUVEC cell viability was quantified by absorbance at 490 nm using (3-(4,5-dimethylthiazol-2-yl)-5-(3-carboxymethoxyphenyl)-2-(4-sulfophenyl)-2H-tetrazolium, inner salt) (MTS assay, 24 h). GB1 treatment did not affect total number of viable HUVEC cells compared to DMSO-treated control (n = 3). For E and F, data are represented as mean ± SEM; one-way ANOVA followed by Tukey’s multiple comparisons test. (G) Heatmap for the performance of GB1 across cell lines in the NCI-60 screen using three different values (growth-inhibitory effect, GI50; cytostatic effect, TGI; cytotoxic effect, LC50; concentration in molars).
Fig. 4.
Fig. 4.
Target identification and selectivity profiling of GB1 in comparison with combretastatin A-4 (CA-4). (A and B) Inhibition of tubulin polymerization by GB1. (A) Time course of tubulin polymerization (20 μM) (vehicle: DMSO; 1%). (B) Quantification of tubulin polymerization at 60 min. (C and D) Displacement of MTC. (C) Fluorescence emission spectra of 10 μM MTC in the absence (black line) and the presence (red line) of 10 μM tubulin plus varying concentrations of GB1 (vehicle: DMSO; 1%). (D) Displacement isotherm at 25 °C of MTC by GB1. Line is best fit of the GB1 equilibrium constant, assuming 0.8 sites per tubulin dimer. (E) Microtubule depolymerization GB1 in interphase cells. A-10 cells treated for 18 h (vehicle: DMSO; 0.1%). (Magnification: 1,000×.) (F) GB1 promotes formation of aberrant mitotic spindles in A-10 cells (18 h treatment). (G) GB1 arrest cell cycle in G2/M phase. Cell cycle distribution of HeLa cells in the presence of GB1 (vehicle: DMSO; 0.1%) (H) GB1 causes apoptosis in HeLa cells as measured by Caspase-3/7 activity (vehicle: DMSO; 0.5%). (I and J) Antiproliferative and cytotoxic effects of GB1 and CA-4 in a panel of TNBC cell lines, in parental and Pgp-expressing SK-OV-3 cells, or in parental and βIII-expressing HeLa cells (sulforhodamine B assay, vehicle: DMSO; 0.5%). Asterisk denotes that treatment time was 48 h, except for SK-OV-3-MDR1-M6/6 (96 h). (K) Effects of GB1 on transwell migration and invasion of serum-starved MDA-MB-231 breast cancer cells pretreated with GB1 for 24 h. Pretreated cells were allowed to migrate or invade for 5 h. Quantitative analysis of migrated or invaded cells across a Matrigel layer (vehicle: DMSO; 0.1%). Cell count (24 h) was determined by Trypan Blue exclusion assay. (A, C, E, and F) Representative set from three experiments shown. (B and GK) Error bars represent ± SEM (B, G, and IK) or SD (H) from three independent experiments. (B) One-way ANOVA with Dunnett’s post hoc test; ***P < 0.001, ****P < 0.0001. (D and K) n = 3. (E and F) Microtubules visualized using a β-tubulin antibody (green) and DNA was visualized using DAPI (blue). (H) Two-tailed Student t test; *P < 0.05, **P < 0.01, ***P < 0.005. (K) One-way ANOVA followed by Tukey’s multiple comparisons test; *P < 0.05, ***P < 0.001, ****P < 0.0001.
Fig. 5.
Fig. 5.
Crystal structure of TD1−GB1 complex. (A) Overall view of the TD1−GB1 complex (PDB ID code 7alr). Tubulin (α-tubulin in gray and β-tubulin in light gray) and DarPin (green) are in ribbon, and tubulin-bound nucleotides (orange) and the ligand GB1 (teal) are in sphere representation. (B) Zoom into the composite GB1 site. Simulated annealing omit map of GB1 in the corresponding TD1 complex structure. The mFo-DFc electron density map (gray mesh) is contoured at 3.0σ. The GB1 molecule is shown in stick representation and α- and β-tubulin in ribbon. Secondary structural elements involved in protein–compound interactions are depicted in blue. (C and D) Close-up view of the interaction observed between GB1 (teal, sticks) and tubulin (α-tubulin in gray and β-tubulin in light gray, ribbon). Interacting residues are shown in stick representation and are labeled. D is a rotated view of C. (E) Comparison of GB1 (teal) and colchicine (blue) binding sites, where tubulin is in ribbon, and ligands are in stick representation. Zoom-in panels show α-tubulin loop T5 and β-tubulin loop T7 conformational changes required for colchicine accommodation when compared with colchicine (PDB ID code 5nm5) and GB1 (PDB ID code 7alr) structures. Ligands are in stick representation (GB1, teal; colchicine, blue), and tubulin is in ribbon representation (PDB ID code 5nm5, blue; PDB ID code 7alr, gray). Main residues involved are in stick representation and labeled.

Similar articles

Cited by

References

    1. Risinger A. L., Du L., Targeting and extending the eukaryotic druggable genome with natural products: Cytoskeletal targets of natural products. Nat. Prod. Rep. 37, 634–652 (2020). - PMC - PubMed
    1. Luesch H., Moore R. E., Paul V. J., Mooberry S. L., Corbett T. H., Isolation of dolastatin 10 from the marine cyanobacterium Symploca species VP642 and total stereochemistry and biological evaluation of its analogue symplostatin 1. J. Nat. Prod. 64, 907–910 (2001). - PubMed
    1. Salvador-Reyes L. A., Engene N., Paul V. J., Luesch H., Targeted natural products discovery from marine cyanobacteria using combined phylogenetic and mass spectrometric evaluation. J. Nat. Prod. 78, 486–492 (2015). - PMC - PubMed
    1. Ratnayake R., et al. ., Dolastatin 15 from a marine cyanobacterium suppresses HIF-1α mediated cancer cell viability and vascularization. ChemBioChem 21, 2356–2366 (2020). - PMC - PubMed
    1. Bai R. L., Pettit G. R., Hamel E., Binding of dolastatin 10 to tubulin at a distinct site for peptide antimitotic agents near the exchangeable nucleotide and vinca alkaloid sites. J. Biol. Chem. 265, 17141–17149 (1990). - PubMed

Publication types

MeSH terms