

Chr20q Amplification Defines a Distinct Molecular Subtype of Microsatellite Stable Colorectal Cancer
- PMID: 33619118
- PMCID: PMC8137593
- DOI: 10.1158/0008-5472.CAN-20-4009
Chr20q Amplification Defines a Distinct Molecular Subtype of Microsatellite Stable Colorectal Cancer
Abstract
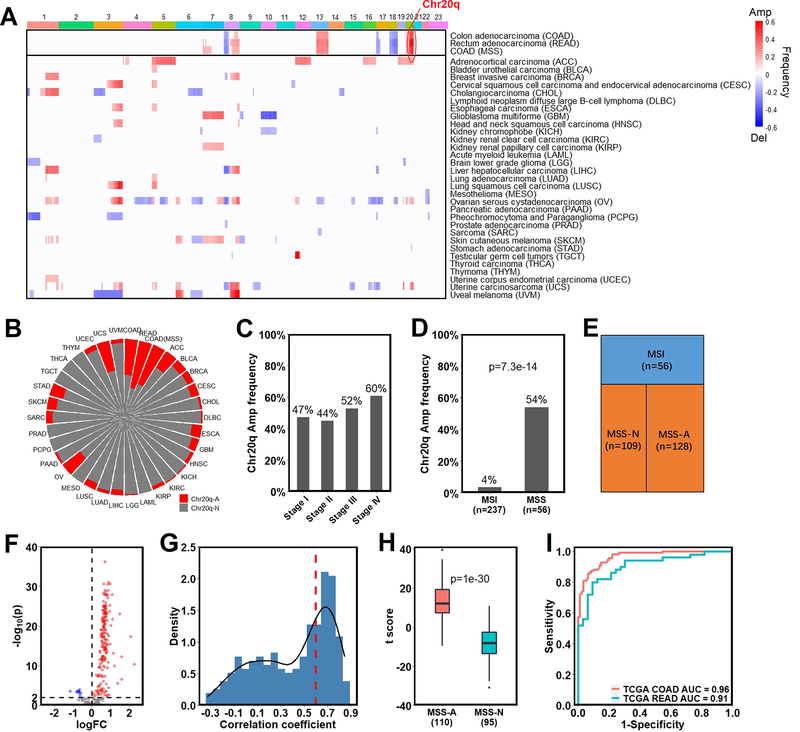
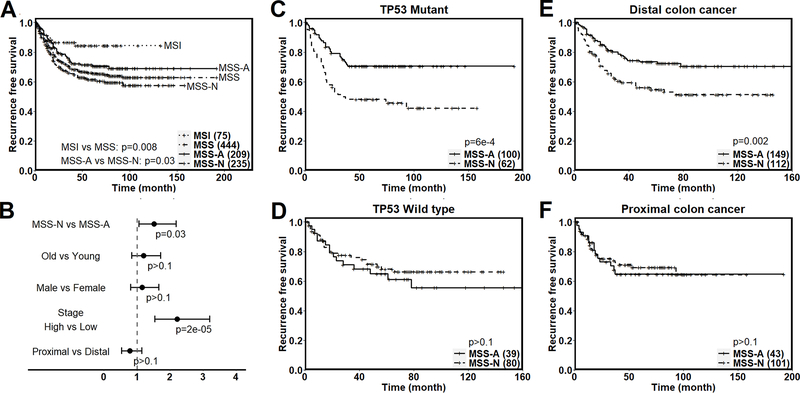
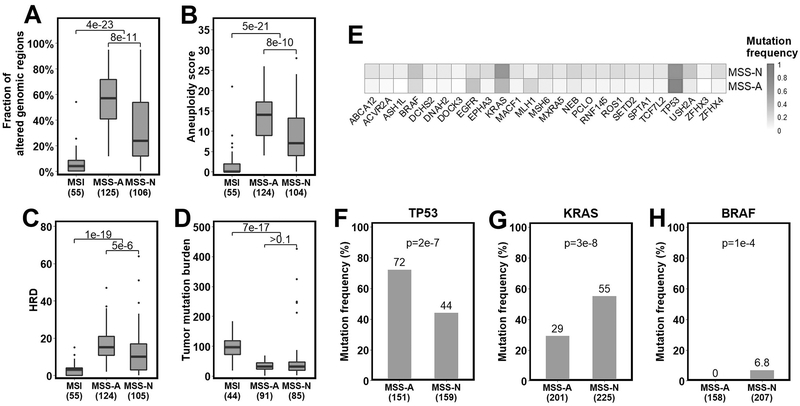
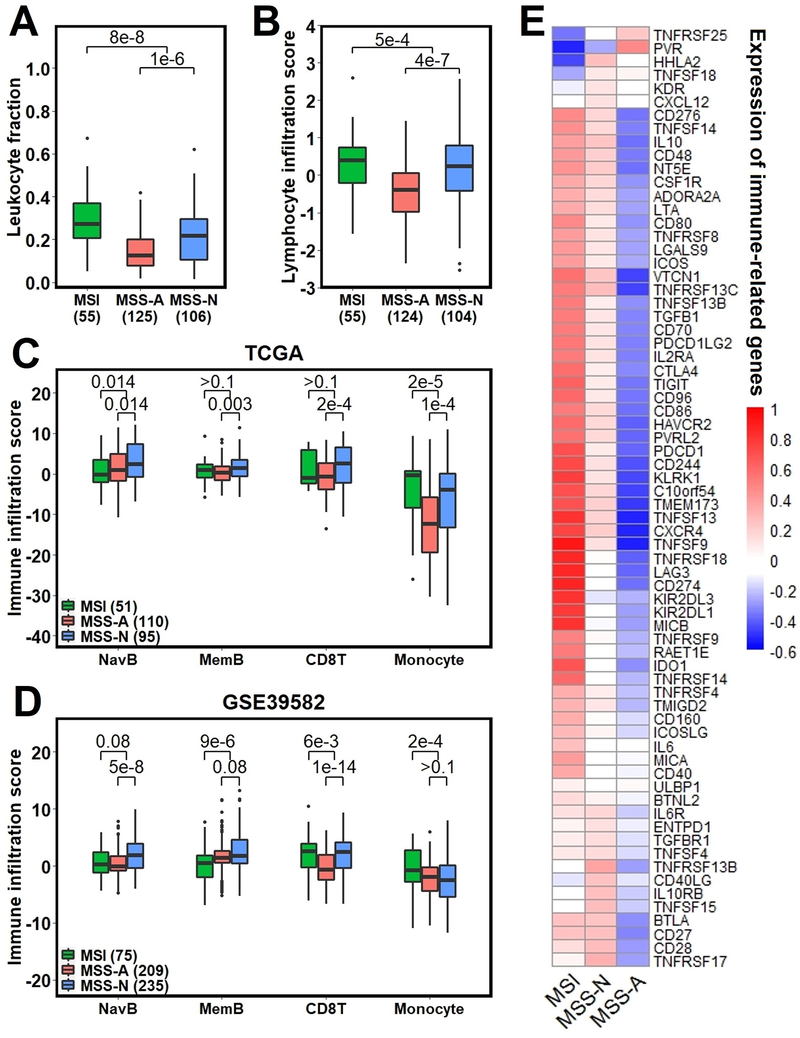
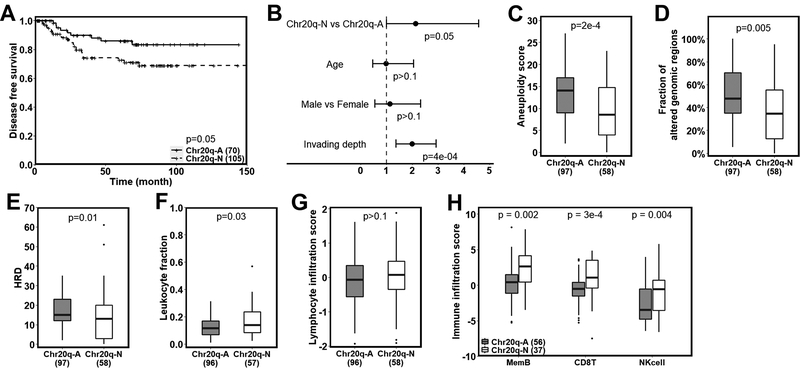
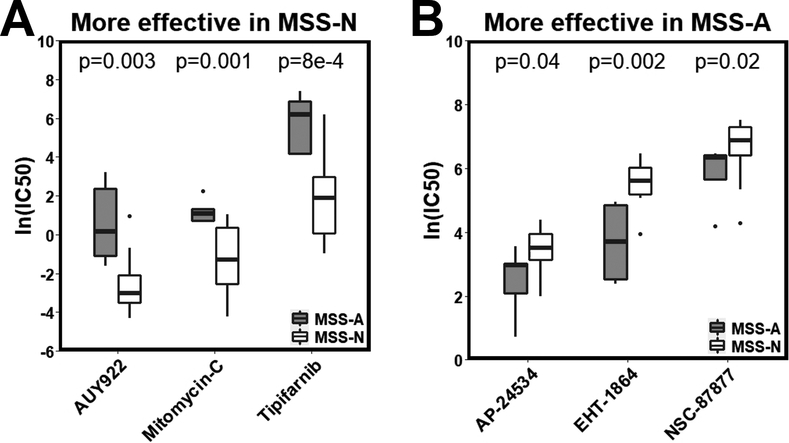
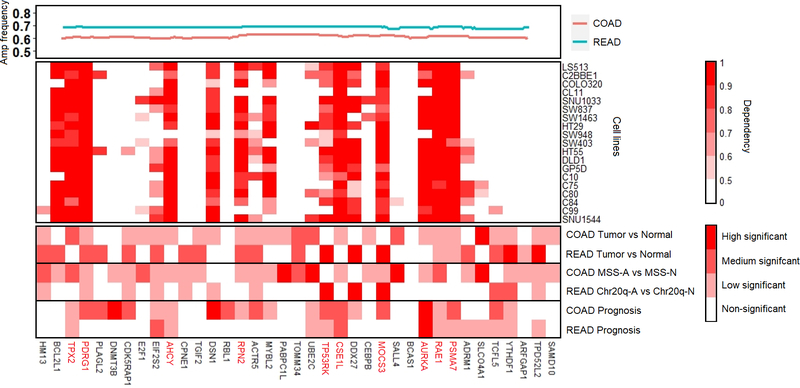
Colorectal cancer is the third leading cause of cancer-related death in the United States. About 15% of colorectal cancers are associated with microsatellite instability (MSI) due to loss of function in the DNA mismatch repair pathway. This subgroup of patients has better survival rates and is more sensitive to immunotherapy. However, it remains unclear whether microsatellite stable (MSS) patients with colorectal cancer can be further stratified into subgroups with differential clinical characteristics. In this study, we analyzed The Cancer Genome Atlas data and found that Chr20q amplification is the most frequent copy number alteration that occurs specifically in colon (46%) and rectum (61%) cancer and is mutually exclusive with MSI. Importantly, MSS patients with Chr20q amplification (MSS-A) were associated with better recurrence-free survival compared with MSS patients without Chr20q amplification (MSS-N; P = 0.03). MSS-A tumors were associated with high level of chromosome instability and low immune infiltrations. In addition, MSS-A and MSS-N tumors were associated with somatic mutations in different driver genes, with high frequencies of mutated TP53 in MSS-A and mutated KRAS and BRAF in MSS-N. Our results suggest that MSS-A and MSS-N represent two subtypes of MSS colorectal cancer, and such stratification may be used to improve therapeutic treatment in an individualized manner. SIGNIFICANCE: This study shows that chromosome 20q amplification occurs predominately in microsatellite-stable colorectal cancer and defines a distinct subtype with good prognosis, high chromosomal instability, distinct mutation profiles, and low immune infiltrations.
©2021 American Association for Cancer Research.
Conflict of interest statement
Figures
Similar articles
-
Microsatellite stable colorectal cancers stratified by the BRAF V600E mutation show distinct patterns of chromosomal instability.PLoS One. 2014 Mar 20;9(3):e91739. doi: 10.1371/journal.pone.0091739. eCollection 2014. PLoS One. 2014. PMID: 24651849 Free PMC article.
-
p53 mutation is common in microsatellite stable, BRAF mutant colorectal cancers.Int J Cancer. 2012 Apr 1;130(7):1567-76. doi: 10.1002/ijc.26175. Epub 2011 Aug 3. Int J Cancer. 2012. PMID: 21557216
-
Wild-type APC predicts poor prognosis in microsatellite-stable proximal colon cancer.Br J Cancer. 2015 Sep 15;113(6):979-88. doi: 10.1038/bjc.2015.296. Epub 2015 Aug 25. Br J Cancer. 2015. PMID: 26305864 Free PMC article.
-
MSI status is associated with distinct clinicopathological features in BRAF mutation colorectal cancer: A systematic review and meta-analysis.Pathol Res Pract. 2020 Jan;216(1):152791. doi: 10.1016/j.prp.2019.152791. Epub 2019 Dec 17. Pathol Res Pract. 2020. PMID: 31866097
-
A Narrative Review of the Role of Immunotherapy in Metastatic Carcinoma of the Colon Harboring a BRAF Mutation.In Vivo. 2025 Jan-Feb;39(1):25-36. doi: 10.21873/invivo.13802. In Vivo. 2025. PMID: 39740863 Free PMC article. Review.
Cited by
-
Circular RNA circPHLPP2 promotes tumor growth and anti-PD-1 resistance through binding ILF3 to regulate IL36γ transcription in colorectal cancer.Mol Cancer. 2024 Dec 18;23(1):272. doi: 10.1186/s12943-024-02192-8. Mol Cancer. 2024. PMID: 39695693 Free PMC article.
-
Molecular subtypes of colorectal cancer in the era of precision oncotherapy: Current inspirations and future challenges.Cancer Med. 2024 Jul;13(14):e70041. doi: 10.1002/cam4.70041. Cancer Med. 2024. PMID: 39054866 Free PMC article. Review.
-
Single-cell and bulk transcriptome sequencing identifies two epithelial tumor cell states and refines the consensus molecular classification of colorectal cancer.Nat Genet. 2022 Jul;54(7):963-975. doi: 10.1038/s41588-022-01100-4. Epub 2022 Jun 30. Nat Genet. 2022. PMID: 35773407 Free PMC article.
-
Exploration of ANKRD27 as an immune-related prognostic factor in pan-cancer and hepatocellular carcinoma.Front Oncol. 2025 Jan 6;14:1511240. doi: 10.3389/fonc.2024.1511240. eCollection 2024. Front Oncol. 2025. PMID: 39834932 Free PMC article.
-
Multiregional transcriptomic profiling provides improved prognostic insight in localized non-small cell lung cancer.NPJ Precis Oncol. 2024 Oct 5;8(1):225. doi: 10.1038/s41698-024-00680-0. NPJ Precis Oncol. 2024. PMID: 39369068 Free PMC article.
References
-
- Baretti M, Le DT. DNA mismatch repair in cancer. Pharmacol Ther. 2018;189:45–62. - PubMed
Publication types
MeSH terms
Substances
Grants and funding
LinkOut - more resources
Full Text Sources
Other Literature Sources
Research Materials
Miscellaneous
