. 2021 Jun;80(6):788-795.
doi: 10.1136/annrheumdis-2020-219137. Epub 2021 Feb 22.

Systematic evaluation of nine monogenic autoinflammatory diseases reveals common and disease-specific correlations with allergy-associated features

Affiliations

Systematic evaluation of nine monogenic autoinflammatory diseases reveals common and disease-specific correlations with allergy-associated features

Daniella Muallem Schwartz et al. Ann Rheum Dis. 2021 Jun.

Abstract

Background: Monogenic autoinflammatory diseases (AID) are caused by mutations in innate immune genes. The effects of these mutations on allergic inflammation are unknown.

Objectives: We investigated allergic, immunological and clinical phenotypes in FMF (familial Mediterranean fever), CAPS (cryopyrin-associated periodic syndrome), TRAPS (tumour necrosis factor receptor-associated periodic syndrome), HIDS (hyper-IgD syndrome), PAPA (pyogenic arthritis, pyoderma gangrenosum and acne), DADA2 (deficiency of adenosine deaminase 2), HA20 (haploinsufficiency of A20), CANDLE (chronic atypical neutrophilic dermatosis, lipodystrophy, elevated temperature) and SAVI (STING-associated vasculopathy of infancy).

Methods: In this cross-sectional study, clinical data were assessed in 425 patients with AID using questionnaires and chart reviews. Comparator data were obtained from public databases. Peripheral blood mononuclear cells obtained from 55 patients were stimulated and CD4+ cytokine production assessed.

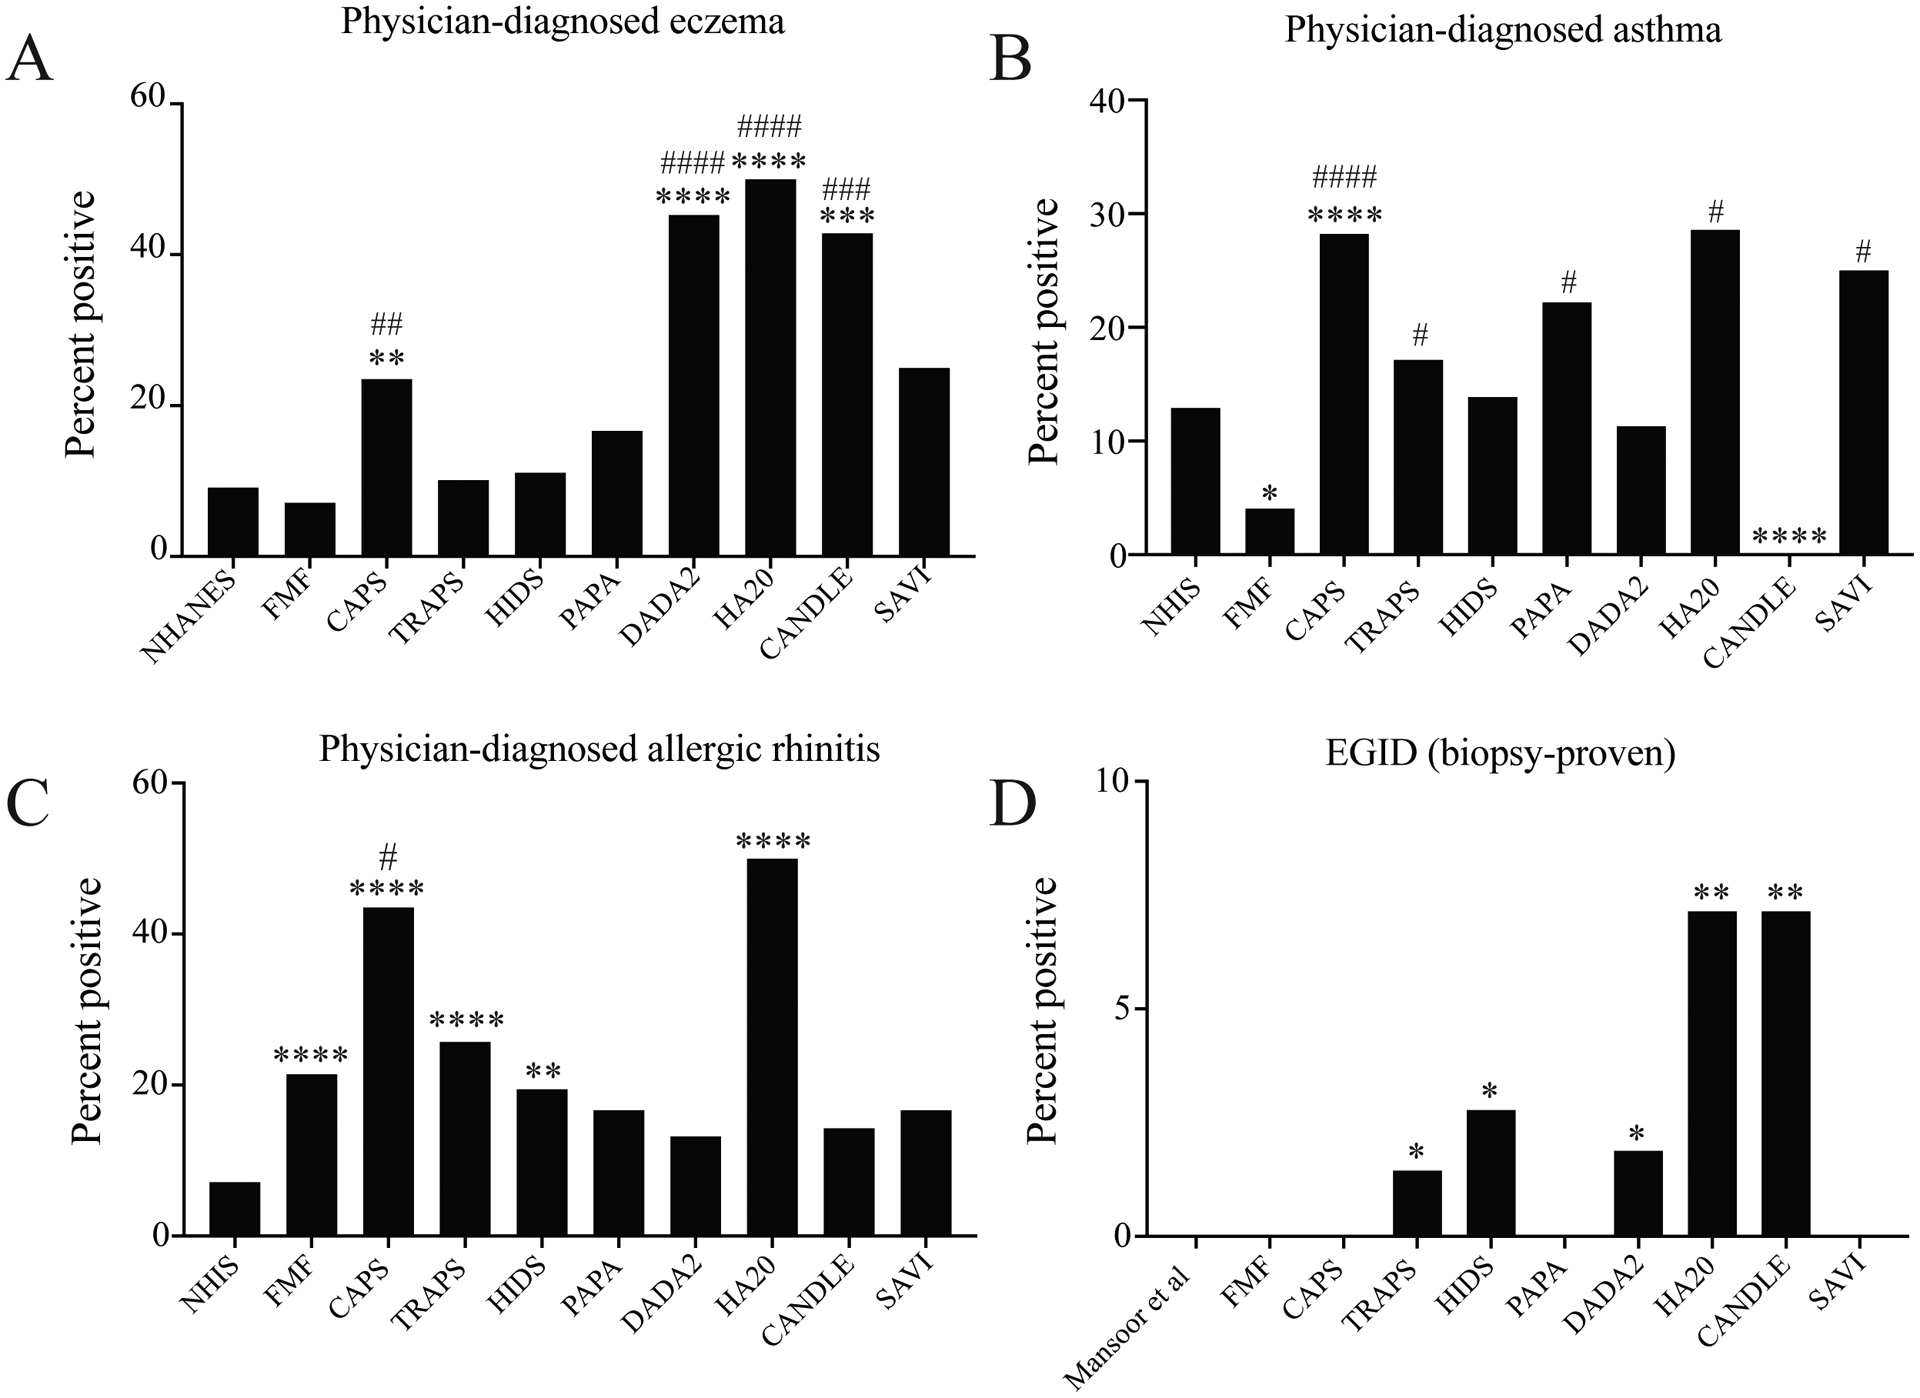
Results: Clinical laboratory features of Type 2 immunity were elevated in CAPS but reduced in most AID, particularly DADA2. Physician-diagnosed allergic diseases were prevalent in multiple AID, including CAPS and DADA2. T helper 2 (Th2) cells were expanded in CAPS, TRAPS and HIDS; Th9 cells were expanded in HA20.

Conclusions: CAPS is characterised by an enhanced Type 2 signature, whereas FMF and CANDLE are associated with reduced Type 2 responses. DADA2 is associated with reduced Type 2 responses but a high rate of physician-diagnosed allergy. Therefore, NLRP3-driven autoinflammation may promote Type 2 immunity, whereas AID like DADA2 may manifest clinical phenotypes that masquerade as allergic disorders. Further investigations are needed to determine the contribution of autoinflammation to allergic clinical and immunological phenotypes, to improve the treatment of patients with AID.

Keywords: T-lymphocyte subsets; cryopyrin-associated periodic syndromes; epidemiology; familial mediterranean fever; inflammation.


Conflict of interest statement

Competing interests: None declared.

Figures

Figure 1.
Figure 1.. Serum IgE levels in the general US population and in nine monogenic autoinflammatory diseases (AID).
Data are shown for the general US population, FMF, CAPS, TRAPS, HIDS, PAPA, DADA2, HA20, CANDLE, and SAVI. A. Bar graph shows percentage of patients with a peak serum IgE>100 kU/L B. Violin plot shows serum IgE levels for each population. C-D. Scatterplots show serum IgE (kU/L) vs. age for HIDS (C) and DADA2 (D) cohorts. The geometric mean serum IgE for the general US population, with 95% confidence interval, is shown in black. *p<0.05 vs. general US population; Benjamini-Hochberg adjusted Mann-Whitney.
Figure 2.
Figure 2.. Eosinophilia and absolute eosinophil counts (AEC) in the general US population and in nine monogenic autoinflammatory diseases (AID).
Data are shown for the general US population, FMF, CAPS, TRAPS, HIDS, PAPA, DADA2, HA20, CANDLE, and SAVI. A. Violin plot shows mean AEC for each population. B-C. Bar graphs show percentage of patients with eosinophilia (peak AEC > 500, B) and hypereosinophilia (peak AEC > 1500, C). D. Volcano plot shows correlation (R, Pearson) vs. p-value (Pearson) of AEC vs. erythrocyte sedimentation rate (ESR, mm/h) for each AID patient with eosinophilia (AEC > 500). Colors of dots indicate specific AID (FMF, green; CAPS, dark blue; TRAPS, purple; HIDS, fuchsia; PAPA, teal; DADA2, orange; HA20, red; CANDLE, yellow). Size of dots distinguishes patients with eosinophilia (AEC > 500) from those with hypereosinophilia (AEC > 1500). E-F. Representative plots for one CAPS patient with hypereosinophilia: dot plot of AEC and ESR values over a period of 8 years (E) and correlation plot of AEC vs. ESR (F). *p<0.05, **p<0.01, ***p<0.005, ****p<0.001 vs. general US population. #p<0.05, ##p<0.01, ###p<0.005, ###p<0.001 vs. FMF; Benjamini-Hochberg adjusted Mann-Whitney (A) or Benjamini-Hochberg adjusted Fisher t-test (B-C).
Figure 3.
Figure 3.. Common and Disease-specific prevalence of physician-diagnosed allergy-associated diseases in nine monogenic autoinflammatory diseases (AID).
Data are shown for the general US population, FMF, CAPS, TRAPS, HIDS, PAPA, DADA2, HA20, CANDLE, and SAVI. Bar graphs show percentage of patients reporting physician-diagnosed eczema (A), asthma (B), or allergic rhinitis (C); or percentage of patients with a biopsy-proven diagnosis of eosinophilic gastrointestinal disease (EGID) (D) *p<0.05, **p<0.01, ***p<0.005, ****p<0.001 vs. general US population. #p<0.05, ##p<0.01, ###p<0.005, ###p<0.001 vs. FMF; Benjamini-Hochberg adjusted Fisher t-test.
Figure 4.
Figure 4.. T helper immunophenotypes in seven monogenic autoinflammatory diseases (AID).
Data are shown for healthy volunteers (HV), atopic dermatitis patients (AD), FMF, CAPS, TRAPS, HIDS, PAPA, DADA2, and HA20. Violin plots show percentage of memory T helper cells (CD3+CD4+CD8CD45RO+) producing IL-17A (A), IFN-γ (B) IL-9 (C), IL-13 (D), IL-4 (E), and IL-5 (F). *p<0.05, **p<0.01, ***p<0.005, ****p<0.001 vs. HC. #p<0.05, ##p<0.01, ###p<0.005, ###p<0.001 vs. FMF; Benjamini-Hochberg adjusted Mann-Whitney

References

    1. Investigators N. Demographics, Laboratory, and Questionnaire Data. National Health and Nutrition Examination Survey. National Center for Health Statistics, 2005–2006.
    1. Investigators N. Tables of Summary Health Statistics for public use. National Health Interview Survey. National Center for Health Statistics, 2015–2018.
    1. Gupta RS, Kim JS, Springston EE, et al. Development of the Chicago Food Allergy Research Surveys: assessing knowledge, attitudes, and beliefs of parents, physicians, and the general public. BMC Health Serv Res 2009;9:142. doi: 10.1186/1472-6963-9-142 [published Online First: 2009/08/12] - DOI - PMC - PubMed
    1. Asher MI, Weiland SK. The International Study of Asthma and Allergies in Childhood (ISAAC). ISAAC Steering Committee. Clin Exp Allergy 1998;28 Suppl 5:52–66; discussion 90–1. doi: 10.1046/j.1365-2222.1998.028s5052.x [published Online First: 1999/02/13] - DOI - PubMed
    1. Gause WC, Rothlin C, Loke P. Heterogeneity in the initiation, development and function of type 2 immunity. Nat Rev Immunol 2020. doi: 10.1038/s41577-020-0301-x [published Online First: 2020/05/06] - DOI - PMC - PubMed

Publication types

MeSH terms

Substances