. 2021 May 1;27(9):2533-2548.
doi: 10.1158/1078-0432.CCR-20-3872. Epub 2021 Feb 22.

Cell Type-specific Adaptive Signaling Responses to KRASG12C Inhibition

Affiliations

Cell Type-specific Adaptive Signaling Responses to KRASG12C Inhibition

Hitendra S Solanki et al. Clin Cancer Res. .

Abstract

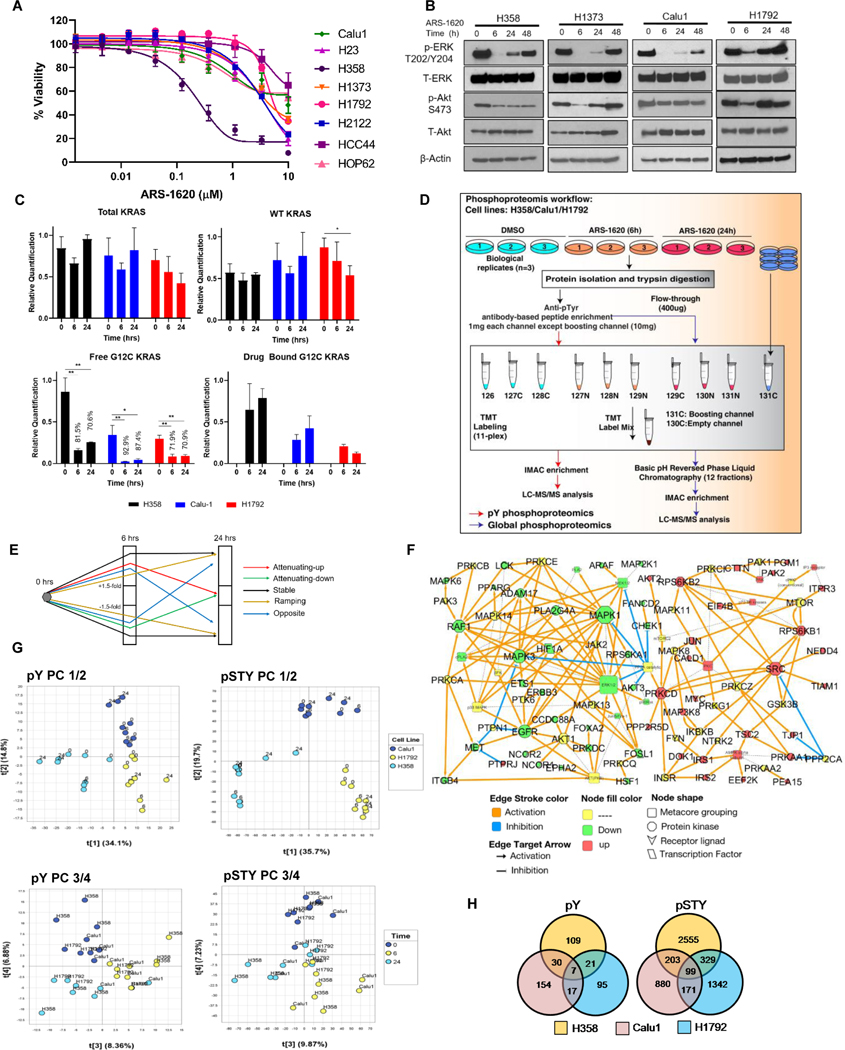
Purpose: Covalent inhibitors of KRASG12C specifically target tumors driven by this form of mutant KRAS, yet early studies show that bypass signaling drives adaptive resistance. Although several combination strategies have been shown to improve efficacy of KRASG12C inhibitors (KRASi), underlying mechanisms and predictive strategies for patient enrichment are less clear.

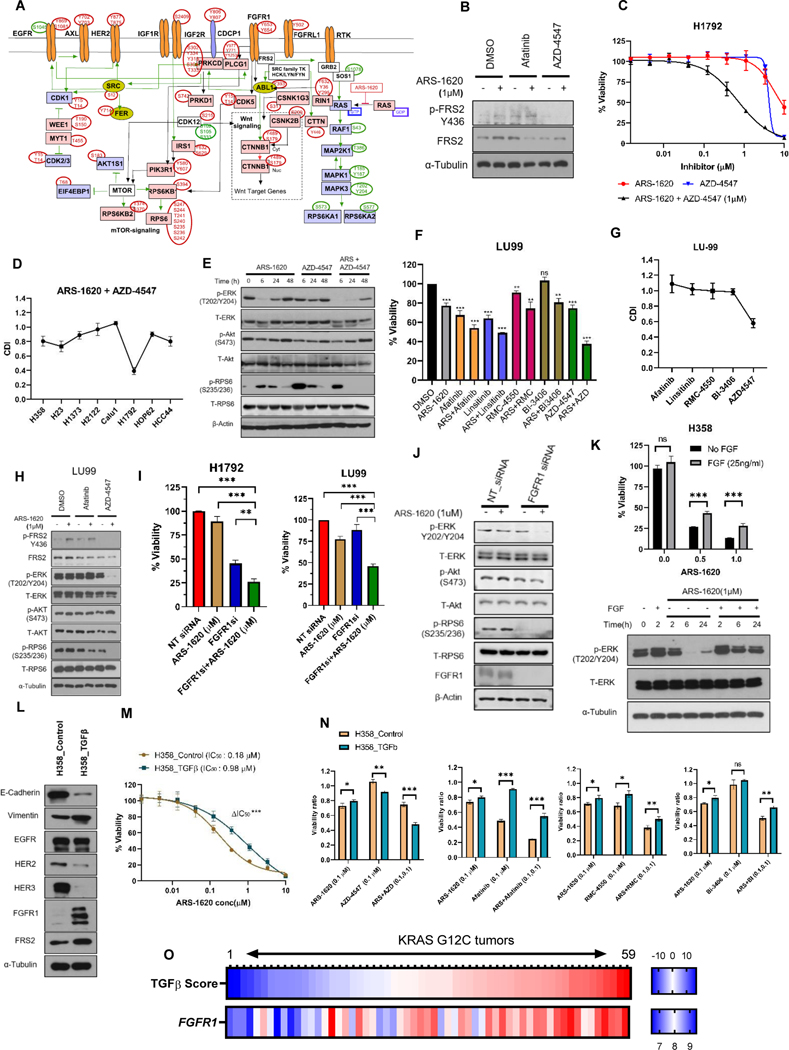
Experimental design: We performed mass spectrometry-based phosphoproteomics analysis in KRASG12C cell lines after short-term treatment with ARS-1620. To understand signaling diversity and cell type-specific markers, we compared proteome and phosphoproteomes of KRASG12C cells. Gene expression patterns of KRASG12C cell lines and lung tumor tissues were examined.

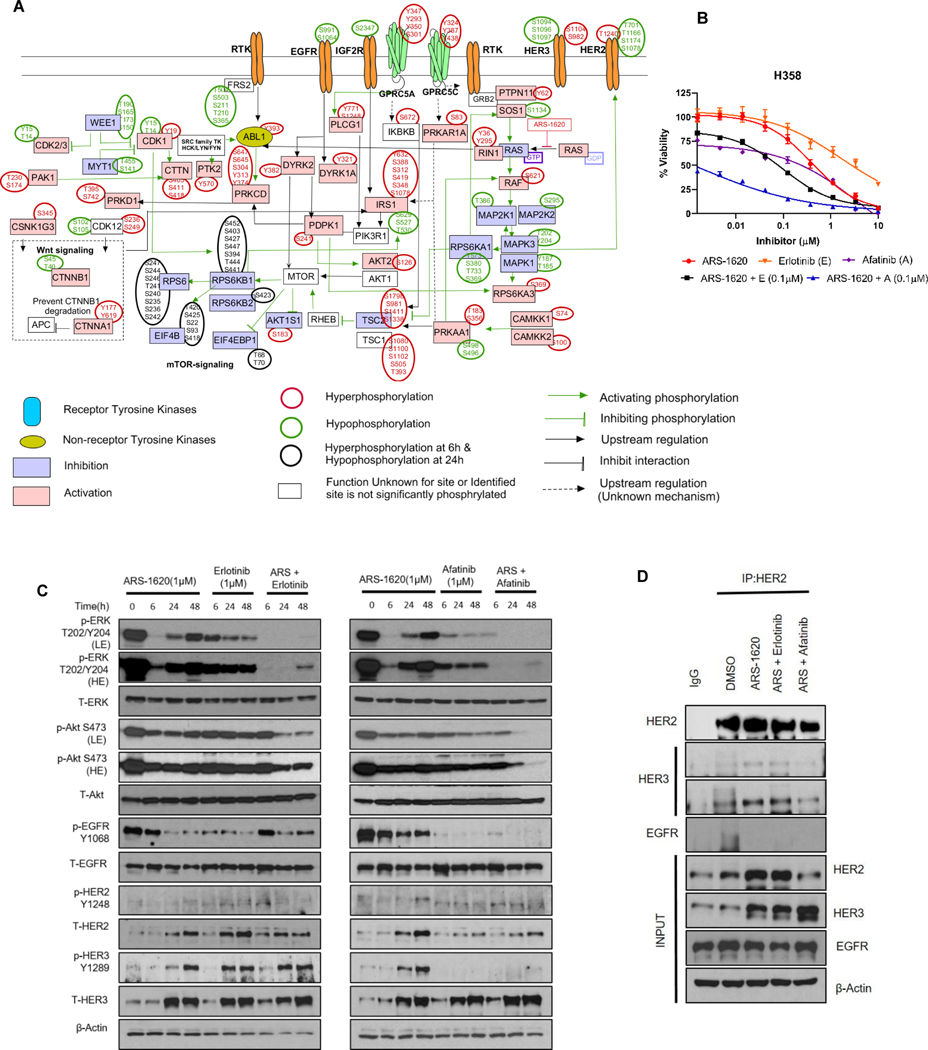
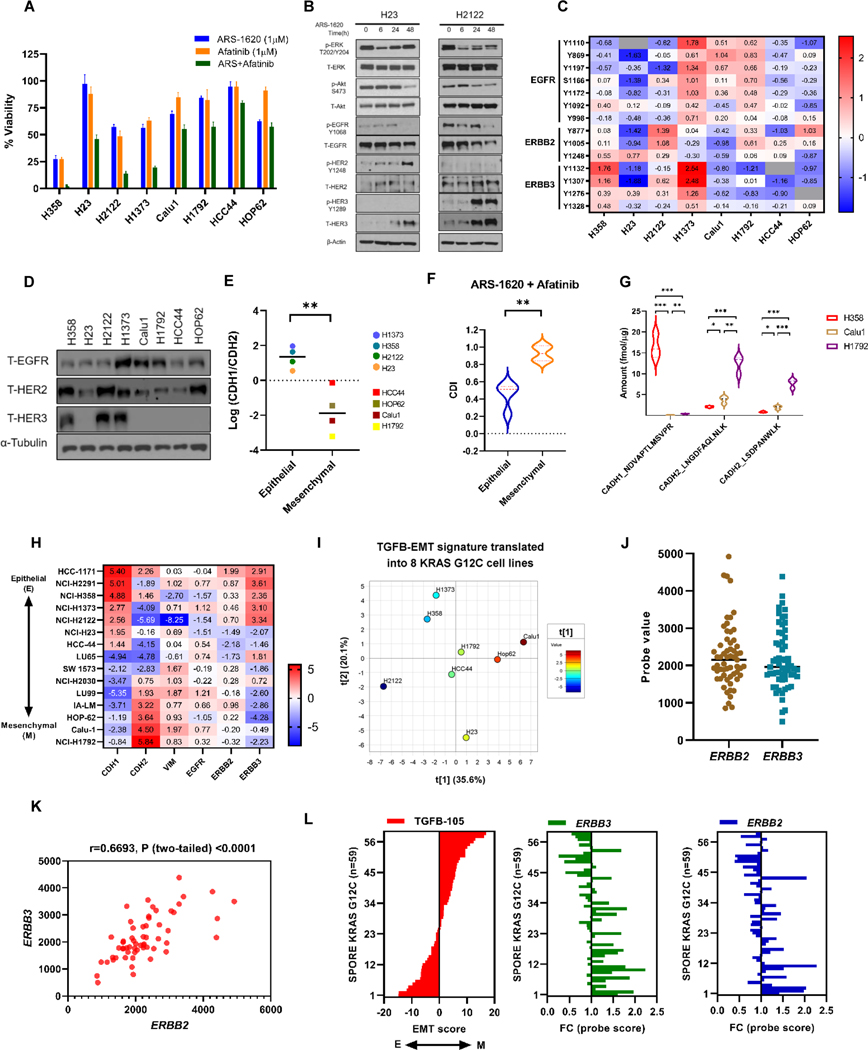
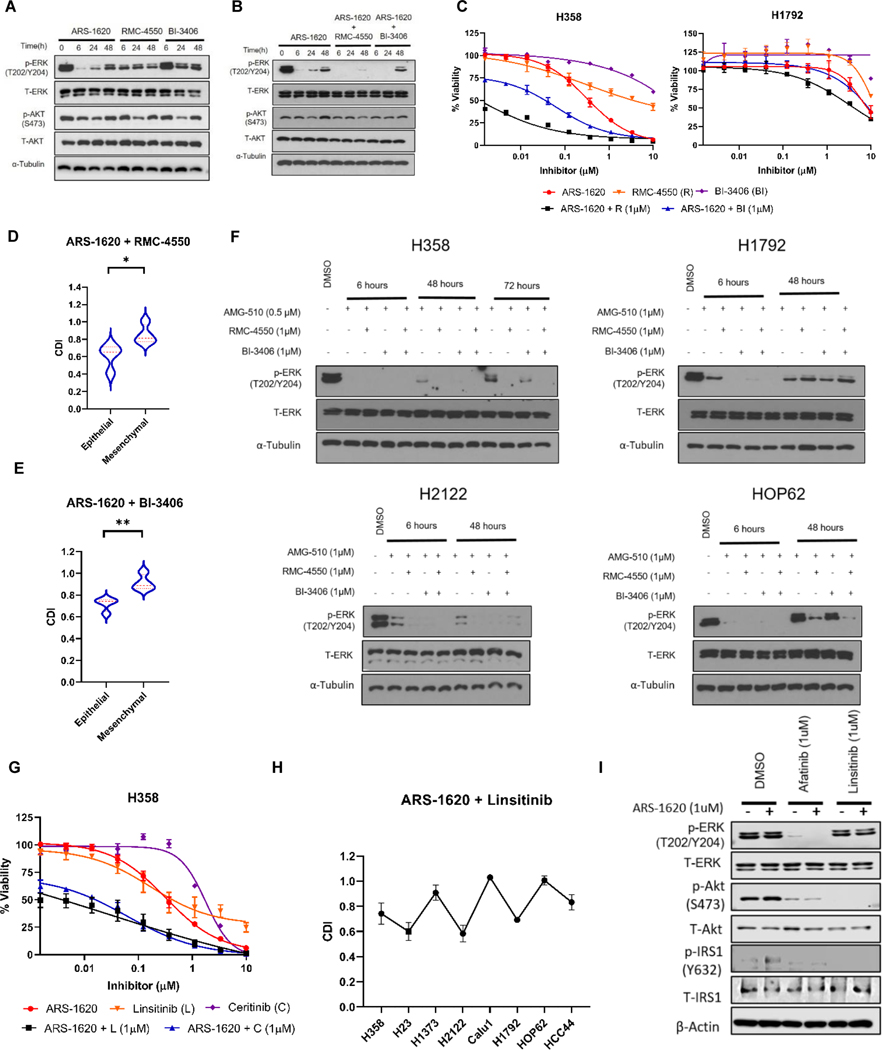
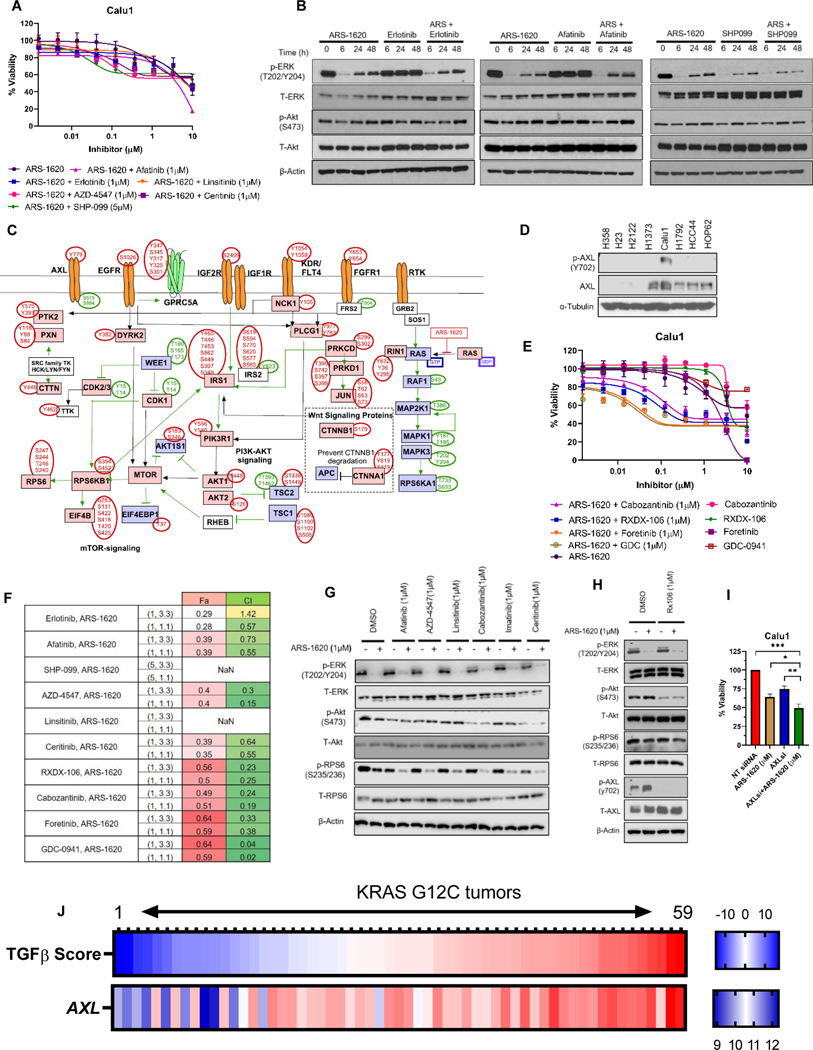
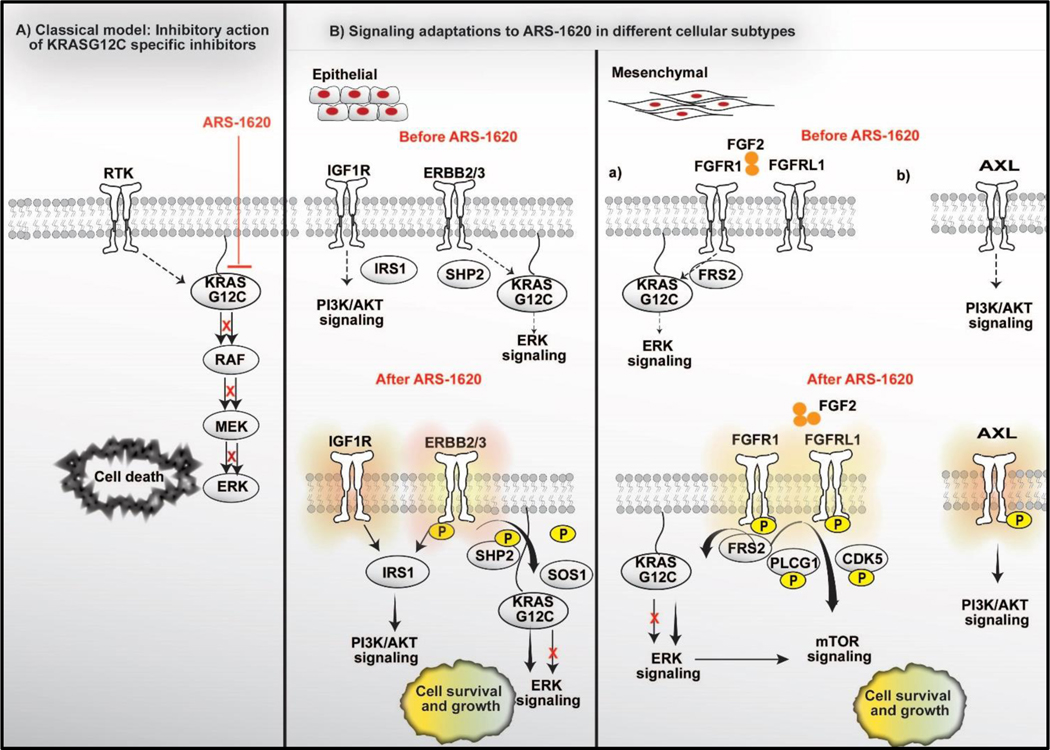
Results: Our analysis suggests cell type-specific perturbation to ERBB2/3 signaling compensates for repressed ERK and AKT signaling following ARS-1620 treatment in epithelial cell type, and this subtype was also more responsive to coinhibition of SHP2 and SOS1. Conversely, both high basal and feedback activation of FGFR or AXL signaling were identified in mesenchymal cells. Inhibition of FGFR signaling suppressed feedback activation of ERK and mTOR, while AXL inhibition suppressed PI3K pathway. In both cell lines and human lung cancer tissues with KRASG12C, we observed high basal ERBB2/3 associated with epithelial gene signatures, while higher basal FGFR1 and AXL were observed in cells/tumors with mesenchymal gene signatures.

Conclusions: Our phosphoproteomic study identified cell type-adaptive responses to KRASi. Markers and targets associated with ERBB2/3 signaling in epithelial subtype and with FGFR1/AXL signaling in mesenchymal subtype should be considered in patient enrichment schemes with KRASi.


Figures

Figure 1.
Figure 1.. Signaling rebound in KRASG12C lung cancer cells following ARS-1620 treatment and phosphoproteomics analysis indicates cell-type specific perturbations.
A) Panel of KRASG12C mutant cell lines were analyzed by CellTiter-Glo after 96 hrs of ARS-1620 treatment. Data represent means of three biological replicates; error bars denote SD. B) The indicated cell lines were treated with ARS-1620 (1μM) and rebound in p-ERK and p-Akt were monitored for 6, 24 and 48 hrs by immunoblotting with the indicated antibodies. C) LC-MRM peptide quantification of WT, total, G12C free and drug bound peptide before and after ARS-1620 treatment in KRASG12C mutant lung cancer cell lines. Target engagement (%) determined by the loss of LC-MRM ion signal for the free KRAS G12C protein (LVVVGAcamCGVGK). Unpaired Student’s t-tests were used to calculate p values: * p < 0.05 and ** p < 0.01. D) Schematic workflow for TMT-based quantitative phosphoproteomics to identify perturbation in phosphoproteome upon 6 and 24 hrs of ARS-1620 treatment in H358, H1792 and Calu1. The experiment was performed in biological triplicates with 2 mass spec injections per sample (a multiplexed TMT set). E) Categorization of differentially expressed phosphosites: “attenuating” (maximum perturbation at 6 hrs, returning towards baseline at 24 hrs), “ramping” (increasingly perturbed over time), “stable” (6 hrs and 24 hrs similarly perturbed), and “opposite” (perturbed in opposite directions at 6 hrs and 24 hrs). The “attenuating” proteins were categorized in to “attenuating-down” (hypo-phosphorylated at 6 hrs, returning towards baseline at 24 hrs) and “attenuating-up” (hyper-phosphorylated at 6 hrs, returning towards baseline at 24 hrs). F) Experimentally consistent literature network was generated for “attenuating” proteins using the MetaCore (Clarivate Analytics) pathway analysis. G) Principal component analysis (PCA) plots generated on pY and pSTY data sets using “Nonlinear Iterative Partial Least Squares” (NIPALS) algorithm. PC1/2 and PC3/4 indicate differences between cell lines and treatment time points, respectively. H) Venn diagram representing distribution of differentially expressed phosphosites among 3 cell lines (H358, Calu1 and H1792).
Figure 2.
Figure 2.. Combination of pan-HER Inhibitor and ARS-1620 overcomes signaling rebound in H358 cells.
A) Depiction of manually curated signaling rebound network in H358 cells based on experimentally affirmed signaling information available in literature for phosphosites differentially perturbed after KRASG12C inhibition. B) H358 - dose response to ARS-1620, erlotinib and afatinib alone or ARS-1620 combination with erlotinib (0.1μM) or afatinib (0.1μM) after 96 hrs of treatment and analysis using CellTiter-Glo. Data represent average of three biological replicates; error bars denote SD. C) H358 cells were treated with ARS-1620 (1μM), erlotinib (1μM), afatinib (1μM), or the indicated combinations, and p-ERK and p-Akt rebound was monitored after 6, 24 and 48 hrs by immunoblotting with the indicated antibodies. Lower exposure (LE) and higher exposures (HE). D) H358 cells were treated for 24 hrs with ARS-1620 (1μM) alone and in combination with erlotinib (1 μM) or afatinib (1μM). Cell lysates were subjected to immunoprecipitation (CoIP) using HER2 antibody and immunoblotted for HER3 (lower and higher exposure) and EGFR. Rabbit normal IgG was used as negative control.
Figure 3.
Figure 3.. Epithelial subtype predicts pan-HER combination strategy in KRASG12C lung cancer cell lines.
A) Panel of KRASG12C mutant lung cancer cell lines were analyzed by CellTiter-Glo after 96 hrs of ARS-1620 (1μM) treatment alone and in combination with Afatinib (1μM). Data represent means of three biological replicates and was normalized to DMSO control; error bars denote SD. B) H23 and H2122 cells were treated with ARS-1620 (1μM) and rebound in signaling was monitored after 6, 24 and 48 hrs by immunoblotting with the indicated antibodies. C) Heatmap showing mean-centered log abundance expression values for various phosphosites belonging to HER family of proteins in KRASG12C mutant lung cancer cell lines. The expression is scaled from lowest (blue) to highest (red); grey indicates peptides that were not detected in particular cell line. D) Cell lysates from KRASG12C mutant NSCLC cell lines were probed with indicated antibodies. E) Log2 difference between E-cadherin (CDH1) and N-cadherin (CDH2) protein expression was plotted for different KRASG12C mutant cell lines. F) The coefficient of drug interaction (CDI) was calculated for ARS-1620 + afatinib combination in KRASG12C mutant NSCLC cell lines (using biological triplicate data presented in Figure 3A) indicating relative survival rate in presence of both drugs when compared with either drug alone. The Student’s t-tests were performed to calculate the significant difference in CDI between epithelial and mesenchymal KRASG12C mutant NSCLC cell lines. The values represent means of three biological replicates for each cell lines. Antagonism, additivity or synergy is represented by values >1, = 1 or <1, respectively. A CDI below 0.7 indicates significant synergism. G) Peptides from CADH1 (CDH1) and CAHD2 (CDH2) proteins were quantified using LC-MRM method. The violin plot indicates the difference in baseline protein expression among 3 KRASG12C mutant NSCLC cell lines. Each cell line was analyzed in biological triplicates. H) Mean-centered CCLE normalized log2 RNA-seq counts for ERBB and EMT genes in KRASG12C mutant NSCLC cell lines. Raw counts were normalized with IRON (iron_generic--rnaseq) against the whole-dataset median sample (RERFLCAI_LUNG). I) TGFβ-EMT analysis of the 8 KRASG12C cell lines using our proteomics data. Positive score = more mesenchymal and negative score = more epithelial. J-K) Scatter plot of probe values representing ERBB2 and ERBB3 gene expression in KRASG12C mutants (n=59) in SPORE442 dataset. Multiple probesets exist for ERBB3, the probeset with the highest average intensity was chosen as the representative for that gene. The Pearson correlation coefficient between ERBB2 and ERBB3 gene expression was calculated along with the p-value. L) Median-centered probe value for ERBB2 and ERBB3 gene were plotted for KRASG12C mutants (n=59) in SPORE442 dataset. TGFβ-EMT scores were calculated for each KRASG12C mutant and samples were sorted based on their EMT score. After sorting on the TGFB-105 score, the p-value for Pearson correlation was calculated for the individual genes using the TGFB-105 High vs. Low median cut, tertitle, and quantiles (Supplementary Table S9). Unpaired Student’s t-tests were used to calculate p values: * p < 0.05, ** p < 0.01. *** p < 0.001.
Figure 4.
Figure 4.. SHP2 and SOS1 inhibitor(s) recapitulates efficacy observed with combining pan-HER inhibitor with ARS-1620 in epithelial subtypes. IRS1, a common signaling node mediating HER/IGF1R mediated cell survival.
A) Immunoblot analysis of p-ERK and p-AKT in H358 cells after 6, 24 and 48 hrs of treatment with ARS-1620 (1μM), RMC4550 (1μM) and BI-3406 (1μM) treatment. B) H358 cells were treated with ARS-1620 (1μM) and in the combination with RMC4550 (1μM) or BI-3406 (1μM); and expression of p-ERK and p-AKT was monitored after 6, 24 and 48 hrs by immunoblotting. C) H358 and H1792 - dose response to ARS-1620, RMC4550 and BI-3406 alone or ARS-1620 combination with RMC4550 (1μM) or BI-3406 (1μM) after 96 hrs of treatment and analysis using CellTiter-Glo. D-E) NSCLCG12C mutant cell lines were analyzed by CellTiter-Glo after 96 hrs of ARS-1620 (1μM) treatment alone and in combination with RMC4550 (1μM) or BI-3406 (1μM). The data was normalized to DMSO control. The CDI was calculated for both the combination treatments: ARS-1620 + RMC-4550 and ARS-1620 + BI-3406. The Student’s t-tests were used to calculate the significant difference in CDI between epithelial and mesenchymal KRASG12C mutant NSCLC cell lines. F) H358, H1792, H2122 and HOP62 cells were treated with AMG-510 alone and in combination with RMC4550 and/or BI-3406 (1μM). Immunoblot analysis of p-ERK was performed after different treatment time points. G) H358 dose response to ARS-1620, linsitinib and ceritinib alone or ARS-1620 combination with linsitinib (1μM) or ceritinib (1μM) after 96 hrs of treatment and analysis using CellTiter-Glo. H) Lung cancer KRASG12C mutant cell lines were analyzed by CellTiter-Glo after 96 hrs of ARS-1620 (1μM) treatment alone and in combination with linsitinib (1 μM). The data was normalized to DMSO control and CDI for ARS-1620 + linsitinib combination was plotted for all cell lines. I) H2122 cells were treated with ARS-1620, afatinib, linsitinib or the indicated combinations, and expression of pIRS1 (Y632), pAkt (473) and pERK (T202/Y204) was monitored after 24 hrs by immunoblotting. The values in figure panels (C), (D), (E), (G) and (H) represent average of three biological replicates. Unpaired Student’s t-tests were used to calculate p values: * p < 0.05, ** p < 0.01. *** p < 0.001.
Figure 5.
Figure 5.. The rebound activation of FGFR signaling cause resistance to KRASG12C specific inhibitors in KRASG12C lung cancer models with mesenchymal sub-type.
A) Depiction of manually curated signaling rebound network in H1792 cells based on experimentally affirmed signaling information available in literature for phosphosites differentially perturbed after KRASG12C inhibition. B) H1792 cells were treated with ARS-1620, afatinib, AZD-4547 or the indicated combinations, and expression of pFRS2 (Y436) was monitored after 24 hrs by immunoblotting. C) H1792 - dose response to ARS-1620 and AZD-4547 alone or ARS-1620 combination with AZD-4547 (1μM) after 96 hrs of treatment and analysis using CellTiter-Glo. D) KRASG12C mutant cell lines were analyzed by CellTiter-Glo after 96 hrs of ARS-1620 (1μM) treatment alone and in combination with AZD-4547 (1μM). The data was normalized to DMSO control and the CDI was plotted for all KRASG12C mutant NSCLC cell lines. E) H1792 cells were treated with ARS-1620 (1μM), AZD-4547 (1μM), or in the combination, and rebound in signaling was monitored after 6, 24 and 48 hrs by immunoblotting with the indicated antibodies. F-G) LU-99 cells treated with ARS-1620 (1μM), afatinib (1μM), linsitinib (1μM), RMC-4550 (1μM), BI-3406 (1μM) and AZD-4547 (1μM) or the indicated combinations. The cell viability was assessed after 96 hrs of treatment using CellTiter-Glo and data was normalized to DMSO control and statistical analysis performed using Unpaired Student’s t-tests. CDI was plotted for each combination treatment. H) LU-99 cells were treated with ARS-1620, afatinib, AZD-4547 or the indicated combinations, and rebound in signaling was monitored after 24 hrs by immunoblotting with the indicated antibodies. I-J) H1792 and/or LU-99 cells were transfected with either non-targeting (NT) control or siRNAs targeting FGFR1 for 24 hrs and then treated with ASR-1620 (1uM). The cell viability was checked after 96 hrs of treatment using CellTiter-Glo. Signaling analysis was performed after 24 hrs of ARS-1620 treatment using antibodies against indicated proteins. FGFR1 protein expression was checked to confirm siRNA-based gene silencing. K) H358 cells were serum starved (0.5% FBS) overnight and then stimulated with FGF (25 ng/ml) for 2 hrs. The cells (stimulated and un-stimulated) were then treated with ARS-1620 at two different concentrations and cell viability was assessed after 96 hrs of treatment using CellTiter-Glo. For signaling analysis, following FGF stimulation cells were treated with ARS-1620 (1μM) and p-ERK rebound was monitored after 24 hrs by immunoblotting. L) H358 cells were chronically treated for 14 days with TGFβ (4ng/ml). H358-TGFβ and untreated (H358-control) cells were checked for expression of EMT markers, RTKs, FRS2 by immunoblotting. M) H358-TGFβ and H358-control: dose response to ARS-1620. Assay readout after 96 hrs using CellTiter-Glo. Unpaired Student’s t-tests was performed to show statistically significant difference (ΔIC50) in IC50s of H358-TGFβ and H358-control. N) H358-TGFβ and H358-control cells treated with ARS-1620, AZD-4547, afatinib, RMC-4550, BI-3406 alone and in indicated combinations. The cell viability was assessed after 96 hrs using CellTiter-Glo. Data was normalized to DMSO control. O) The Heatmap representing TGFβ-EMT score and FGFR1 gene expression (probe value) in KRASG12C mutants (n=59) in SPORE442 dataset. The values in figure panels (C), (D), (F), (G), (I), (K), (M) and (N) represent average of three biological replicates; error bars denote SD. Unpaired Student’s t-tests were used to calculate p values: * p < 0.05, ** p < 0.01. *** p < 0.001.
Figure 6.
Figure 6.. Phosphoproteomics identified activation AXL receptors following KRASG12C inhibition in Calu1
A) Calu1 cells were analyzed by CellTiter-Glo after 96 hrs of ARS-1620 treatment alone and in combination with indicated drugs. B) Calu1 cells were treated with ARS-1620 (1μM), erlotinib (1μM), afatinib (1μM), SHP-099 (5μM) or the indicated combinations and rebound in p-ERK and p-Akt was monitored after 6, 24 and 48 hrs by immunoblotting with the indicated antibodies. C) Depiction of manually curated signaling rebound network in Calu1 based on phosphosites-based literature evidences. D) Cell lysates from KRASG12C mutant cell lines were probed with indicated antibodies. E-F) Calu1 - dose response to ARS-1620, AXL inhibitors (RXDX-106, foretinib and cabozantinib) and PI3K-AKT inhibitor (GDC-0941) alone or ARS-1620 combination with AXL inhibitors (1μM) or PI3K-AKT inhibitor (1μM) after 96 hrs of treatment and analysis using CellTiter-Glo. CI and Fa was calculated using CompuSyn software. G) Signaling analysis in Calu1 after 24 hrs of ARS-1620 (1μM), afatinib (1μM), AZD-4547(1μM), linsitinib (1μM), cabozantinib (1μM), imatinib (1μM), ceritinib (1μM) treatment alone and ARS-1620 combination with indicated drug. H) Calu1 cells were treated with ARS-1620 and RXDX-106 alone and in combination ARS + RXDX-106 (1μM) combination for 24 hrs and immunoblotted with indicated antibodies. I) Calu1 cells were transfected with either non-targeting (NT) control or siRNAs targeting AXL for 24 hrs and then treated with ASR-1620 (1uM). The cell viability was checked after 96 hrs of treatment using CellTiter-Glo. J) The Heatmap representing TGFβ-EMT score and AXL gene expression (probe value) in KRASG12C mutants (n=59) in SPORE442 dataset. The values in figure panels (A), (E), (F) and (I) represents average of three biological replicates; error bars denote SD. Unpaired Student’s t-tests were used to calculate p values: * p < 0.05, ** p < 0.01. *** p < 0.001.
Figure 7.
Figure 7.. Schematics of the short-term adaptive resistance to KRAS specific inhibitor ARS-1620 via signaling network modulation.
A) A classical model depicting suppression of ERK Signaling by KRASG12C specific covalent inhibitors in tumors with KRASG12C mutation. B) The mechanism of adaptive signaling differs in tumor cells in epithelial vs. mesenchymal states. Epithelial subtypes do have support from HER signaling prior treatment with KRASG12C inhibitor. KRASG12C inhibition further enhances HER signaling support for survival and growth. IRS1 acts a major signaling hub downstream of HER and IGF receptors. Thus, Epithelial subtypes benefit from dual pan-HER/KRASi combination. In contrast, we speculate possibilities of multiple subtypes within mesenchymal type of KRASG12C tumors, where each sub-type might have experienced specific rewiring in signaling during epithelial to mesenchymal transformation. Specifically, within mesenchymal type, our analysis identified activation of two major signaling pathways: (a) FGFR and (b) AXL signaling, likely representing two different sub-group in mesenchymal type. The rebound activation of FGFR signaling cause therapy resistance by regulating MAPK and mTOR signaling, while rebound in AXL signaling cause activation of PI3K-AKT signaling. These specific subtypes identified within mesenchymal models also benefit from FGFR or AXL inhibitor-based combination strategy with KRASG12C inhibitor.

References

    1. Singh A, Settleman J. Oncogenic K-ras “addiction” and synthetic lethality. Cell Cycle 2009;8(17):2676–7 doi 9336 [pii]. - PMC - PubMed
    1. Kris MG, Johnson BE, Berry LD, Kwiatkowski DJ, Iafrate AJ, Wistuba II, et al. Using multiplexed assays of oncogenic drivers in lung cancers to select targeted drugs. JAMA 2014;311(19):1998–2006 doi 10.1001/jama.2014.3741. - DOI - PMC - PubMed
    1. Bedard PL, Tabernero J, Janku F, Wainberg ZA, Paz-Ares L, Vansteenkiste J, et al. A phase Ib dose-escalation study of the oral pan-PI3K inhibitor buparlisib (BKM120) in combination with the oral MEK1/2 inhibitor trametinib (GSK1120212) in patients with selected advanced solid tumors. Clin Cancer Res 2015;21(4):730–8 doi 10.1158/1078-0432.CCR-14-1814. - DOI - PubMed
    1. Janes MR, Zhang J, Li LS, Hansen R, Peters U, Guo X, et al. Targeting KRAS Mutant Cancers with a Covalent G12C-Specific Inhibitor. Cell 2018;172(3):578–89 e17 doi 10.1016/j.cell.2018.01.006. - DOI - PubMed
    1. Patricelli MP, Janes MR, Li LS, Hansen R, Peters U, Kessler LV, et al. Selective Inhibition of Oncogenic KRAS Output with Small Molecules Targeting the Inactive State. Cancer Discov 2016;6(3):316–29 doi 10.1158/2159-8290.CD-15-1105. - DOI - PubMed

Publication types

MeSH terms