. 2021 Feb 23;6(1):76.
doi: 10.1038/s41392-020-00453-8.

HIF-1α-induced expression of m6A reader YTHDF1 drives hypoxia-induced autophagy and malignancy of hepatocellular carcinoma by promoting ATG2A and ATG14 translation

Affiliations

HIF-1α-induced expression of m6A reader YTHDF1 drives hypoxia-induced autophagy and malignancy of hepatocellular carcinoma by promoting ATG2A and ATG14 translation

Qing Li et al. Signal Transduct Target Ther. .

Abstract

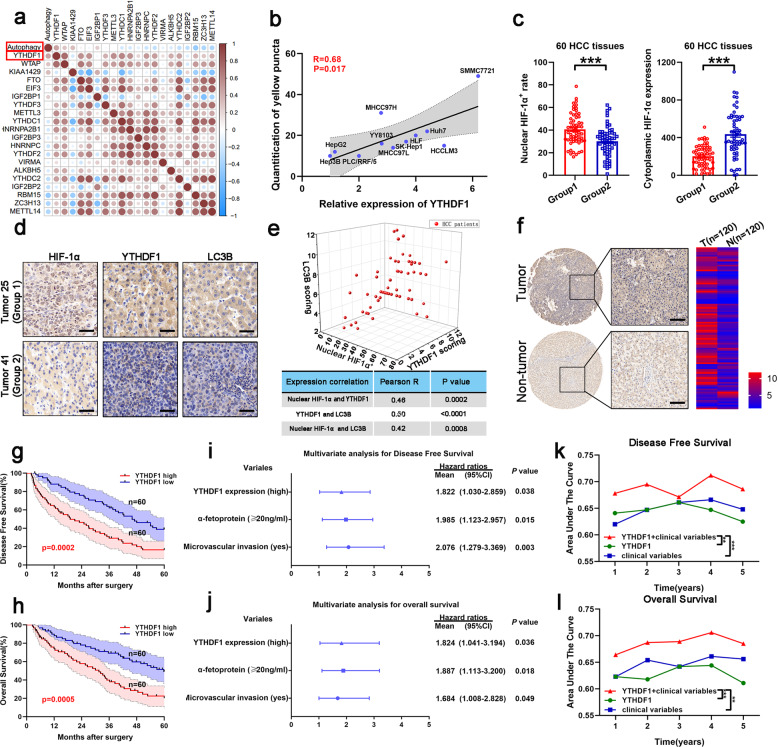
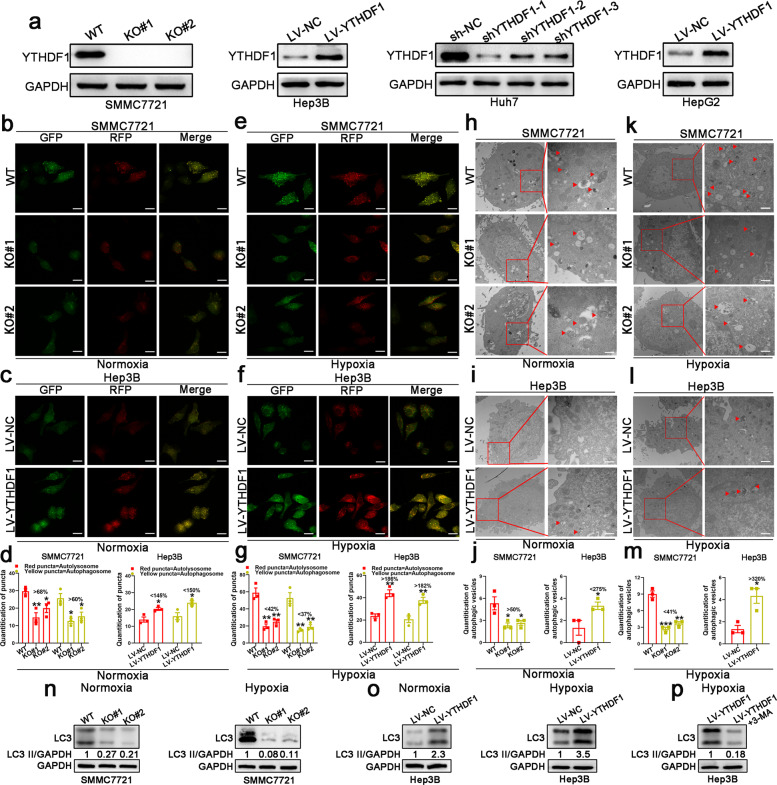
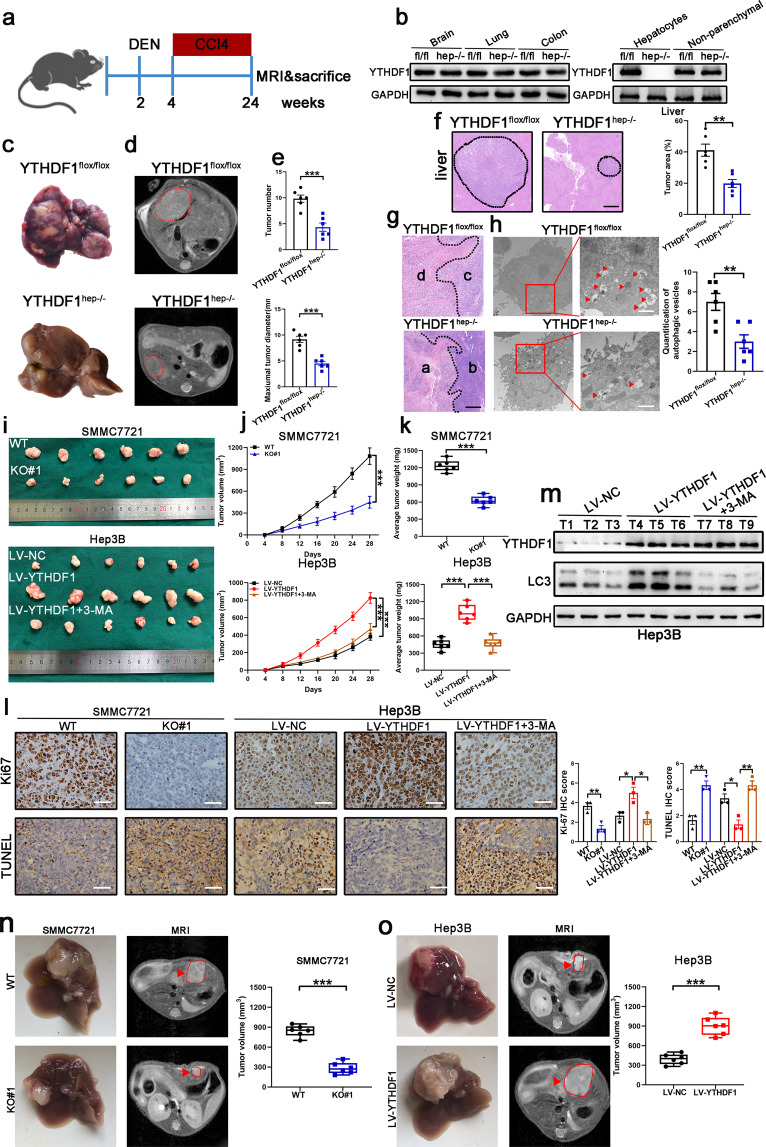
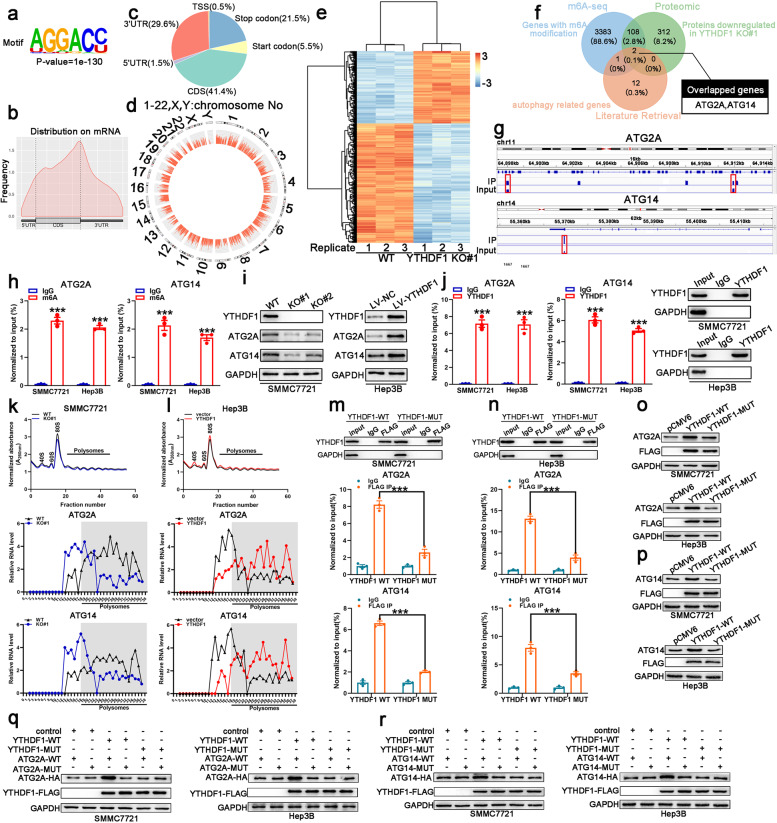
N6-methyladenosine (m6A), and its reader protein YTHDF1, play a pivotal role in human tumorigenesis by affecting nearly every stage of RNA metabolism. Autophagy activation is one of the ways by which cancer cells survive hypoxia. However, the possible involvement of m6A modification of mRNA in hypoxia-induced autophagy was unexplored in human hepatocellular carcinoma (HCC). In this study, specific variations in YTHDF1 expression were detected in YTHDF1-overexpressing, -knockout, and -knockdown HCC cells, HCC organoids, and HCC patient-derived xenograft (PDX) murine models. YTHDF1 expression and hypoxia-induced autophagy were significantly correlated in vitro; significant overexpression of YTHDF1 in HCC tissues was associated with poor prognosis. Multivariate cox regression analysis identified YTHDF1 expression as an independent prognostic factor in patients with HCC. Multiple HCC models confirmed that YTHDF1 deficiency inhibited HCC autophagy, growth, and metastasis. Luciferase reporter assays and chromatin immunoprecipitation demonstrated that HIF-1α regulated YTHDF1 transcription by directly binding to its promoter region under hypoxia. The results of methylated RNA immunoprecipitation sequencing, proteomics, and polysome profiling indicated that YTHDF1 contributed to the translation of autophagy-related genes ATG2A and ATG14 by binding to m6A-modified ATG2A and ATG14 mRNA, thus facilitating autophagy and autophagy-related malignancy of HCC. Taken together, HIF-1α-induced YTHDF1 expression was associated with hypoxia-induced autophagy and autophagy-related HCC progression via promoting translation of autophagy-related genes ATG2A and ATG14 in a m6A-dependent manner. Our findings suggest that YTHDF1 is a potential prognostic biomarker and therapeutic target for patients with HCC.


Conflict of interest statement

The authors declare no competing interests.

Figures

Fig. 1
Fig. 1
Increased YTHDF1 expression is associated with poor prognosis in patients with HCC. a Relationship between m6A gene expression and hypoxia-induced autophagy in HCC cell lines using a correlation matrix. b Relationship between YTHDF1 expression and hypoxia-induced autophagy in HCC cell lines. c Immunohistochemistry (IHC) staining of HIF-1α in human HCC tumors. d IHC staining of HIF-1α, YTHDF1, and LC3B in human HCC tumors. Scale bar, 100 µm. e Three-dimensional scatter plot of HIF-1α, YTHDF1, and LC3B in human HCC tumors. f Representative IHC images of YTHDF1 using HCC tissue microarray (TMA). Scale bar, 200 µm. g, h Kaplan–Meier analysis showing the disease-free survival and overall survival of HCC patients with diverse YTHDF1 expression. I, j Multivariate Cox regression analysis of disease-free survival and overall survival in patients with HCC. k, l Time-dependent receiver operating characteristic analysis for clinical risk score (microvascular invasion), YTHDF1 risk score, and combined YTHDF1 and clinical risk scores in patients with HCC. Error bars represent the mean ± SEM and the dots represent the value of each experiment; **P < 0.01, ***P < 0.001
Fig. 2
Fig. 2
HIF-1α activates YTHDF1 transcription under hypoxia. a Correlation between mRNA expression of HIF-1α and YTHDF1 in the GEPIA database. b Correlation between mRNA expression of HIF-1-α and YTHDF1 in the TCGA database. c, d HCC cells with HIF-1α overexpression (HIF-1α) or not (control) were cultured under normoxia (20% O2) or hypoxia (1% O2), and expression of HIF-1α and YTHDF1 was detected using qRT-PCR (c) and western blotting (d), respectively. e, f HCC cells with HIF-1α knockdown (shHIF-1α) or not (scramble) were cultured under normoxia (20% O2) or hypoxia (1% O2), and expression of HIF-1α and YTHDF1 was detected using qRT-PCR (e) and western blotting (f), respectively. g, h HCC cells following LW6 treatment or not (vehicle) were cultured under normoxia (20% O2) or hypoxia (1% O2), and expression of HIF-1α and YTHDF1 was detected using qRT-PCR (g) and western blotting (h), respectively. i, j Western blotting of YTHDF1/FLAG levels treated with or without LW6. k Luciferase reporter assays were performed in SMMC7721 and Hep3B cells following HIF-1α overexpression under normoxia or hypoxia. l Chromatin immunoprecipitation (ChIP) assays in SMMC7721 and Hep3B cells to assess the binding of HIF-1α to the YTHDF1 promoter under hypoxia. m Putative HIF-1α-binding sites (HBS) within the genomic sequence adjacent to the transcription start site (TSS) of the YTHDF1 gene. n Mutant HBS sequences in the YTHDF1 promoter. o, p Luciferase reporter assays for the mutant HBS sequences in SMMC7721 and Hep3B cells following HIF-1α overexpression under hypoxia. q, r Luciferase reporter assays for the mutant HBS sequences in SMMC7721 and Hep3B cells following HIF-1α knockdown under hypoxia. st Luciferase reporter assays for the mutant HBS sequences in SMMC7721 and Hep3B cells following LW6 treatment under hypoxia. u, v ChIP assays in SMMC7721 and Hep3B cells to investigate the binding of HIF-1α to the YTHDF1 promoter via HBS1 and HBS3 under hypoxia. Error bars represent the mean ± SEM and the dots represent the value of each experiment; *P < 0.05, **P < 0.01, ***P < 0.001, ns, no significance
Fig. 3
Fig. 3
YTHDF1 promotes hypoxia-induced autophagy in HCC cell lines. a Protein levels of YTHDF1 in HCC cell lines determined by western blotting. b, c Immunofluorescence (IF) staining with mRFP-GFP-LC3 in normoxic SMMC7721 and Hep3B cells with YTHDF1 knockout or overexpression, respectively. Red puncta signify autolysosomes and yellow puncta signify autophagosomes. Scale bar, 10 µm. d Quantification of LC3 puncta under normoxia. e, f IF staining with mRFP-GFP-LC3 in hypoxic SMMC7721 and Hep3B cells with YTHDF1 knockout or overexpression, respectively. Red puncta signify autolysosomes and yellow puncta signify autophagosomes. Scale bar, 10 µm. g Quantification of LC3 puncta under hypoxia. h, i Transmission electron microscopy (TEM) demonstrating autolysosomes and autophagosomes in normoxic SMMC7721 and Hep3B cells with YTHDF1 knockout or overexpression, respectively. Scale bar, 1 µm. j Quantification of autophagic vesicles under normoxia. k, l TEM demonstrating autolysosomes and autophagosomes in hypoxic SMMC7721 and Hep3B cells with YTHDF1 knockout or overexpression, respectively. Scale bar, 1 µm. m Quantification of autophagic vesicles under hypoxia. n Western blotting demonstrating expression of LC3 in SMMC7721 cells with YTHDF1 knockout under normoxia and hypoxia. o Western blotting demonstrating expression of LC3 in Hep3B cells with YTHDF1 overexpression under normoxia and hypoxia. p Western blotting demonstrating expression of LC3 in hypoxic YTHDF1-overexpressing Hep3B cells following 3-MA treatment. Error bars represent the mean ± SEM and the dots represent the value of each experiment; *P < 0.05, **P < 0.01, ***P < 0.001
Fig. 4
Fig. 4
YTHDF1 deficiency inhibits HCC growth. a Schematic representation of the DEN/CCl4-induced HCC model. b YTHDF1 expression in hepatocytes and nonparenchymal cells of YTHDF1hep−/− and YTHDF1flox/flox mice by western blotting. ce Representative gross appearance (c), magnetic resonance imaging (MRI) (d), tumor number, and maximum tumor diameter (e) of livers from DEN/CCl4-treated YTHDF1hep−/− and YTHDF1flox/flox mice. f Hematoxylin and eosin (H&E) staining of liver sections from DEN/CCl4-treated YTHDF1hep−/− and YTHDF1flox/flox mice. Scale bar, 200 µm. g H&E staining for representative tumor sections. Scale bar, 200 µm. h TEM showing the ultra-microstructure of the tumor section. Red arrows indicate autophagosomes or autolysosomes that have a double-layer structure. Scale bar, 1 µm. i Representative xenograft tumors after subcutaneous injection of SMMC7721 cells transfected with YTHDF1-KO#1 and WT 28 d after inoculation (upper). Representative xenograft tumors after subcutaneous injection of Hep3B cells transfected with LV-YTHDF1 and corresponding control 28 d after inoculation (low). 3-MA was used as an autophagy inhibitor. j Time course of HCC xenograft growth. k Tumor weight of HCC xenografts. l Proliferation (Ki67) and apoptosis (Tunel) immunohistochemistry (IHC) staining of tumor sections. Scale bar, 100 µm. m Western blotting of YTHDF1 and LC3 proteins. 3-MA was used as an autophagy inhibitor. n Nude mice orthotopically implanted tumors of YTHDF1-knockout SMMC7721 cells. o Nude mice orthotopically implanted tumors of YTHDF1-overexpressing Hep3B cells. Error bars represent the mean ± SEM and the dots represent the value of each experiment; *P < 0.05, **P < 0.01, ***P < 0.001
Fig. 5
Fig. 5
MeRIP-seq and proteomics identified potential targets of YTHDF1 in HCC. a m6A motif detected by the MEME motif analysis with MeRIP-seq data in hypoxic SMMC7721 cells. b Metagene profiles of m6A enrichment across mRNA transcriptome in hypoxic SMMC7721 cells. c Distribution of m6A sites within different gene regions. d Circos plot displaying the distribution of m6A peaks in the human transcriptome of hypoxic SMMC7721 cells. e Heat map showing the most significantly altered proteins. f Overlapping analysis of genes identified by MeRIP-seq, proteomics, and autophagy-related genes. g Integrative genomics viewer (IGV) plots of m6A peaks at ATG2A and ATG14 mRNAs. h Methylated RNA immunoprecipitation of the transcripts of ATG2A and ATG14 in hypoxic SMMC7721 and Hep3B cells. i Validation of ATG2A and ATG14 expression in hypoxic SMMC7721 and Hep3B cells with YTHDF1 knockout or overexpression, respectively. j YTHDF1 immunoprecipitation assays of ATG2A and ATG14 transcripts in YTHDF1-bound mRNAs in hypoxic SMMC7721 and Hep3B cells. k, l Polysome profiling of hypoxic SMMC7721 and Hep3B cells with YTHDF1 knockout (l) or overexpression (l), respectively (upper panel); qRT-PCR analysis of ATG2A (middle panel) and ATG14 (lower panel) mRNA distribution in different ribosome populations. m RIP-derived protein and RNA in hypoxic SMMC7721 cells examined using western blotting and RT-qPCR, respectively. GAPDH was employed as a negative control in western blotting. n RIP-derived protein and RNA in hypoxic Hep3B cells examined using western blotting and RT-qPCR, respectively. GAPDH was employed as a negative control in western blotting. o, p Analysis of ATG2A and ATG14 expression following overexpression of YTHDF1 wild-type or mutant using western blotting. q, r Western blotting detected HA-tagged ATG2A and ATG14 expression in hypoxic SMMC7721 and Hep3B cells co-transfected with empty vector, wild-type, or mutant FLAG-tagged YTHDF1, and wild-type or mutant HA-tagged ATG14 or ATG2A. Error bars represent the mean ± SEM and the dots represent the value of each experiment; ***P < 0.001
Fig. 6
Fig. 6
YTHDF1 deficiency inhibits HCC growth in PDX models. a Graphic illustration of HCC PDX mouse models. b Clinical characteristics of the donor patients. c Hematoxylin and eosin (H&E) staining of donor patient tissues. Scale bar, 100 µm. d, e Harvested engrafted tumors in the sh-NC, shYTHDF1, LV-NC, LV-YTHDF1 groups. f Tumor weight of the engrafted tumors. g Tumor volume of the engrafted tumors. h, i Expression levels of YTHDF1, ATG2A, ATG14, and Ki67 in PDX tumor tissues determined by immunohistochemistry (IHC) staining. Scale bar, 50 µm. Error bars represent the mean ± SEM and the dots represent the value of each experiment; *P < 0.05, **P < 0.01, ***P < 0.001

Similar articles

Cited by

References

    1. Zhou SL, et al. A positive feedback loop between cancer stem-like cells and tumor-associated neutrophils controls hepatocellular carcinoma progression. Hepatology. 2019;70:1214–1230. doi: 10.1002/hep.30630. - DOI - PubMed
    1. Gao Q, et al. Integrated proteogenomic characterization of HBV-related hepatocellular carcinoma. Cell. 2019;179:1240. doi: 10.1016/j.cell.2019.10.038. - DOI - PubMed
    1. Tang W, et al. The mechanisms of sorafenib resistance in hepatocellular carcinoma: theoretical basis and therapeutic aspects. Signal Transduct. Target Ther. 2020;5:87. doi: 10.1038/s41392-020-0187-x. - DOI - PMC - PubMed
    1. Zhang R, et al. Dickkopf-1 contributes to hepatocellular carcinoma tumorigenesis by activating the Wnt/beta-catenin signaling pathway. Signal Transduct. Target Ther. 2019;4:54. doi: 10.1038/s41392-019-0082-5. - DOI - PMC - PubMed
    1. Li Q, et al. Circular RNA MAT2B promotes glycolysis and malignancy of hepatocellular carcinoma through the miR-338-3p/PKM2 axis under hypoxic stress. Hepatology. 2019;70:1298–1316. doi: 10.1002/hep.30671. - DOI - PubMed

Publication types

MeSH terms