. 2021 Feb 22;12(1):1216.
doi: 10.1038/s41467-021-21477-w.

Dysregulation of REV-ERBα impairs GABAergic function and promotes epileptic seizures in preclinical models

Affiliations

Dysregulation of REV-ERBα impairs GABAergic function and promotes epileptic seizures in preclinical models

Tianpeng Zhang et al. Nat Commun. .

Abstract

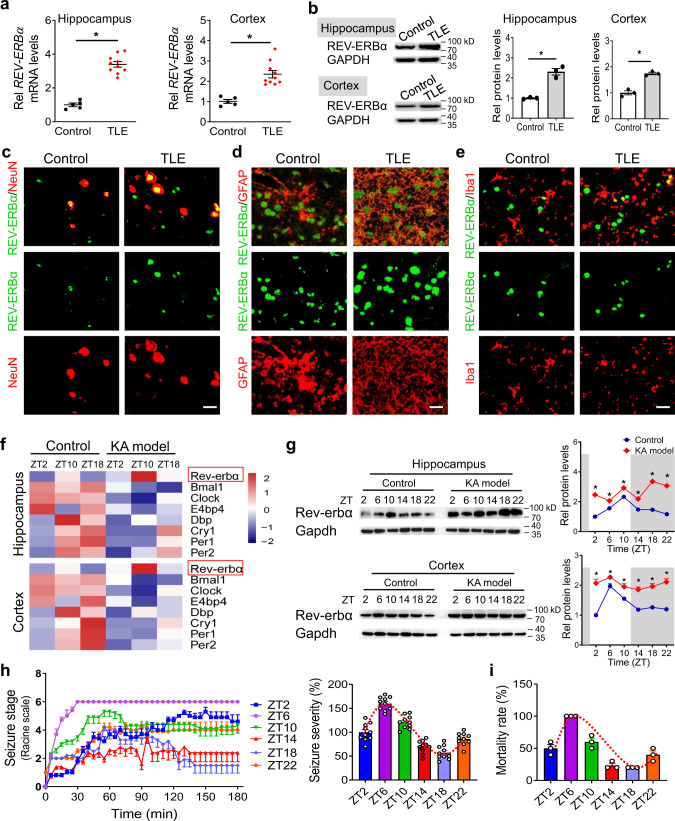
To design potentially more effective therapies, we need to further understand the mechanisms underlying epilepsy. Here, we uncover the role of Rev-erbα in circadian regulation of epileptic seizures. We first show up-regulation of REV-ERBα/Rev-erbα in brain tissues from patients with epilepsy and a mouse model. Ablation or pharmacological modulation of Rev-erbα in mice decreases the susceptibility to acute and chronic seizures, and abolishes diurnal rhythmicity in seizure severity, whereas activation of Rev-erbα increases the animal susceptibility. Rev-erbα ablation or antagonism also leads to prolonged spontaneous inhibitory postsynaptic currents and elevated frequency in the mouse hippocampus, indicating enhanced GABAergic signaling. We also identify the transporters Slc6a1 and Slc6a11 as regulators of Rev-erbα-mediated clearance of GABA. Mechanistically, Rev-erbα promotes the expressions of Slc6a1 and Slc6a11 through transcriptional repression of E4bp4. Our findings propose Rev-erbα as a regulator of synaptic function at the crosstalk between pathways regulating the circadian clock and epilepsy.


Conflict of interest statement

The authors declare no competing interests.

Figures

Fig. 1
Fig. 1. Rev-erbα is dysregulated in human and mouse epileptic tissues.
a mRNA expression of REV-ERBα in hippocampus and cortex from TLE patients (n = 10 biologically independent samples) and controls (n = 5 biologically independent samples). Two-sided t test p values: p < 0.0001 (hippocampus); p = 0.003 (cortex). b Protein expression of REV-ERBα in hippocampus and temporal cortex from TLE patients and controls. TLE and control samples were pooled for western blotting analysis. Each western blot is representative of three independent experiments. Western blot strips (a target protein and a loading control) were cut from one gel. Two-sided t test p values: p = 0.0013 (hippocampus); p = 0.0013 (cortex). ce REV-ERBα colocalizes with neuronal marker NeuN, astrocytic marker GFAP, and microglial marker Iba1 in human epileptic and control tissues. Similar results were obtained in three independent experiments. Scale bar = 20 μm. f Heatmap of clock gene transcripts in hippocampus and cortex from kainic acid (KA)-treated and control mice. g Rev-erbα protein levels in hippocampus and cortex from KA-treated mice (n = 6 biologically independent samples) and controls (n = 6 biologically independent samples). Western blot strips (a target protein and a loading control) were cut from one gel. P values (hippocampus, from left to right): p = <0.0001, 0.0015, 0.0050, 0.0002, <0.0001, and 0.0001 (two-way ANOVA and Bonferroni post hoc test). P values (cortex, from left to right): p = 0.0017, 0.0405, 0.0247, 0.0023, 0.0027, and 0.0016 (two-way ANOVA and Bonferroni post hoc test). h Seizure stages of wild-type (WT) mice (n = 10 per group) treated with KA (20 mg/kg, i.p.) at each of six circadian time points (ZT2, ZT6, ZT10, ZT14, ZT18, and ZT22). i Mortality rates of WT mice treated with KA (20 mg/kg, i.p.) at each of six circadian time points (ZT2, ZT6, ZT10, ZT14, ZT18, and ZT22). Three independent experiments (each with ten mice) were performed to determine the mortality rate. In a, b and gi, data are presented as mean ± SEM. * represents a p value of <0.05. TLE temporal lobe epilepsy, Rel relative, ZT zeitgeber time.
Fig. 2
Fig. 2. Loss of Rev-erbα reduces acute seizures in mice.
a Seizure stages of Rev-erbα−/− (KO) mice (n = 8 biologically independent samples) and wild-type (WT) mice (n = 8 biologically independent samples) injected with kainic acid (KA, 20 mg/kg) at ZT6. P < 0.0001 (two-sided Kruskal–Wallis test). b Seizure parameters (severity, onset, and duration) of Rev-erbα−/− mice (n = 8 biologically independent samples) and WT mice (n = 8 biologically independent samples) injected with KA (20 mg/kg) at ZT6. Two-sided t test p values: p < 0.0001 (seizure severity); p < 0.0001 (onset); p < 0.0001 (seizure duration). c Representative EEG tracings in mice before (3 h) and after (3 h) KA injection (20 mg/kg). d FJB staining of hippocampus sampled at 24 h after injection of KA (20 mg/kg) to Rev-erbα−/− and WT mice. e TUNEL staining of hippocampus sampled at 24 h after injection of KA (20 mg/kg). f NeuN and GFAP staining of hippocampus at 24 h after KA injection (20 mg/kg). g Seizure stages of Rev-erbα−/− mice (n = 8 biologically independent samples) and WT mice (n = 8 biologically independent samples) injected with KA (20 mg/kg) at ZT6 and ZT18. Two-sided Kruskal–Wallis test p values: p < 0.0001 (ZT6); p = 0.1213 (ZT18). h Seizure severity of Rev-erbα−/− mice (n = 8 biologically independent samples) and WT mice (n = 8 biologically independent samples) injected with KA (20 mg/kg) at ZT6 and ZT18. P < 0.0001 (ZT6); p = 0.0893 (ZT18; two-way ANOVA and Bonferroni post hoc test). i Mortality rates of Rev-erbα−/− and WT mice injected with KA (20 mg/kg) at ZT6 and ZT18. Three independent experiments (each with ten mice) for each group were performed to determine the mortality rate. P = 0.0002 (ZT6); p = 0.2302 (ZT18; two-way ANOVA and Bonferroni post hoc test). Scale bar = 50 μm. In a, b and gi, data are presented as mean ± SEM. For df, similar results were obtained in three independent experiments. * represents a p value of <0.05. FJB Fluoro-Jade-B, n.s no significant, ZT zeitgeber time.
Fig. 3
Fig. 3. Small-molecule targeting of Rev-erbα alleviates acute and chronic seizures.
a Effects of SR8278 pretreatment (25 mg/kg, i.p.) on seizure stages of wild-type (WT) mice induced by kainic acid (KA, 20 mg/kg, i.p.) at ZT6. P < 0.0001 (two-sided Kruskal–Wallis test). b Effects of SR8278 pretreatment on seizure parameters (severity, onset, and duration) of KA-induced acute seizure mice. Two-sided t test p values: p < 0.0001 (seizure severity); p < 0.0001 (onset); p < 0.0001 (seizure duration). c Representative EEG tracings in mice (pretreated with SR8278 or vehicle) before (3 h) and after (3 h) KA injection (20 mg/kg, i.p.). d FJB staining of hippocampus at 24 h after KA (20 mg/kg, i.p.) administration to WT mice pretreated with SR8278 (25 mg/kg, i.p.) or vehicle. Similar results were obtained in three independent experiments. e TUNEL staining of hippocampus at 24 h after KA (20 mg/kg, i.p.) administration to WT mice pretreated with SR8278 (25 mg/kg, i.p.) or vehicle. Similar results were obtained in three independent experiments. f Hippocampus NeuN and GFAP staining in mice (pretreated with SR8278 or vehicle) at 24 h after treatment with KA (20 mg/kg, i.p.). Similar results were obtained in three independent experiments. g Effects of SR8278 pretreatment (25 mg/kg, i.p.) on seizure stages of Rev-erbα−/− and WT mice induced by KA (20 mg/kg, i.p.) at ZT6. Two-sided Kruskal–Wallis test p values: p < 0.0001 (ZT6); p = 0.1027 (ZT18). h Effects of SR8278 pretreatment (25 mg/kg, i.p.) on seizure severity of Rev-erbα−/− and WT mice induced by KA (20 mg/kg, i.p.) at ZT6. P < 0.0001 (WT, seizure severity); p = 0.0893 (KO, seizure severity); p < 0.0001 (WT, onset); p = 0.0635 (KO, onset); p < 0.0001 (WT, seizure duration); p = 0.0643 (KO, seizure duration; two-way ANOVA followed by Bonferroni post hoc test). Scale bar = 50 μm. In a, b, g and h, data are presented as mean ± SEM. n = 6 mice per group. * represents a p value of <0.05. FJB Fluoro-Jade-B, n.s. no significant.
Fig. 4
Fig. 4. Rev-erbα ablation alleviates TLE in a hippocampal kindling model.
a Experimental scheme for establishment of kindling-induced TLE model with Rev-erbα−/− (KO) and wild-type (WT) mice. The image was created by T. Zhang. b Seizure stages and ADD (afterdischarge duration) of Rev-erbα−/− and WT mice after repeated kindling stimulations. P values: <0.0001 (seizure stages), <0.0001 (ADD; two-sided Kruskal–Wallis test). c Numbers of stimulation required to reach generalized seizure of Rev-erbα−/− and WT mice. P < 0.0001 (two-sided t test). d EEG recordings and power spectra of Rev-erbα−/− and WT mice in a hippocampal kindling model. Red indicates high relative power and blue indicates low power of EEG frequency bands, as shown in the scale bar. e Experimental scheme for SR8278 (25 mg/kg, i.p.) pretreatment and kindling stimulations with WT mice. f Effects of SR8278 on seizure stages and ADD of WT mice in a hippocampal kindling model. P values: <0.0001 (seizure stages); <0.0001 (ADD; two-sided Kruskal–Wallis test). g Effects of SR8278 on numbers of stimulation required to reach generalized seizure. P < 0.0001 (two-sided t test). h EEG recordings and power spectra of kindling-induced TLE mice pretreated with SR8278 or vehicle. Red indicates high relative power and blue indicates low power of EEG frequency bands, as shown in the scale bar. In b, c, f and g, data are presented as mean ± SEM. n = 6 mice per group. * represents a p value of <0.05. ADD afterdischarge duration, GS generalized seizure.
Fig. 5
Fig. 5. Rev-erbα regulates spontaneous inhibitory postsynaptic currents and GABA uptake.
a Representative traces of spontaneous inhibitory postsynaptic currents (sIPSCs) derived from dentate gyrus granule cells of Rev-erbα−/− (KO) and wild-type (WT) mice. b sIPSC frequency and amplitude for KO (33 cells, six mice) and WT mice (33 cells, six mice). P values are shown in the figure (two-sided Mann–Whitney test). c sIPSC decay time and rise time for KO (33 cells, six mice) and WT mice (33 cells, six mice). P values are shown in the figure (two-sided Mann–Whitney test). d Representative traces of sIPSCs derived from the DGGCs of SR8278- or vehicle-treated mice. e sIPSC frequency and amplitude for SR8278- or vehicle-treated mice (SR8278 group: 23 cells, five mice; vehicle group: 25 cells, five mice). P values are shown in the figure (two-sided Mann–Whitney test). f sIPSC decay time and rise time for SR8278 treatment (SR8278 group: 23 cells, five mice; vehicle group: 25 cells, five mice). P values are shown in the figure (two-sided Mann–Whitney test). g Heatmap of genomic transcripts in hippocampus and cortex of KO and WT mice at ZT6 and ZT18. Red indicates high relative expression and blue indicates low expression of genes, as shown in the scale bar. h Venn diagram of the uniquely and commonly changed genes in hippocampus and cortex of Rev-erbα−/− and WT mice at ZT6 and ZT18, highlighting the top 20 commonly changed genes. i Schematic diagram showing GABA signaling pathway. j Cellular uptake of GABA-d6 in brain slices derived from KO and WT mice. n = 6 mice per group. Two-sided t test p values: 0.0019 (5 μM), <0.0001 (10 μM), and 0.0003 (40 μM). k Effects of Rev-erbα knockdown on GABA-d6 uptake in primary hippocampus and cortex neurons (n = 5 biologically independent samples). In b, c, e, and f, data are shown as box-and-whisker with median (middle line), 25th–75th percentiles (box), and 5th and 95th percentile (whiskers), as well as outliers (single points). In j and k, data are mean ± SEM. * Represents a p value of <0.05. DGGC dentate gyrus granule cell, VH vehicle, HIP hippocampus.
Fig. 6
Fig. 6. Rev-erbα positively regulates Slc6a1 and Slc6a11 expressions.
a mRNA expressions of Slc6a1 and Slc6a11 in the hippocampus of Rev-erbα−/− (KO) and wild-type (WT) mice. n = 6 mice per group. Data are presented as the fold change in gene expression normalized to Cyclophilin b and relative to ZT2 of WT mice. b mRNA expressions of Slc6a1 and Slc6a11 in the cortex of Rev-erbα−/− and WT mice. n = 6 mice per group. c Protein levels of Slc6a1, Slc6a11, and E4bp4 in the hippocampus of Rev-erbα−/− and WT mice. n = 6 mice per group. Western blot strips (a target protein and a loading control) were cut from one gel. d Protein levels of Slc6a1, Slc6a11, and E4bp4 in the cortex of Rev-erbα−/− and WT mice. n = 6 mice per group. Western blot strips (a target protein and a loading control) were cut from one gel. e Effects of Rev-erbα overexpression or knockdown on mRNA expressions of Slc6a1 and Slc6a11 in Neuro-2a cells (n = 3 biologically independent samples). Two-sided t test p values (from left to right): 0.0008, 0.0004, 0.0149, and 0.0062. f Effects of Rev-erbα overexpression or knockdown on Slc6a1 and Slc6a11 mRNA expressions in primary hippocampus neurons (n = 3 biologically independent samples). Two-sided t test p values (from left to right): 0.0006, 0.0005, 0.0012, and 0.0004. g Effects of Rev-erbα overexpression or knockdown on mRNA expressions of Slc6a1 and Slc6a11 in primary cortex neurons (n = 3 biologically independent samples). Two-sided t test p values (from left to right): 0.0022, 0.0046, 0.0387, and 0.0266. h SR8278 dose-dependently represses mRNA expressions of Slc6a1 and Slc6a11 in primary hippocampus and cortex neurons (n = 3 biologically independent samples). P values (from left to right): 0.0065, 0.0016, 0.0024, 0.0016, 0.0341, 0.0065, 0.0019, 0.0004, 0.0499, 0.0193, 0.0089, 0.0046, 0.1162, 0.0118, 0.0033, and 0.0031 (one-way ANOVA and Bonferroni post hoc test). All data are presented as mean ± SEM. Statistics for ad were performed with two-way ANOVA and Bonferroni post hoc test. * Represents a p value of <0.05. ZT zeitgeber time, Rel relative.
Fig. 7
Fig. 7. Rev-erbα regulates Slc6a1 and Slc6a11 expressions via repression of E4bp4.
a mRNA expressions of Slc6a1 and Slc6a11 in hippocampus and cortex of E4bp4−/− and wild-type (WT) mice. n = 6 mice per group. *p < 0.05 (two-way ANOVA and Bonferroni post hoc test). b Protein levels of Slc6a1 and Slc6a11 in hippocampus and cortex of E4bp4−/− and WT mice. n = 6 mice per group. Western blot strips (a target protein and a loading control) were cut from one gel. c Effects of E4bp4 overexpression or knockdown on mRNA expressions of Slc6a1 and Slc6a11 in Neuro-2a cells (n = 3 biologically independent samples). Two-sided t test p values: 0.0001, 0.0007, 0.0001, and 0.0001. d Effects of E4bp4 overexpression or knockdown on mRNA expressions of Slc6a1 and Slc6a11 in primary hippocampus neurons (n = 3 biologically independent samples). Two-sided t test p values: 0.0014, 0.0018, 0.0004, and 0.0002. e Effects of E4bp4 overexpression or knockdown on mRNA expressions of Slc6a1 and Slc6a11 in primary cortex neurons (n = 3 biologically independent samples). Two-sided t test p values: 0.0004, 0.0003, 0.001, and 0.0001. f Effects of E4bp4 on Slc6a1 and Slc6a11 promoter activities (n = 3 biologically independent samples). P values: 0.0002, 0.0001, 0.0033, and 0.0001 (one-way ANOVA and Bonferroni post hoc test). g ChIP assays showing recruitment of E4bp4 protein to Slc6a1 and Slc6a11 promoters (n = 3 biologically independent samples). Two-sided t test p values: 0.0001, 0.4384, 0.0001, and 0.2098. h Knockdown of E4bp4 attenuates the activation effects of Rev-erbα on Slc6a1 and Slc6a11 promoter activities (n = 3 biologically independent samples). Two-sided t test p values: 0.0011 and 0.0003. i Seizure stages of E4bp4−/− and WT mice after injection of kainic acid at ZT6. n = 6 mice per group. P = 0.0008 (two-sided Kruskal–Wallis test). j Seizure parameters (severity, onset, and duration) of E4bp4−/− and WT mice after injection of kainic acid at ZT6. n = 6 mice per group. Two-sided t test p values: <0.0001, <0.0001, and <0.0001. All data are mean ± SEM. * Represents a p value of <0.05. Rel relative, Mut mutation.

Comment in

  • Stopping the Clock on Seizures!
    Fu X, Liu JS, Li P. Fu X, et al. Trends Neurosci. 2021 Jun;44(6):422-423. doi: 10.1016/j.tins.2021.04.002. Epub 2021 May 6. Trends Neurosci. 2021. PMID: 33965214

References

    1. Jimenez-Mateos EM, et al. Silencing microRNA-134 produces neuroprotective and prolonged seizure-suppressive effects. Nat. Med. 2012;18:1087–1094. doi: 10.1038/nm.2834. - DOI - PMC - PubMed
    1. Perucca E, French J, Bialer M. Development of new antiepileptic drugs: challenges, incentives, and recent advances. Lancet Neurol. 2007;6:793–804. doi: 10.1016/S1474-4422(07)70215-6. - DOI - PubMed
    1. Cramer JA, Mintzer S, Wheless J, Mattson RH. Adverse effects of antiepileptic drugs: a brief overview of important issues. Expert Rev. Neurother. 2010;10:885–891. doi: 10.1586/ern.10.71. - DOI - PubMed
    1. Staley K. Molecular mechanisms of epilepsy. Nat. Neurosci. 2015;18:367–372. doi: 10.1038/nn.3947. - DOI - PMC - PubMed
    1. Marvin JS, et al. A genetically encoded fluorescent sensor for in vivo imaging of GABA. Nat. Methods. 2019;16:763–770. doi: 10.1038/s41592-019-0471-2. - DOI - PubMed

Publication types

MeSH terms