. 2021 Feb 22;12(1):1226.
doi: 10.1038/s41467-021-21254-9.

Uniform genomic data analysis in the NCI Genomic Data Commons

Affiliations

Uniform genomic data analysis in the NCI Genomic Data Commons

Zhenyu Zhang et al. Nat Commun. .

Abstract

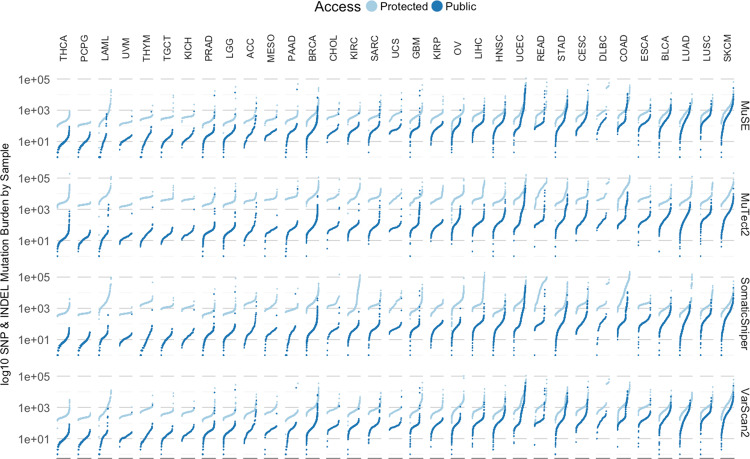
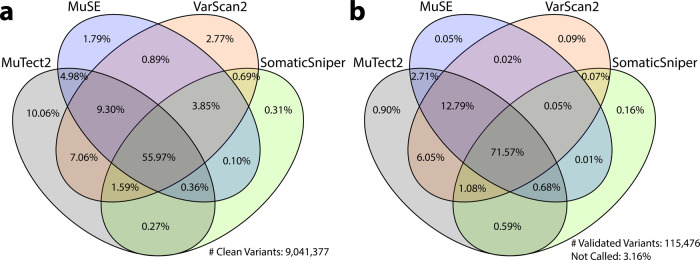
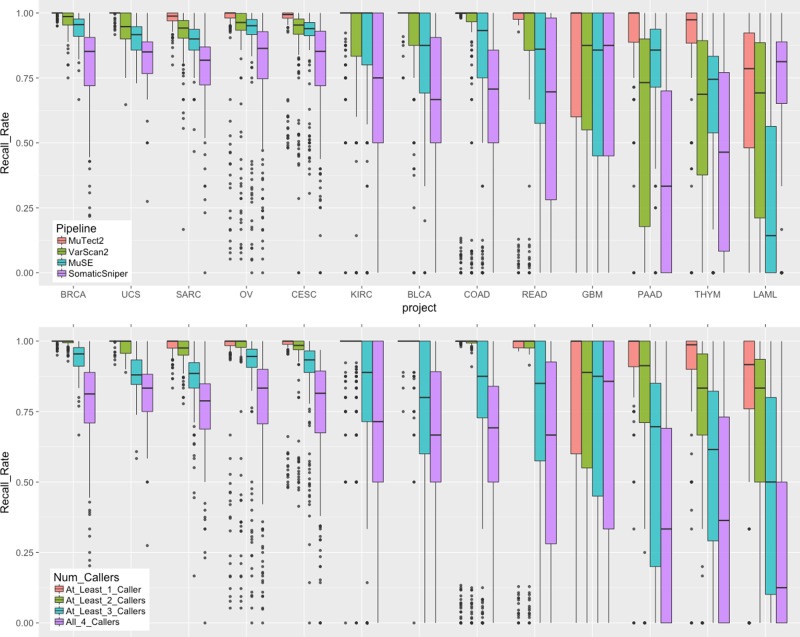
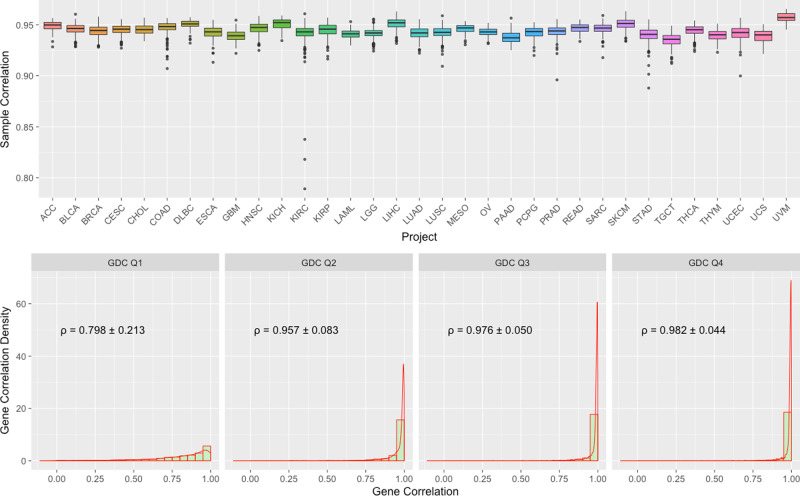
The goal of the National Cancer Institute's (NCI's) Genomic Data Commons (GDC) is to provide the cancer research community with a data repository of uniformly processed genomic and associated clinical data that enables data sharing and collaborative analysis in the support of precision medicine. The initial GDC dataset include genomic, epigenomic, proteomic, clinical and other data from the NCI TCGA and TARGET programs. Data production for the GDC started in June, 2015 using an OpenStack-based private cloud. By June of 2016, the GDC had analyzed more than 50,000 raw sequencing data inputs, as well as multiple other data types. Using the latest human genome reference build GRCh38, the GDC generated a variety of data types from aligned reads to somatic mutations, gene expression, miRNA expression, DNA methylation status, and copy number variation. In this paper, we describe the pipelines and workflows used to process and harmonize the data in the GDC. The generated data, as well as the original input files from TCGA and TARGET, are available for download and exploratory analysis at the GDC Data Portal and Legacy Archive ( https://gdc.cancer.gov/ ).


Conflict of interest statement

The authors declare no competing interests.

Figures

Fig. 1
Fig. 1. Mutation loads of TCGA projects.
GDC-detected somatic variants per sample are displayed by each pipeline (rows), and grouped in each project (columns). Combined counts of point mutations (SNP) and INDELs of either public MAF (dark blue) or protected MAF (light blue) are plotted in separate colors.
Fig. 2
Fig. 2. Comparison of GDC somatic variant caller pipelines.
The Venn Diagram on the left (a) shows the overlap among four GDC somatic callers. Among all clean variants, 56.0% have been identified by all four callers, 15.1% by three callers, 14.0% by two callers, and 14.9% by only one caller. The Venn Diagram on the right (b) shows recall rate of validated TCGA variants by GDC somatic callers. Among 115,476 TCGA validated variants collected, 3.2% are not recalled by any of the GDC pipelines; 1.2% are recalled by only one pipeline; 9.4% are recalled by two pipelines; 14.6% are recalled by three pipelines; and 71.6% are recalled by all four GDC pipelines.
Fig. 3
Fig. 3. Recall rate of TCGA validated variants by project.
In both plots, n = 125/123/192/182/223/141/215/148/48/200/107/57 biologically independent samples for projects BLCA/BRCA/CESC/COAD/KIRC/LAML/OV/PAAD/READ/SARC/THYM/UCS, respectively. Top: Boxplots of recall rate of TCGA validated variants by 13 projects and four GDC somatic variant calling pipelines. Each dot represents a unique tumor sample. Projects are ordered by decreasing average recall rate from left to right. Bottom: Boxplots of recall rate of TCGA validated variants by number of pipelines combined.
Fig. 4
Fig. 4. Boxplots of Spearman correlation between GDC and TCGA mRNA expression.
Top: Boxplots of Sample to Sample Correlation between GDC and TCGA by Project. n = 79/427/1202/309/45/328/48/171/170/546/89/603/321/145/525/423/573/550/86/265/182/186/548/105/265/472/404/156/564/121/199/56/80 biologically independent samples for projects ACC/BLCA/BRCA/CESC/CHOL/COAD/DLBC/ESCA/GBM/HNSC/KICH/KIRC/KIRP/LAML/LGG/LIHC/LUAD/LUSC/MESO/OV/PAAD/PCPG/PRAD/READ/SARC/SKCM/STAD/TGCT/THCA/THYM/UCEC/UCS/UVM, respectively. Bottom: Combined Boxplots and Density Plots of Gene to Gene Correlation between GDC and TCGA. All genes are categorized by four GDC groups (Q1–4) based on their average expression values. Mean and standard deviation of gene to gene Spearman’s correlations are calculated by these four groups.
Fig. 5
Fig. 5. Boxplots of Spearman correlation between GDC and TCGA miRNA expression.
Top: Boxplots of Sample to Sample Correlation between GDC and TCGA by Project. n = 80/429/849/312/45/221/47/198/5/532/91/326/326/103/526/424/498/387/87/461/183/187/547/76/263/452/430/156/569/126/444/56/80 biologically independent samples for projects ACC/BLCA/BRCA/CESC/CHOL/COAD/DLBC/ESCA/GBM/HNSC/KICH/KIRC/KIRP/LAML/LGG/LIHC/LUAD/LUSC/MESO/OV/PAAD/PCPG/PRAD/READ/SARC/SKCM/STAD/TGCT/THCA/THYM/UCEC/UCS/UVM, respectively. Bottom: Combined Boxplots and Density Plots of miRNA to miRNA Correlation between GDC and TCGA by Average Expression Level. All miRNAs are categorized in “Low-Expressed” and “Other” groups. Mean and standard deviation of miRNA to miRNA Spearman’s correlations are shown.
Fig. 6
Fig. 6. 2D t-SNE clustering of 32 TCGA projects.
Combined genomic and epigenomic signals of 4 data types from each TCGA patient, including somatic gene-level copy number, somatic RNA expression, somatic miRNA expression and somatic DNA CpG methylation patterns, are aggregated and superimposed into a 2-dimensional space using t-SNE algorithm. Each dot in the plot represents one patient, and patients from different TCGA projects (and cancer types) are distinguished color and shape of the dot.

References

    1. Grossman RL, et al. Toward a shared vision for cancer genomic data. N. Engl. J. Med. 2016;375:1109–1112. doi: 10.1056/NEJMp1607591. - DOI - PMC - PubMed
    1. Heath, A. P., Ferretti, V., Staudt, L. & Grossman, R. L. The NCI Genomic Data Commons. Unpublished (2020).
    1. Guo Y, et al. Improvements and impacts of GRCh38 human reference on high throughput sequencing data analysis. Genomics. 2017;109:83–90. doi: 10.1016/j.ygeno.2017.01.005. - DOI - PubMed
    1. Genovese G, et al. Using population admixture to help complete maps of the human genome. Nat. Genet. 2013;45:406–414. doi: 10.1038/ng.2565. - DOI - PMC - PubMed
    1. Van Doorslaer K, et al. The Papillomavirus Episteme: a central resource for papillomavirus sequence data and analysis. Nucleic Acids Res. 2012;41:D571–D578. doi: 10.1093/nar/gks984. - DOI - PMC - PubMed

Publication types