. 2021 Feb 22;12(1):1211.
doi: 10.1038/s41467-021-21339-5.

Massive Southern Ocean phytoplankton bloom fed by iron of possible hydrothermal origin

Affiliations

Massive Southern Ocean phytoplankton bloom fed by iron of possible hydrothermal origin

Casey M S Schine et al. Nat Commun. .

Abstract

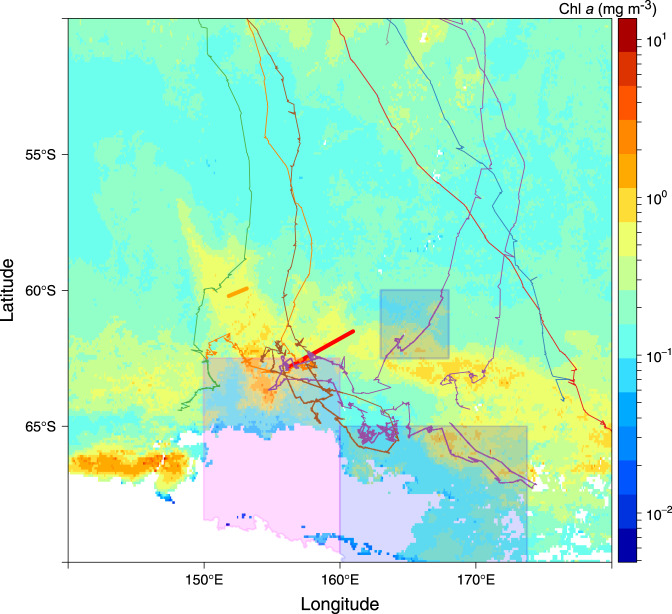
Primary production in the Southern Ocean (SO) is limited by iron availability. Hydrothermal vents have been identified as a potentially important source of iron to SO surface waters. Here we identify a recurring phytoplankton bloom in the high-nutrient, low-chlorophyll waters of the Antarctic Circumpolar Current in the Pacific sector of the SO, that we argue is fed by iron of hydrothermal origin. In January 2014 the bloom covered an area of ~266,000 km2 with depth-integrated chlorophyll a > 300 mg m-2, primary production rates >1 g C m-2 d-1, and a mean CO2 flux of -0.38 g C m-2 d-1. The elevated iron supporting this bloom is likely of hydrothermal origin based on the recurrent position of the bloom relative to two active hydrothermal vent fields along the Australian Antarctic Ridge and the association of the elevated iron with a distinct water mass characteristic of a nonbuoyant hydrothermal vent plume.


Conflict of interest statement

The authors declare no competing interests.

Figures

Fig. 1
Fig. 1. Bathymetry and phytoplankton distribution in the Pacific sector of the Southern Ocean.
On all figures, red and orange lines indicate the positions of the ridges KR1 and KR2, respectively. The positions of southern Antarctic Circumpolar Current (ACC) front (sACCf) and the more southerly positioned southern boundary of the ACC (sbACC), are shown by the white dashed lines in a and b and by the pink lines in c. a Map of Pacific sector bathymetry, with yellow inset box that corresponds to the areas shown in c and d. b Map of Pacific sector climatological net primary production (NPP; 1997–2019), indicating the return of the bloom to the same location most years. c Map of bathymetry and January 2014 geostrophic currents from Dotto et al.. Cruise track is shown as solid gray line. d Map of mean satellite chlorophyll a (Chl a) from November 2013-February 2014 with underway pCO2 overlaid along the cruise track. Stations are indicated by black circles and labeled with a station number. Closed circles indicate stations where a cast to 2000 m was conducted to sample dissolved Fe (DFe). The distance from the center of KR1 to station 150 is 168 km. Bathymetry data are from https://www.ngdc.noaa.gov/mgg/global/. White areas indicate land in a and b and an absence of valid Chl a data in d which is either land, sea-ice, or persistent cloud cover. Note that the satellite Chl a image that covers the bloom period d is a composite of multiple months and the location of the bloom in this image may not exactly match our in situ measurements. The convergence zone visible to the south of our study area c falls within the boundaries of the western side of the Ross Gyre. However, the location of this zone shifts substantially on a monthly timescale and is unlikely to impact the bloom.
Fig. 2
Fig. 2. Biomass and nutrients in the water column in and around the bloom.
Vertical sections of a chlorophyll a (Chl a), b particulate organic carbon (POC), c nitrate, and d dissolved Fe (DFe) from in situ measurements. Note that the depth in panels a and b extends only to 100 m, while the depth in panels c and d extends to 400 m. Station numbers are listed above each section, block dots indicate sampling depths, and black lines show isopycnals. A map of the portion of the cruise shown in these sections and the stations that correspond with the stations here is shown in Fig. 1d. Station 133 is on the map but not included in the section.
Fig. 3
Fig. 3. Water mass characteristics in the bloom versus outside of the bloom.
Depth profiles of a dissolved Fe (DFe) and b vertical diffusivity (Kz) for stations inside the bloom (green lines) and stations outside the bloom (gray lines). c Depth-integrated chlorophyll a (Chl a) versus DFe flux. Density profiles of d DFe, e potential temperature, f salinity, and g oxygen concentration. We do not include error bars for our DFe measurements or our depth-integrated Chl a measurements in either the depth or density profiles because the standard deviation for all DFe measurements was below 0.012 nM, and the error associated with all depth-integrated Chl a measurements was below 0.12%. Stations shown in blue c fall on the edge of the bloom and are not included in the other plots.
Fig. 4
Fig. 4. Position of the bloom relative to factors that promote upwelling along the southern Antarctic Circumpolar (ACC) front (sACCf).
a Net primary production (NPP), b eddy kinetic energy (EKE), c isopycnal pressure, and d bathymetry along the sACCf according to the front positions of Orsi et al.. Supplementary Fig. 2 shows maps of the data used in this figure with the position of the sACCf. The longitudinal position of KR1 and KR2 are shown by the red line and orange line, respectively, on each panel. Bathymetry data are from https://www.ngdc.noaa.gov/mgg/global/.
Fig. 5
Fig. 5. Position of Humpback whales relative to the bloom.
Map of mean chlorophyll a (Chl a) (MODIS/Aqua) from November 2008 through February 2009 overlaid with the position of Humpback whales tagged off the coast of Eden in Southeastern Australia. Humpback whale position data are from Andrews-Goff et al.. The General Protection Zone and Krill Protection Zone of the Ross Sea Marine Protected Area are indicated by the blue boxes and pink box, respectively. The white areas indicate no data due to land or persistent sea-ice and/or cloud cover, and the red and orange lines indicate the positions of the ridges KR1 and KR2, respectively.

References

    1. Marinov I, Gnanadesikan A, Toggweiler JR, Sarmiento JL. The Southern Ocean biogeochemical divide. Nature. 2006;441:964–967. doi: 10.1038/nature04883. - DOI - PubMed
    1. Boyd PW, et al. Mesoscale iron enrichment experiments 1993–2005: Synthesis and future directions. Science. 2007;315:612–617. doi: 10.1126/science.1131669. - DOI - PubMed
    1. de Baar HJW, et al. On iron limitation of the Southern Ocean: experimental observations in the Weddell and Scotia Seas. Mar. Ecol. Prog. Ser. 1990;65:105–122. doi: 10.3354/meps065105. - DOI
    1. Martin JH, Gordon RM, Fitzwater SE. Iron in Antarctic waters. Nature. 1990;345:156–158. doi: 10.1038/345156a0. - DOI
    1. Tagliabue A, et al. Hydrothermal contribution to the oceanic dissolved iron inventory. Nat. Geosci. 2010;3:252–256. doi: 10.1038/ngeo818. - DOI

Publication types