. 2021 Feb 22;12(1):1221.
doi: 10.1038/s41467-021-21463-2.

Antibody affinity maturation and plasma IgA associate with clinical outcome in hospitalized COVID-19 patients

Affiliations

Antibody affinity maturation and plasma IgA associate with clinical outcome in hospitalized COVID-19 patients

Juanjie Tang et al. Nat Commun. .

Abstract

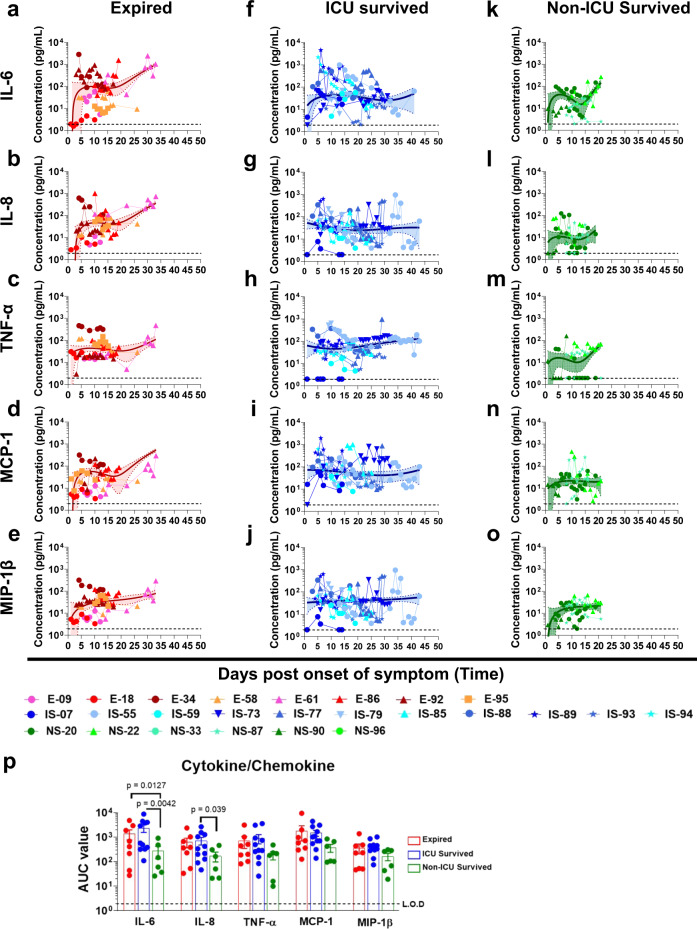
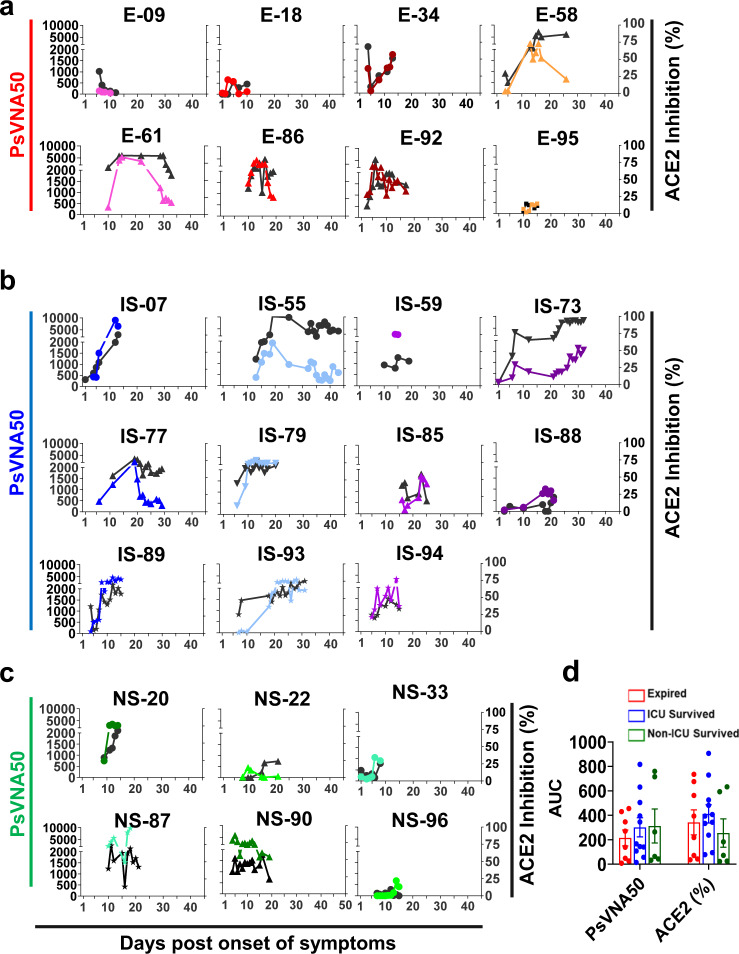
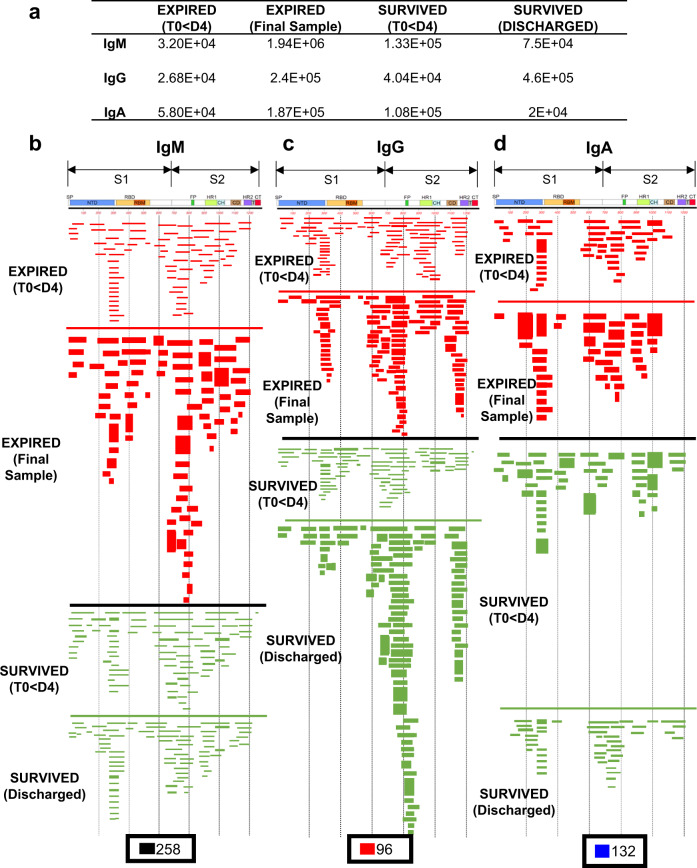
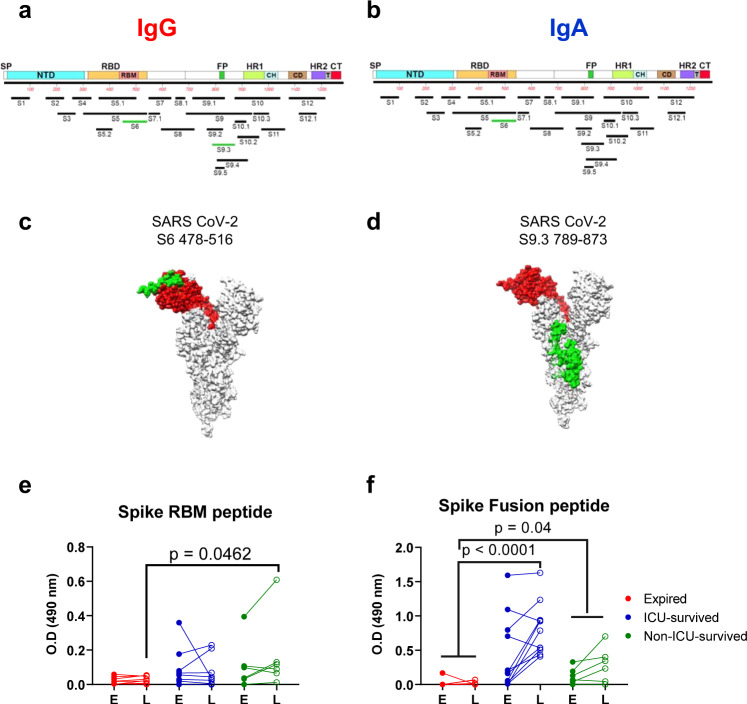
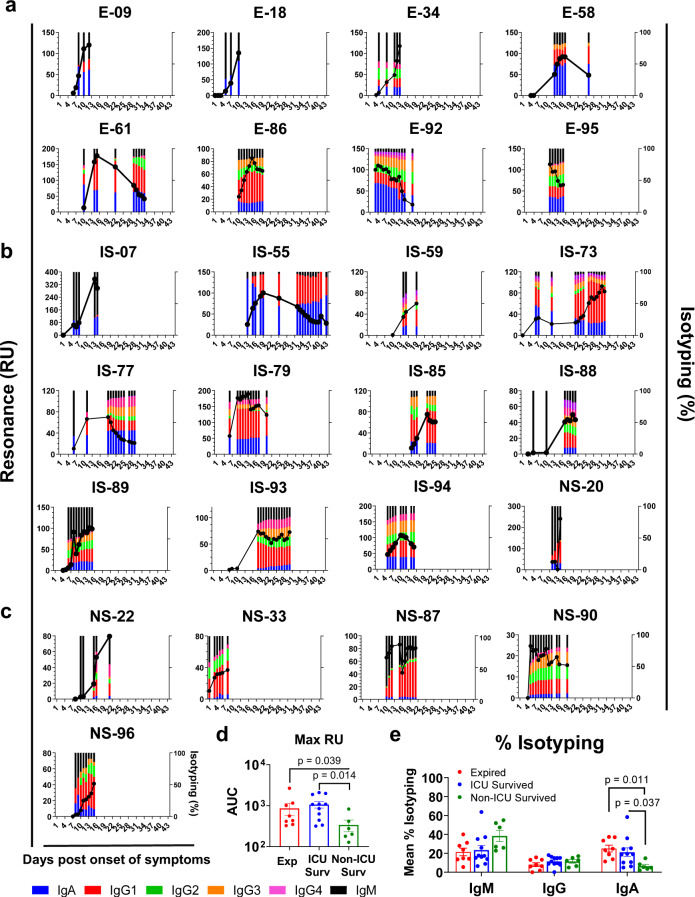
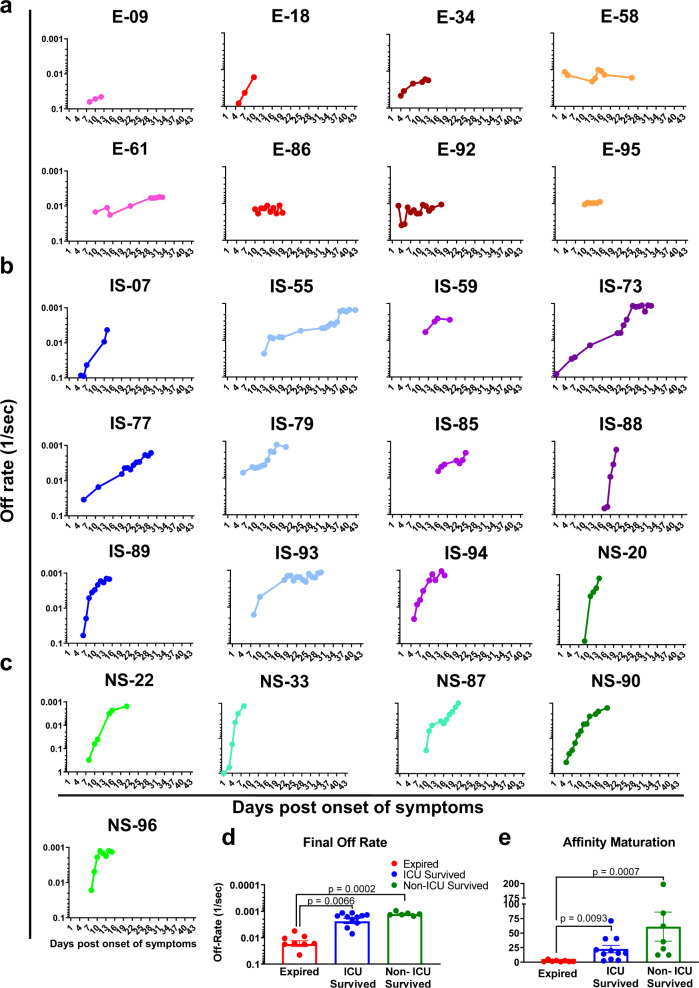
Hospitalized COVID-19 patients often present with a large spectrum of clinical symptoms. There is a critical need to better understand the immune responses to SARS-CoV-2 that lead to either resolution or exacerbation of the clinical disease. Here, we examine longitudinal plasma samples from hospitalized COVID-19 patients with differential clinical outcome. We perform immune-repertoire analysis including cytokine, hACE2-receptor inhibition, neutralization titers, antibody epitope repertoire, antibody kinetics, antibody isotype and antibody affinity maturation against the SARS-CoV-2 prefusion spike protein. Fatal cases demonstrate high plasma levels of IL-6, IL-8, TNFα, and MCP-1, and sustained high percentage of IgA-binding antibodies to prefusion spike compared with non-ICU survivors. Disease resolution in non-ICU and ICU patients associates with antibody binding to the receptor binding motif and fusion peptide, and antibody affinity maturation to SARS-CoV-2 prefusion spike protein. Here, we provide insight into the immune parameters associated with clinical disease severity and disease-resolution outcome in hospitalized patients that could inform development of vaccine/therapeutics against COVID-19.


Conflict of interest statement

The authors declare no competing interests.

Figures

Fig. 1
Fig. 1. Cytokine/chemokine analyses of COVID-19 patients during hospitalization.
Cytokine/chemokine levels in COVID-19 patients at different days post-onset of symptoms. (ae); Expired patients (n = 8), (fj); Survived patients (ICU; n = 11), (ko); Survived patients (non-ICU; n = 6). IL-6 (a, f, and k), IL-8 (b, g, and l), TNFα (c, h, and m), MCP-1 (d, i, and n), and MIP-1β (e, j, and o) concentrations in 4-fold diluted plasma samples at various time-points after hospitalization of the COVID-19 patients were determined via a Bio-Plex Pro Human Cytokine Panel 17-Plex assay. ao Expired patients (patient number’s starting with E); ICU-survived patients (patient number’s starting with IS); and non-ICU survived patients (patient number’s starting with NS). The trendline fits were performed for expired (red), ICU survivors (blue) and non-ICU survivors (green) using a non-linear regression model with polynomial distribution through the origin in Graphpad Prism. The trend line is depicted as solid colored line with the error bands representing 95% confidence interval shown as shaded colored area for each group. p Area under the curve (AUC) was determined for the five cytokine/chemokines from day 1 to day 20 of the three COVID-19 patient groups to control for the window of samples collected. Bar chart shows datapoints for each individual and presented as mean values ± SEM. The statistical significances between the groups of area under curve (AUC values) for “expired” patients (ae; shades of red; n = 8 biologically independent individuals), “ICU-survived” patients (fj; shades of blue; n = 11 biologically independent individuals), and “non-ICU survived” patients (ko; shades of green; n = 6 biologically independent individuals) were determined by non-parametric (Kruskal–Wallis) statistical test using Dunn’s multiple comparisons analysis in GraphPad prism. The differences were considered statistically significant with a 95% confidence interval when the p-value was <0.05.
Fig. 2
Fig. 2. Neutralizing antibody titers and hACE2 receptor inhibition activity of COVID-19 patients’ plasma during hospitalization.
SARS-CoV-2 neutralizing antibody titers (PsVNA50) in plasma at various time-points as determined by pseudovirion neutralization titer 50 (PsVNA50) in Vero E6 cells are shown in colored curves, and the percentage of ACE2 inhibition values at different days post-onset of symptoms are shown in black curves. a “Expired” patients (n = 8); b “ICU-survived” patients (n = 11); and c “non-ICU survived” (n = 6) patients. Expired patients (patient number’s starting with e); ICU-survived patients (patient number’s starting with IS); and non-ICU survived patients (patient number’s starting with NS). Virus neutralization PsVNA50s titers were calculated with GraphPad prism version 8. Percent inhibition of hACE2 binding to RBD in presence of 1:100 dilution of COVID-19 plasma was measured by ELISA. The neutralization and ACE2-inhibition experiments were performed twice independently with similar results. d Area under the curve (AUC) was determined for the PsVNA50 or the percent ACE2 inhibition from day 1 through day 20 of the three COVID-19 patient groups to control for the window of samples collected. Bar chart shows datapoints for each individual and presented as mean values ± SEM. The statistical significances between the groups were determined by non-parametric (Kruskal–Wallis) statistical test using Dunn’s multiple comparisons analysis in GraphPad prism for the area under curve (AUC values) between “expired” patients (red; n = 8 biologically independent individuals), “ICU-survived” patients (blue; n = 11 biologically independent individuals), and “non-ICU survived” patients (green; n = 6 biologically independent individuals) did not identify any statistical significance (p > 0.05).
Fig. 3
Fig. 3. IgM, IgG, and IgA antibody epitope repertoires elicited in expired vs. survived (non-ICU) hospitalized COVID-19 patients.
Distribution of phage clones after affinity selection on plasma samples collected at early vs. late time points from hospitalized patients. a Number of IgM, IgG, and IgA bound phage clones selected using SARS-CoV-2 spike GFPDL on pooled polyclonal samples from “expired” patients (E-18, E-34, and E-58), collected from days 1–4 (Expired—<D4) following symptom onset and the last day before death (Expired— Final sample) or pooled polyclonal samples from “survived” non-ICU COVID-19 patients (NS-33 and NS-90) collected on days 1–4 (Survived—<D4) following symptom onset and the day of discharge (Survived—Discharged) from hospital. bd IgM, IgG, and IgA antibody epitope repertoires of expired (red) vs. survived (green) COVID-19 patients and their alignment to the spike protein of SARS-CoV-2. Graphical distribution of representative clones with a frequency of ≥2, obtained after affinity selection, are shown. The horizontal position and the length of the bars indicate the alignment of peptide sequence displayed on the selected phage clone to its homologous sequence in the SARS-CoV-2 spike. The thickness of each bar represents the frequency of repetitively isolated phage. Scale value for IgM (black), IgG (red), and IgA (blue) is shown enclosed in a black box beneath the respective alignments. The GFPDL affinity selection data was performed in duplicate (two independent experiments by researcher in the lab, who was blinded to sample identity), and similar number of phage clones and epitope repertoire was observed in both phage display analysis.
Fig. 4
Fig. 4. Antibody epitope profile against the Spike protein following SARS-CoV-2 infection.
Antigenic regions/sites within the spike protein recognized by plasma antibodies following SARS-CoV-2 infection (based on data presented in Fig. 3). The amino acid designation is based on the spike protein sequence encoded by the SARS-CoV-2 Wuhan-Hu-1 strain (GenBank: MN908947.3) spike. The antigenic regions/sites discovered using the post-infection antibodies are depicted below the SARS-CoV-2 spike schematic. The epitopes of each protein are numbered in a sequential fashion indicated in black. Antigenic sites shown in green letters (SARS CoV-2 S6 and S9.3) were uniquely recognized by post-SARS-CoV-2 infection IgG (a) or IgA (b) antibodies only in the “survived” but not from expired COVID-19 patients (as shown in Fig. 3). c, d Structural representation of S6 (c) and S9.3 (d) antigenic sites depicted in green on the surface of a monomer in a trimeric spike (PDB#6VSB) with a single receptor-binding domain (RBD) in the up conformation, wherever available using UCSF Chimera software version 1.11.2. The RBD region is shaded in red (residues 319–541) on both structures. e, f Seroreactivity of COVID-19 plasma samples with the selected synthetic peptides covering epitope S6 (receptor-binding motif; RBM) and peptide S9.3 (fusion peptide; FP). Absorbance at 100-fold dilution of early first sample (E) or last (L) sample from SARS-CoV-2 infected individuals were tested for binding to RBM (panel e) and FP (panel f) in IgG ELISA. The statistical significances between “expired” patients (red; n = 8 biologically independent individuals), “ICU-survived” patients (blue; n = 11 biologically independent individuals), and “non-ICU survived” patient (green; n = 6 biologically independent individuals) groups were determined by non-parametric (Kruskal–Wallis) statistical test using Dunn’s multiple comparisons analysis in GraphPad prism. p-values <0.05 were considered significant with a 95% confidence interval.
Fig. 5
Fig. 5. Evolution of antibody binding and antibody isotype following SARS-CoV-2 infection in COVID-19 patients and association with disease severity.
Serial dilutions of each plasma sample collected at different time points from the COVID-19 patients were analyzed for antibody binding to purified SARS-CoV-2 prefusion spike ectodomain (aa 16-1213) lacking the cytoplasmic and transmembrane domains (delta CT-TM), and containing His tag at C-terminus, was produced in FreeStyle293-F mammalian cells. Total antibody binding is represented as SPR maximum resonance units (RU) (black curves) of 10-fold diluted plasma samples from expired patients (a; patient number’s starting with E; n = 8), ICU-surviving patients (b; patient number’s starting with IS; n = 11) and non-ICU surviving patients (c; patient number’s starting with NS; n = 6). Isotype composition of plasma antibodies bound to SARS-CoV-2 spike prefusion protein for each individual COVID-19 patient at different time-points as measured in SPR. The resonance units for each antibody isotype was divided by the total resonance units for all the antibody isotypes combined to calculate the percentage of each antibody isotype (according to the color codes; IgM, black; IgA, blue; IgG1, red; IgG2 green; IgG3, orange; IgG4, fuchsia). All SPR experiments were performed twice blindly. The variation for each sample in duplicate SPR runs was <5%. d The area under the curve (AUC) of SARS-CoV-2 prefusion spike binding antibody levels (Max RU) for the COVID-19 patients who expired (red; n = 8 biologically independent individuals) vs. ICU-survived (blue; n = 11 biologically independent individuals) vs. non-ICU survived (green; n = 6 biologically independent individuals). Bar chart shows datapoints for each individual and presented as mean values ± SEM. e AUC of mean percentages of antibody isotypes IgM, IgG, IgA) bound to SARS-CoV-2 prefusion spike for the COVID-19 patients who expired (red; n = 8 biologically independent individuals) vs. ICU-survived (blue; n = 11 biologically independent individuals) vs. non-ICU survived (green; n = 6 biologically independent individuals). Bar chart shows datapoints for each individual and presented as mean values ± SEM. The statistical significances between the groups were determined by non-parametric (Kruskal–Wallis) statistical test using Dunn’s multiple comparisons analysis in GraphPad prism. The differences were considered statistically significant with a 95% confidence interval when the p-value was <0.05.
Fig. 6
Fig. 6. Antibody affinity maturation of human antibody response following SARS-CoV-2 infection in COVID-19 patients and association with clinical outcome.
ac Polyclonal antibody affinity to SARS-CoV-2 prefusion spike protein for COVID-19 patients at different time-points post-onset of symptoms was determined by SPR. Binding affinity was determined for individual COVID-19 patients, a expired (in red shades; patient number’s starting with E; n = 8); b ICU-survived (in blue shades; patient number’s starting with IS; n = 11); c non-ICU survived (in green shades; patient number’s starting with NS; n = 6). Antibody off-rate constants that describe the fraction of antibody–antigen complexes decaying per second were determined directly from the plasma sample interaction with SARS-CoV-2 prefusion spike protein using SPR in the dissociation phase as described in Materials and Methods. All SPR experiments were performed twice blindly. The variation for each sample in duplicate SPR runs was <5%. The data shown is average value of two experimental runs. Off-rate was calculated and shown only for the samples that demonstrated a measurable (>5 RU) antibody binding in SPR. d The average antibody affinity against SARS-CoV-2 prefusion spike is shown for the final day samples from the COVID-19 patients who expired (red; n = 8 biologically independent individuals) vs. ICU-survived (blue; n = 11 biologically independent individuals) vs. non-ICU survived (green; n = 6 biologically independent individuals). Bar chart shows datapoints for each individual and presented as mean values ± SEM. e Fold-change in antibody affinity against SARS-CoV-2 prefusion spike was calculated for the final day samples compared with the first day sample from each of the COVID-19 patients who expired (red; n = 8 biologically independent individuals) vs. ICU-survived (blue; n = 11 biologically independent individuals) vs. non-ICU survived (green; n = 6 biologically independent individuals). Bar chart shows datapoints for each individual and presented as mean values ± SEM. The statistical significances between the groups were determined by non-parametric (Kruskal–Wallis) statistical test using Dunn’s multiple comparisons analysis in GraphPad prism. The differences were considered statistically significant with a 95% confidence interval when the p-value was <0.05.

Similar articles

Cited by

References

    1. Johns Hopkins University & Medicine Center for Systems Science and Engineering (CSSE). Coronavirus COVID-19 Global Cases. 2020 [cited 12 May 2020] Available from: https://coronavirus.jhu.edu/map.html. (2020).
    1. Wu, Z. & McGoogan, J. M. Characteristics of and important lessons from the coronavirus disease 2019 (COVID-19) outbreak in china: summary of a report of 72314 cases from the Chinese Center for disease control and prevention. JAMA323, 1239–1242 (2020). - PubMed
    1. Mehta P, et al. COVID-19: consider cytokine storm syndromes and immunosuppression. Lancet. 2020;395:1033–1034. doi: 10.1016/S0140-6736(20)30628-0. - DOI - PMC - PubMed
    1. Huang C, et al. Clinical features of patients infected with 2019 novel coronavirus in Wuhan, China. Lancet. 2020;395:497–506. doi: 10.1016/S0140-6736(20)30183-5. - DOI - PMC - PubMed
    1. Carsana, L. et al. Pulmonary post-mortem findings in a series of COVID-19 cases from northern Italy: a two-centre descriptive study. Lancet Infect. Dis.20, 1135–1140 (2020). - PMC - PubMed

Publication types

MeSH terms