. 2021 Feb 22;12(1):1209.
doi: 10.1038/s41467-021-21461-4.

Fructose reprogrammes glutamine-dependent oxidative metabolism to support LPS-induced inflammation

Affiliations

Fructose reprogrammes glutamine-dependent oxidative metabolism to support LPS-induced inflammation

Nicholas Jones et al. Nat Commun. .

Abstract

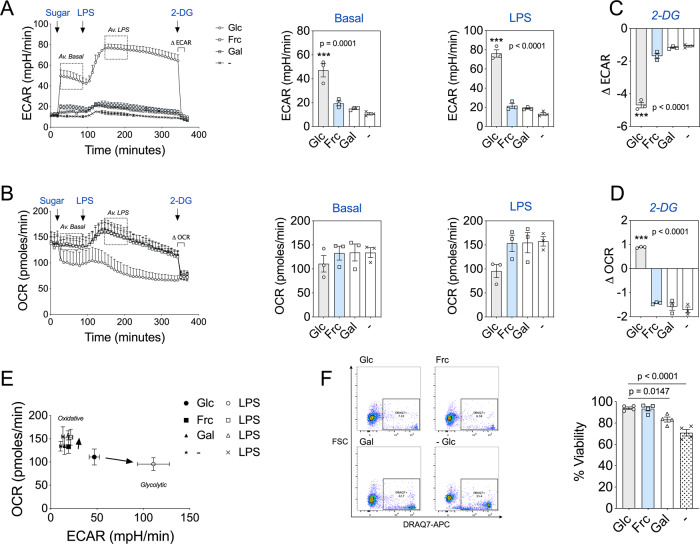
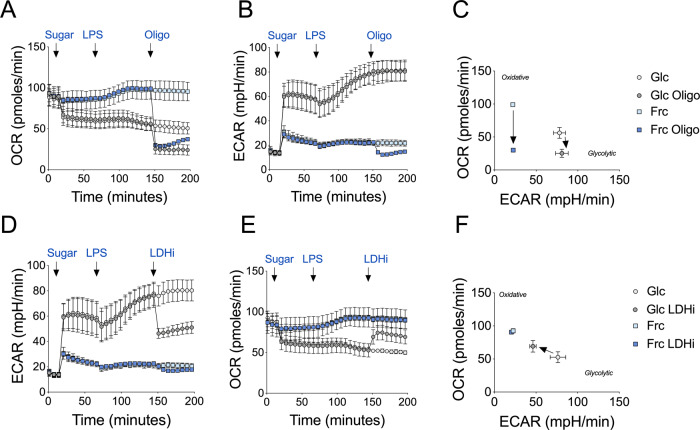
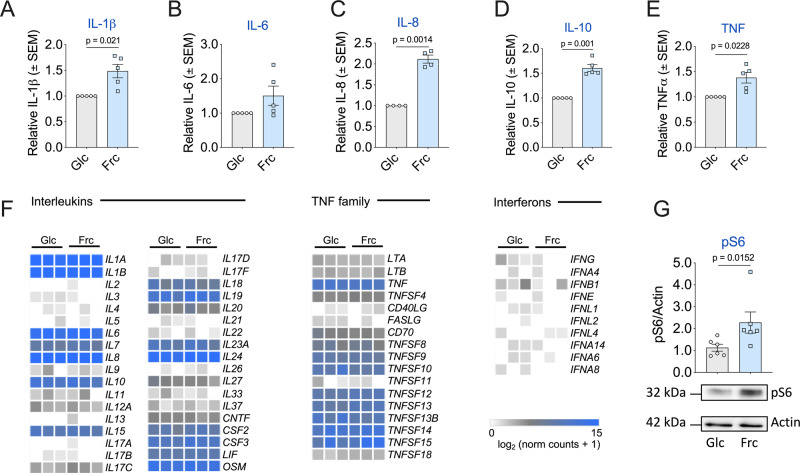
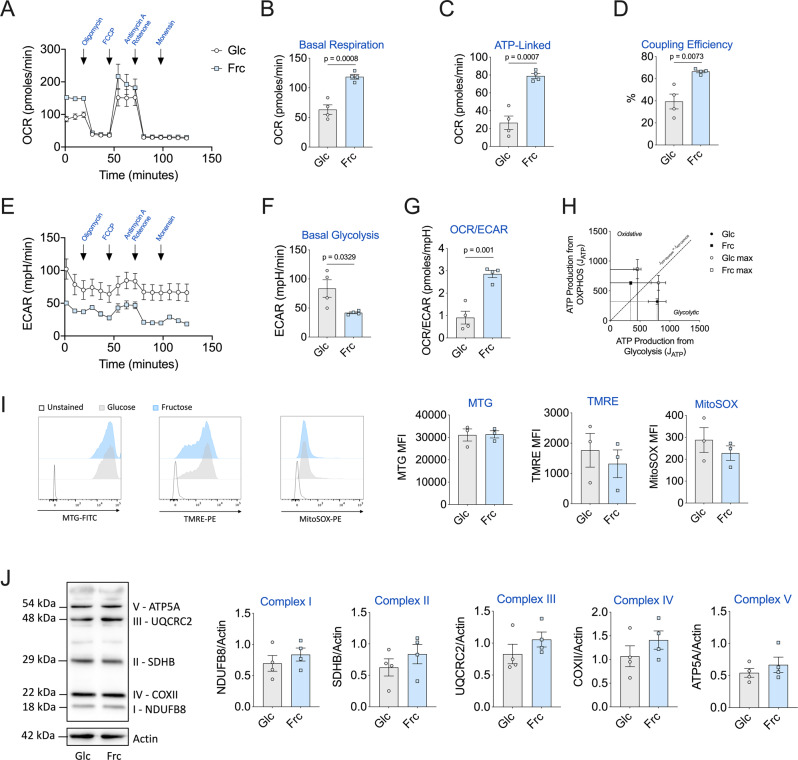
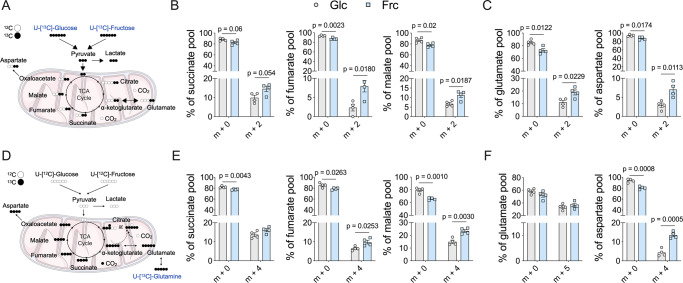
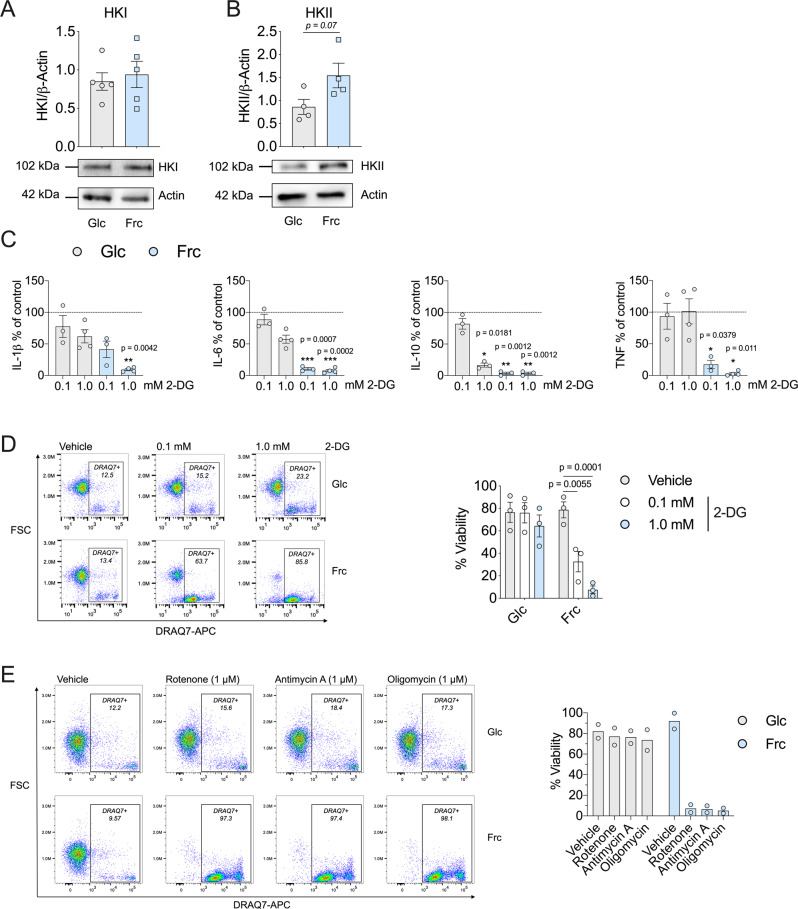
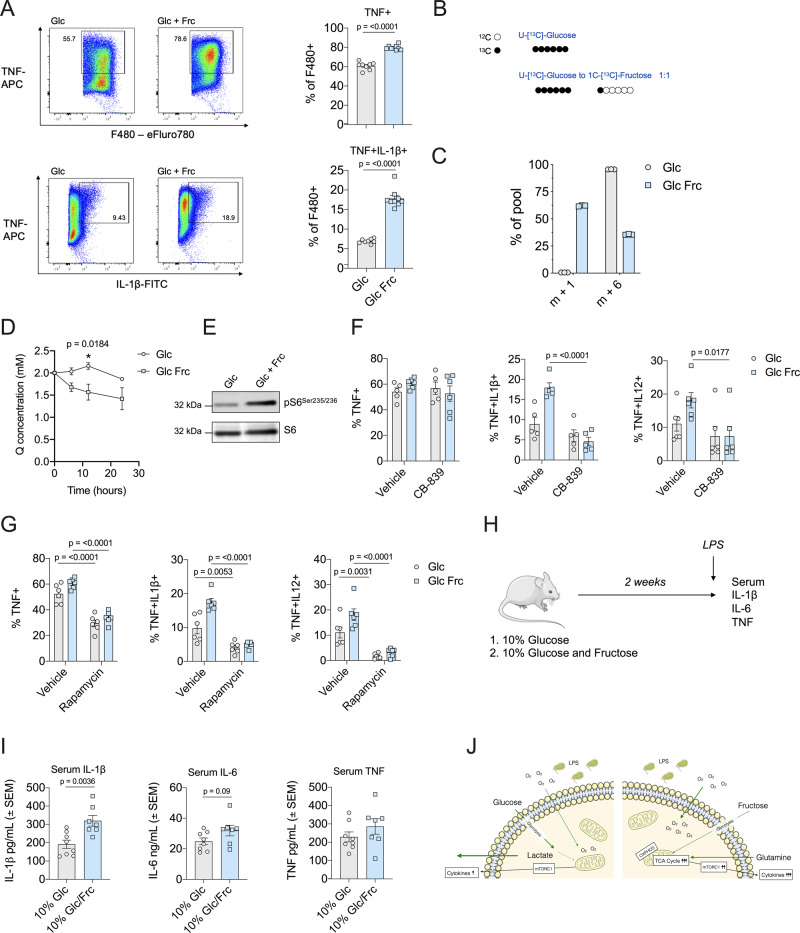
Fructose intake has increased substantially throughout the developed world and is associated with obesity, type 2 diabetes and non-alcoholic fatty liver disease. Currently, our understanding of the metabolic and mechanistic implications for immune cells, such as monocytes and macrophages, exposed to elevated levels of dietary fructose is limited. Here, we show that fructose reprograms cellular metabolic pathways to favour glutaminolysis and oxidative metabolism, which are required to support increased inflammatory cytokine production in both LPS-treated human monocytes and mouse macrophages. A fructose-dependent increase in mTORC1 activity drives translation of pro-inflammatory cytokines in response to LPS. LPS-stimulated monocytes treated with fructose rely heavily on oxidative metabolism and have reduced flexibility in response to both glycolytic and mitochondrial inhibition, suggesting glycolysis and oxidative metabolism are inextricably coupled in these cells. The physiological implications of fructose exposure are demonstrated in a model of LPS-induced systemic inflammation, with mice exposed to fructose having increased levels of circulating IL-1β after LPS challenge. Taken together, our work underpins a pro-inflammatory role for dietary fructose in LPS-stimulated mononuclear phagocytes which occurs at the expense of metabolic flexibility.


Conflict of interest statement

K.H.V. is on the board of directors and shareholder of Bristol Myers Squibb, a shareholder of GRAIL, and on the science advisory board of PMV Pharma, RAZE Therapeutics, Volastra Pharmaceuticals and Ludwig Cancer. K.H.V. is a co-founder and consultant of Faeth Therapeutics, funded by Khosla Ventures. All other authors declare no competing interests.

Figures

Fig. 1
Fig. 1. Fructose mimics a metabolic profile akin to nutrient restriction.
A Seahorse extracellular flux analysis of ECAR in monocytes before and following injections of glucose, fructose, galactose (11.1 mM) or no sugar, LPS (10 ng/mL) and 2-DG (100 mM) at the time points indicated with average basal (Av. basal) and LPS-stimulated (Av. LPS) ECAR values. B Analysis of OCR in monocytes with the same injections as in panel (A), including average basal (Av. basal) and LPS-stimulated (Av. LPS) OCR values. C Change in ECAR (Δ ECAR) post 2-DG treatment. D Change in OCR (Δ OCR) post 2-DG treatment. E OCR versus ECAR map of average basal and LPS-stimulated values for glucose, fructose, galactose and no sugar treatment groups. Arrows indicate the shift in metabolism from average basal to average LPS. F Representative flow cytometry plot and DRAQ7 viability measurements of glucose, fructose, galactose and no sugar monocytes cultured for 24 h with LPS (10 ng/mL). Statistical significance was assessed using a one-way ANOVA with Dunnett’s (AD) or Tukey’s (F) multiple comparisons test. Data are either representative of either three (AE) or four independent experiments (F). Data are expressed as mean ± SEM; ***p ≤ 0.001. Source data are provided as a Source Data file.
Fig. 2
Fig. 2. Fructose treatment enhances oxidative metabolism.
Seahorse extracellular flux analysis of A OCR and B ECAR in monocytes before and following injections of glucose or fructose (both 11.1 mM), LPS (10 ng/mL) and oligomycin (1 µM) at the time points indicated. C OCR versus ECAR map of average of a single value pre- and post-oligomycin injection for glucose- and fructose-treated monocytes. Arrows indicate the shift in metabolism upon inhibitor exposure. Analysis of D ECAR and E OCR in monocytes as A with a final injection of a lactate dehydrogenase inhibitor (GSK2837808A, LDHi; 10 µM). F OCR versus ECAR map as C with pre- and post- LDHi injection. Data are representative of three independent experiments and are expressed as mean ± SEM. Source data are provided as a Source Data file.
Fig. 3
Fig. 3. Fructose promotes a more inflammatory phenotype.
Extracellular cytokine release of A IL-1β, B IL-6, C IL-8, D IL-10 and E TNF. F Heatmaps displaying the normalised read counts of selected cytokines from RNA-seq analysis of monocytes treated with glucose or fructose (both 11.1 mM) stimulated with LPS (10 ng/mL) for 24 h. G Representative immunoblot and pooled data of downstream mTOR target pS6 with housekeeping control, actin. Statistical significance was assessed using a one-sample t test (AE) or an unpaired, two-tailed t test (G). Data are representative of five (A, B, D, E), four (C), three (F) and six independent experiments (G) and are expressed as mean ± SEM. Source data are provided as a Source Data file.
Fig. 4
Fig. 4. Fructose-induced oxidative phenotype is maintained in LPS-stimulated monocytes.
A Mitochondrial stress assay of monocytes cultured for 24 h in the presence of glucose or fructose (both 11.1 mM) and activated with LPS (10 ng/mL). Corresponding OCR measured with injections of oligomycin (1 µM), FCCP (3 µM), antimycin A (1 µM) and rotenone (1 µM) and monensin (20 µM). Respective mitochondrial parameters B basal respiration, C ATP-linked respiration and D coupling efficiency calculated via ATP-linked respiration/basal respiration. E Equivalent ECAR rate measured with f basal glycolysis levels. G OCR/ECAR ratio calculated by basal respiration/basal glycolysis levels. H Bioenergetic scope examining the ATP production (JATP) of oxidative phosphorylation versus glycolysis of basal and maximal of glucose or fructose. Mitochondrial parameters i Content: MitoTracker Green (MTG), membrane potential: tetramethylrhodamine ethyl ester (TMRE) and mitochondrial-derived ROS: MitoSOX measured by flow cytometry. J Mitochondrial respiratory complex (I–V) assessment by western blot. Statistical significance was assessed using an unpaired, two-tailed t test (BD, FB). Data are representative of four (AH, J) or three (I) independent experiments. Data are expressed as mean ± SEM. Source data are provided as a Source Data file.
Fig. 5
Fig. 5. Fructose treatment induces elevated metabolic cycling.
A Stable isotope tracing of uniformly labelled 13C-glucose or 13C-fructose into the TCA cycle. B Mass isotopologue distribution (MID) represented as a % pool of TCA cycle metabolites: succinate, fumarate and malate or C amino acids: glutamate and aspartate of 24-h LPS-stimulated monocytes. Numbers on the x-axis represent the number of 13Carbons incorporated. D Stable isotope tracing of uniformly labelled 13C-glutamine in the presence of 12C-glucose or 12C-fructose of 24-h LPS-stimulated monocytes. E MID of succinate, fumarate and malate and F amino acids: glutamate and aspartate. Statistical significance of individual mass isotopomers was assessed using an unpaired, two-tailed t test (B, C, E, F). Data are representative of four independent experiments and are expressed as mean ± SEM. Source data are provided as a Source Data file.
Fig. 6
Fig. 6. Fructose-induced inflammatory monocytes are sensitive to metabolic inhibition.
Immunoblot of LPS-stimulated monocytes in the presence of glucose or fructose with A hexokinase I or B hexokinase II analysed. C Cytokine release (% of control) of IL-1β, IL-6, IL-10 and TNF (dotted line indicates control) and D representative flow cytometry plot including DRAQ7 viability of glucose or fructose LPS-stimulated monocytes in the presence or absence of glycolytic inhibitor, 2-DG (0.1 or 1.0 mM). E Representative flow cytometry plot including DRAQ7 viability of glucose or fructose LPS-stimulated monocytes in the presence or absence of complex I inhibitor, rotenone (1 µM), complex III inhibitor antimycin A (1 µM) or complex V inhibitor, oligomycin (1 µM). Statistical significance was assessed using an unpaired, two-tailed t test (A, B) or a two-way ANOVA with Sidak’s multiple comparison test (C, D). Data are representative of five (A), four (B), three–four (C), three (D) or two independent experiments (E) and are expressed as mean ± SEM; *p ≤ 0.05, **p ≤ 0.01 and ***p ≤ 0.001. Source data are provided as a Source Data file.
Fig. 7
Fig. 7. Fructose enhances inflammation in the presence of glucose in macrophages.
A Representative TNF and IL-1β flow cytometry plots and bar graphs of glucose (24 mM) or glucose and fructose (both 12 mM) cultured mouse macrophages treated with LPS (1 ng/mL) for 5 h in the presence of GolgiStopTM. B Schematic of 13C6-glucose (10 mM) or 13C6-glucose (5 mM) and 13C1-fructose (5 mM) isotope tracing. C Hexose isotopologues, m + 1 or m + 6, in mouse macrophages stimulated with LPS (1 ng/mL) for 24 h. D Glutamine uptake in the media of BMDMs cultured with 24 mM glucose or 12 mM glucose and 12 mM fructose stimulated with LPS (1 ng/mL) for 0, 12 and 24 h. E Immunoblot analysis for pS6Ser235-236 in BMDMs stimulated with LPS overnight in the presence of glucose alone or glucose/fructose. Total S6 was used as a loading control. F Cytokine production assessed by flow cytometry and ICS for TNF, IL-1β and IL-12 of macrophages treated for 18 h with CB-839 (1 μM). G Cytokine production of TNF, IL-1β and IL-12 produced by macrophages cultured as A with or without rapamycin (50 μM). H Schematic of in vivo experiment. Mice fed a diet of 10% glucose (n = 8) or 10% glucose–fructose mixture (n = 7) for 2 weeks and stimulated with LPS (0.1 mg/kg) for 3 h (image of mouse obtained from Servier Medical Art). I Serum cytokine levels of IL-1β, IL-6 and TNF. J Schematic outlining fructose metabolism promoting inflammation. mTORC1 mammalian target of rapamycin complex 1, OXPHOS oxidative phosphorylation, TCA tricarboxylic acid. Statistical significance was assessed using an unpaired, two-tailed t test (A, I) or a two-way ANOVA with Sidak’s multiple comparison test (D, F, G). Data are representative of five (A), two (B, C), three (DG) or seven–eight independent experiments (I) and are expressed as mean ± SEM. Source data are provided as a Source Data file.

References

    1. Diskin C, Pålsson-McDermott EM. Metabolic modulation in macrophage effector function. Front. Immunol. 2018;9:270. doi: 10.3389/fimmu.2018.00270. - DOI - PMC - PubMed
    1. Izquierdo E, et al. Reshaping of human macrophage polarization through modulation of glucose catabolic pathways. J. Immunol. 2015;195:2442–2451. doi: 10.4049/jimmunol.1403045. - DOI - PubMed
    1. Raulien N, et al. Fatty acid oxidation compensates for lipopolysaccharide-induced Warburg effect in glucose-deprived monocytes. Front. Immunol. 2017;8:609. doi: 10.3389/fimmu.2017.00609. - DOI - PMC - PubMed
    1. Lee MKS, et al. Glycolysis is required for LPS-induced activation and adhesion of human CD14+ CD16− monocytes. Front. Immunol. 2019;10:2054. doi: 10.3389/fimmu.2019.02054. - DOI - PMC - PubMed
    1. Domínguez-Andrés J, et al. Rewiring monocyte glucose metabolism via C-type lectin signaling protects against disseminated candidiasis. PLoS Pathog. 2017;13:e1006632. doi: 10.1371/journal.ppat.1006632. - DOI - PMC - PubMed

Publication types

MeSH terms