

Immune classification of clear cell renal cell carcinoma
- PMID: 33619294
- PMCID: PMC7900197
- DOI: 10.1038/s41598-021-83767-z
Immune classification of clear cell renal cell carcinoma
Abstract
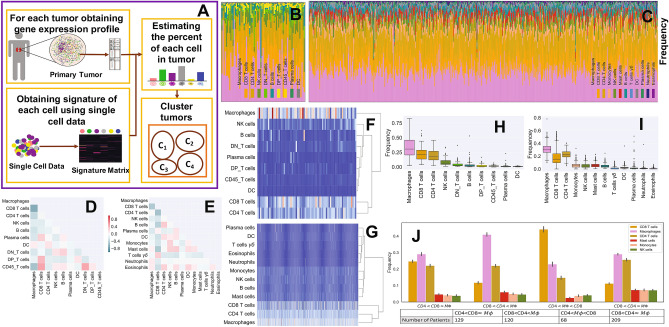
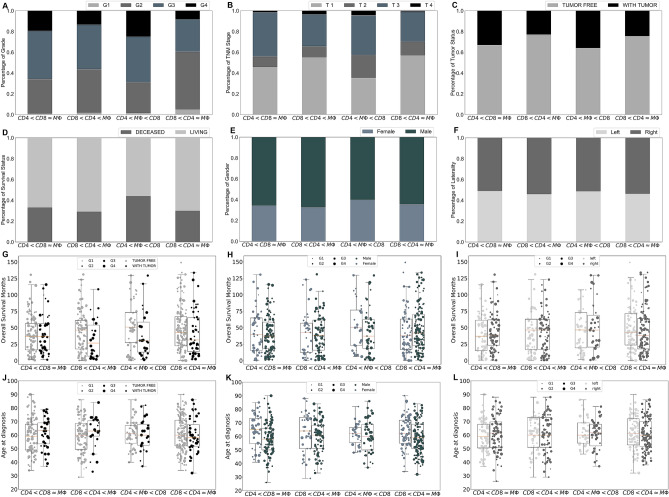
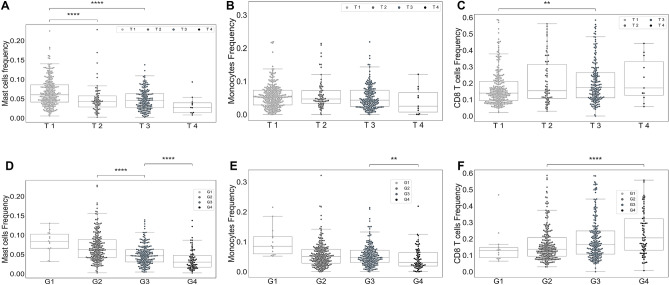
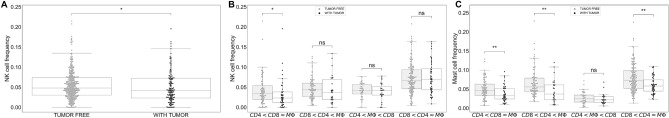
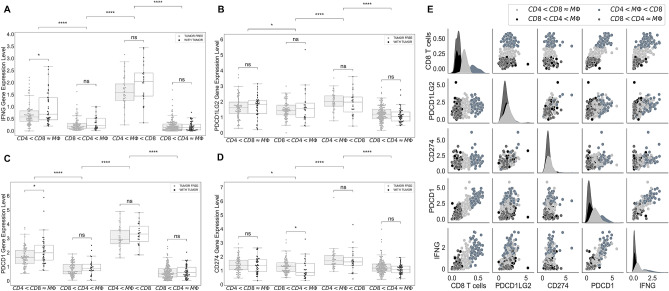
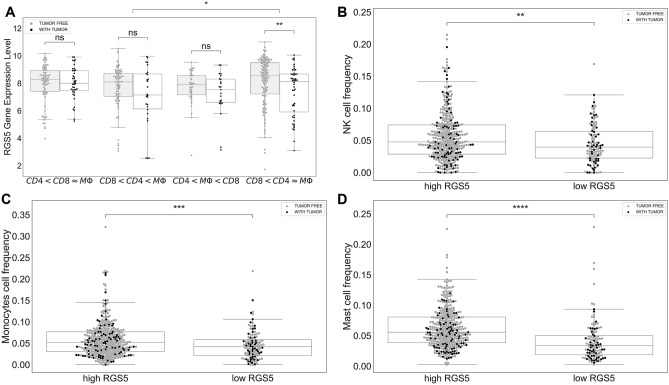
Since the outcome of treatments, particularly immunotherapeutic interventions, depends on the tumor immune micro-environment (TIM), several experimental and computational tools such as flow cytometry, immunohistochemistry, and digital cytometry have been developed and utilized to classify TIM variations. In this project, we identify immune pattern of clear cell renal cell carcinomas (ccRCC) by estimating the percentage of each immune cell type in 526 renal tumors using the new powerful technique of digital cytometry. The results, which are in agreement with the results of a large-scale mass cytometry analysis, show that the most frequent immune cell types in ccRCC tumors are CD8+ T-cells, macrophages, and CD4+ T-cells. Saliently, unsupervised clustering of ccRCC primary tumors based on their relative number of immune cells indicates the existence of four distinct groups of ccRCC tumors. Tumors in the first group consist of approximately the same numbers of macrophages and CD8+ T-cells and and a slightly smaller number of CD4+ T cells than CD8+ T cells, while tumors in the second group have a significantly high number of macrophages compared to any other immune cell type (P-value [Formula: see text]). The third group of ccRCC tumors have a significantly higher number of CD8+ T-cells than any other immune cell type (P-value [Formula: see text]), while tumors in the group 4 have approximately the same numbers of macrophages and CD4+ T-cells and a significantly smaller number of CD8+ T-cells than CD4+ T-cells (P-value [Formula: see text]). Moreover, there is a high positive correlation between the expression levels of IFNG and PDCD1 and the percentage of CD8+ T-cells, and higher stage and grade of tumors have a substantially higher percentage of CD8+ T-cells. Furthermore, the primary tumors of patients, who are tumor free at the last time of follow up, have a significantly higher percentage of mast cells (P-value [Formula: see text]) compared to the patients with tumors for all groups of tumors except group 3.
Conflict of interest statement
The authors declare no competing interests.
Figures
Similar articles
-
Upregulated GSDMB in Clear Cell Renal Cell Carcinoma Is Associated with Immune Infiltrates and Poor Prognosis.J Immunol Res. 2021 Dec 16;2021:7753553. doi: 10.1155/2021/7753553. eCollection 2021. J Immunol Res. 2021. PMID: 34957313 Free PMC article.
-
Tumor-infiltrating CD39+CD8+ T cells determine poor prognosis and immune evasion in clear cell renal cell carcinoma patients.Cancer Immunol Immunother. 2020 Aug;69(8):1565-1576. doi: 10.1007/s00262-020-02563-2. Epub 2020 Apr 18. Cancer Immunol Immunother. 2020. PMID: 32306075 Free PMC article.
-
PTP4A3 Is a Prognostic Biomarker Correlated With Immune Infiltrates in Papillary Renal Cell Carcinoma.Front Immunol. 2021 Sep 23;12:717688. doi: 10.3389/fimmu.2021.717688. eCollection 2021. Front Immunol. 2021. PMID: 34630392 Free PMC article.
-
Double-Multiplex Immunostainings for Immune Profiling of Invasive Breast Carcinoma: Emerging Novel Immune-Based Biomarkers.Int J Mol Sci. 2025 Mar 21;26(7):2838. doi: 10.3390/ijms26072838. Int J Mol Sci. 2025. PMID: 40243442 Free PMC article. Review.
-
Tumor Microenvironment Dynamics in Clear-Cell Renal Cell Carcinoma.Cancer Discov. 2019 Oct;9(10):1349-1357. doi: 10.1158/2159-8290.CD-19-0499. Epub 2019 Sep 16. Cancer Discov. 2019. PMID: 31527133 Free PMC article. Review.
Cited by
-
A Mathematical Model of Breast Tumor Progression Based on Immune Infiltration.J Pers Med. 2021 Oct 15;11(10):1031. doi: 10.3390/jpm11101031. J Pers Med. 2021. PMID: 34683171 Free PMC article.
-
Investigating Optimal Chemotherapy Options for Osteosarcoma Patients through a Mathematical Model.Cells. 2021 Aug 6;10(8):2009. doi: 10.3390/cells10082009. Cells. 2021. PMID: 34440778 Free PMC article.
-
Construction of a Necroptosis-Related lncRNA Signature for Predicting Prognosis and Immune Response in Kidney Renal Clear Cell Carcinoma.Cells. 2022 Dec 23;12(1):66. doi: 10.3390/cells12010066. Cells. 2022. PMID: 36611858 Free PMC article.
-
Identification of a competing endogenous RNA network related to immune signature in clear cell renal cell carcinoma.Aging (Albany NY). 2021 Dec 27;13(24):25980-26002. doi: 10.18632/aging.203784. Epub 2021 Dec 27. Aging (Albany NY). 2021. PMID: 34958632 Free PMC article.
-
MMP25-AS1/hsa-miR-10a-5p/SERPINE1 axis as a novel prognostic biomarker associated with immune cell infiltration in KIRC.Mol Ther Oncolytics. 2021 Aug 6;22:307-325. doi: 10.1016/j.omto.2021.07.008. eCollection 2021 Sep 24. Mol Ther Oncolytics. 2021. PMID: 34553021 Free PMC article.
References
Publication types
MeSH terms
Substances
Grants and funding
LinkOut - more resources
Full Text Sources
Other Literature Sources
Medical
Research Materials
