. 2021 Feb 22;11(1):4320.
doi: 10.1038/s41598-021-83761-5.

Serine 477 plays a crucial role in the interaction of the SARS-CoV-2 spike protein with the human receptor ACE2

Affiliations

Serine 477 plays a crucial role in the interaction of the SARS-CoV-2 spike protein with the human receptor ACE2

Amit Singh et al. Sci Rep. .

Abstract

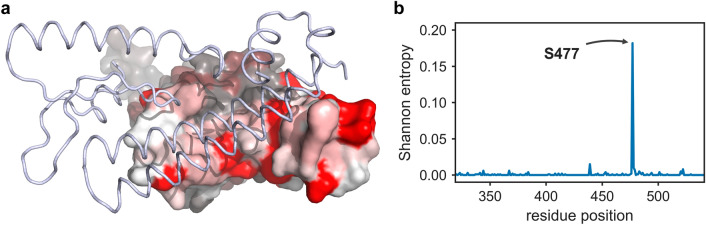
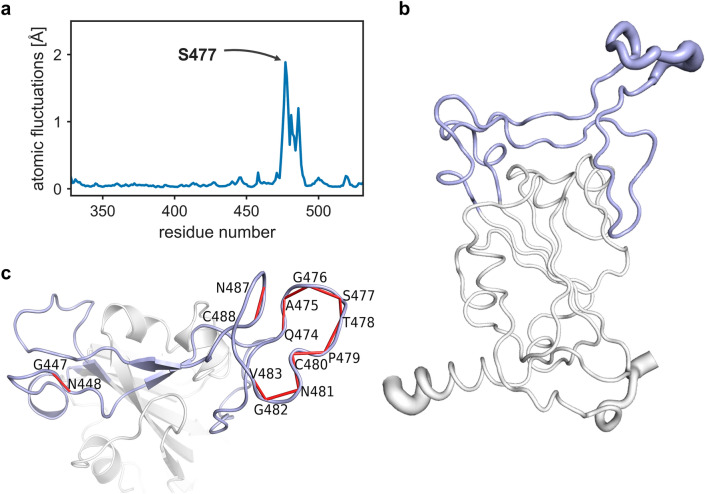
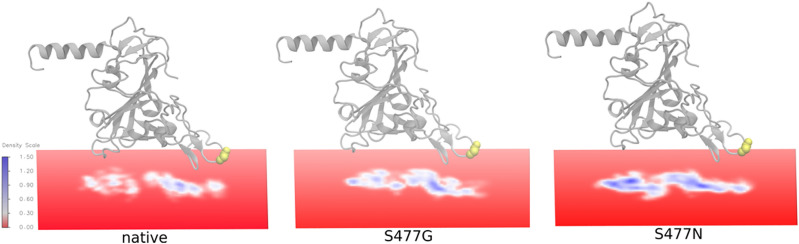
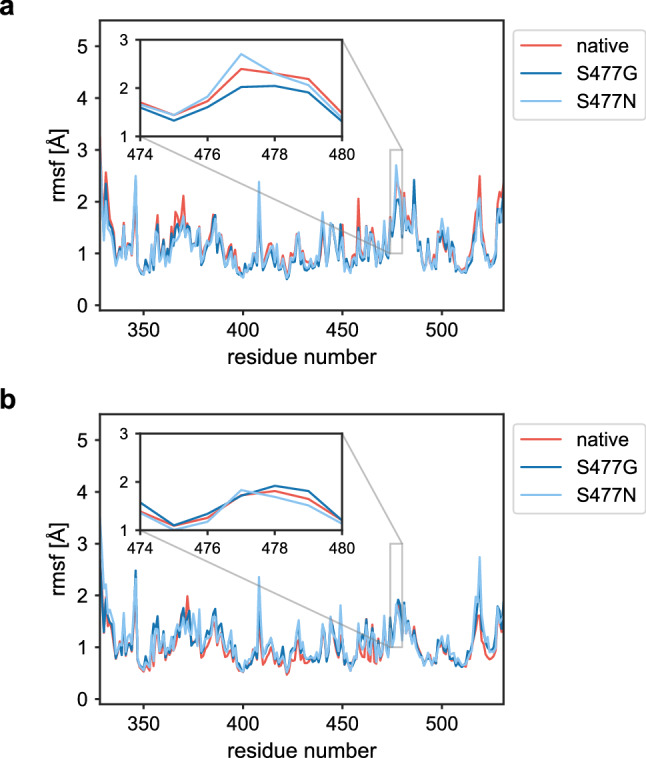
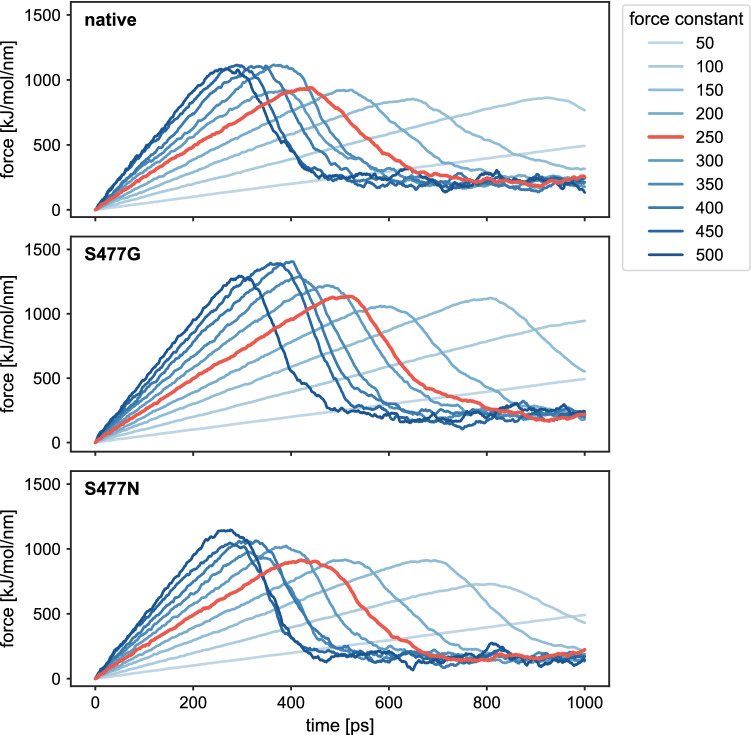
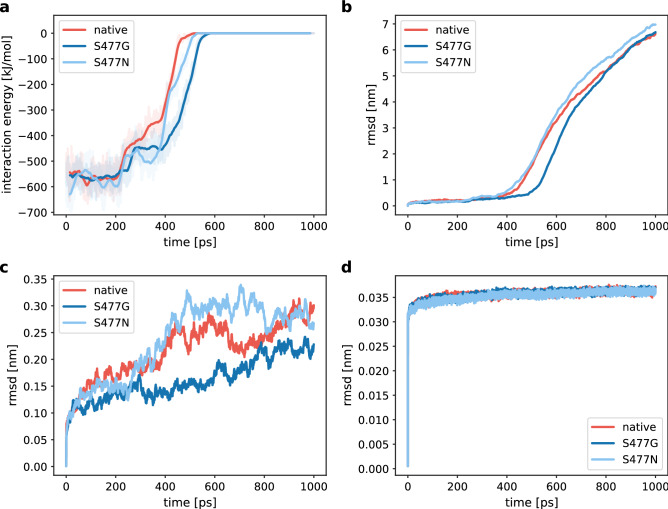
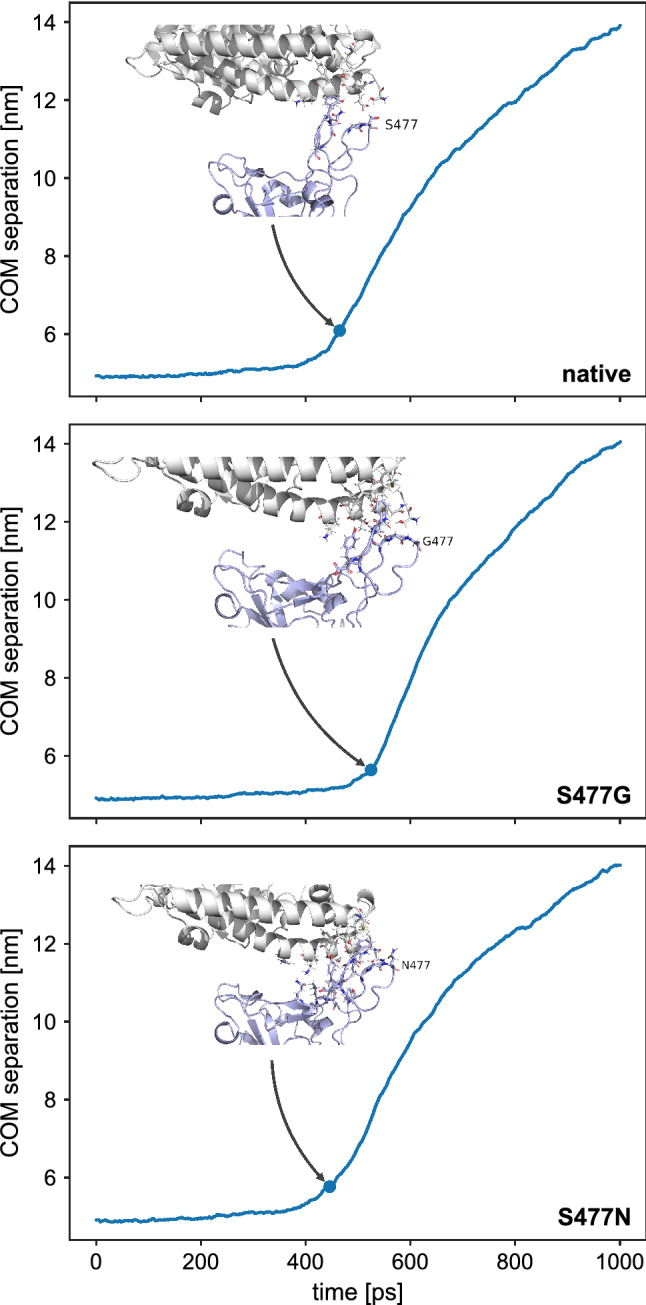
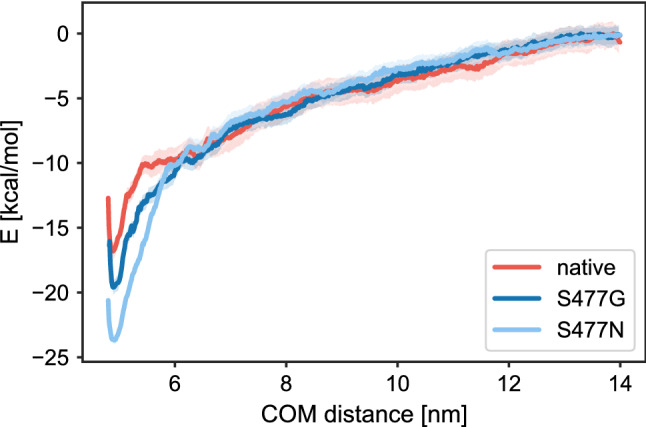
Since the worldwide outbreak of the infectious disease COVID-19, several studies have been published to understand the structural mechanism of the novel coronavirus SARS-CoV-2. During the infection process, the SARS-CoV-2 spike (S) protein plays a crucial role in the receptor recognition and cell membrane fusion process by interacting with the human angiotensin-converting enzyme 2 (hACE2) receptor. However, new variants of these spike proteins emerge as the virus passes through the disease reservoir. This poses a major challenge for designing a potent antigen for an effective immune response against the spike protein. Through a normal mode analysis (NMA) we identified the highly flexible region in the receptor binding domain (RBD) of SARS-CoV-2, starting from residue 475 up to residue 485. Structurally, the position S477 shows the highest flexibility among them. At the same time, S477 is hitherto the most frequently exchanged amino acid residue in the RBDs of SARS-CoV-2 mutants. Therefore, using MD simulations, we have investigated the role of S477 and its two frequent mutations (S477G and S477N) at the RBD during the binding to hACE2. We found that the amino acid exchanges S477G and S477N strengthen the binding of the SARS-COV-2 spike with the hACE2 receptor.


Conflict of interest statement

The authors declare no competing interests.

Figures

Figure 1
Figure 1
Sequence analysis for reported mutations in RBD. (a) Surface representation of the RBD coloured according to the conservation score at the respective residue position. Conserved residues are shown in white and shades of red represent increasing variability. A portion of hACE2 is shown in a light blue ribbon representation. (b) Reported mutations in RBD shown as Shannon entropy vs. residue position. The Shannon entropy is given by H=-i=1MPiln2Pi, where M is the total number of residue positions and Pi corresponds to probability of residue at position i. A higher entropy value indicates a less conserved position.
Figure 2
Figure 2
DynaMut flexibility analysis performed over the first 10 non-trivial modes of the molecule. (a) Residue wise atomic fluctuations in RBD. (b) Structure of the RBD in a ‘sausage-style’ representation with the thickness of the tube indicating the magnitude of the fluctuations. The RBM is shown in light blue. (c) Annotation of dynamical cross correlations among residues of the RBD, with the RBM again shown in light blue. Only the highly correlated pairs of residues with a correlation coefficient of (≥ 0.9) are annotated and connected by red lines.
Figure 3
Figure 3
Volumetric map analysis of 100 ns trajectory showing the hACE2 residues within 5 Å of RBD. Native RBD and the variants S477G and S477N are shown as grey cartoon representations with residue 477 highlighted in yellow. The Volumetric map was created by using the VMD Volmap toolkit that generated a map of the weighted atomic density of every ACE2 atom within 5 Å of RBD at each gridpoint. This is done by replacing each atom in the selection with a normalized gaussian distribution of width (standard deviation) equal to its atomic radius.
Figure 4
Figure 4
Comparison of residue wise root mean square fluctuations. (a) Unbound RDB, (b) in complex with hACE2. Each graph is averaged over three independent 10 ns simulations, the standard error is shown as semi-transparent bands. For clarity, values for the 10 N- and C-terminal residues of RBD are not shown.
Figure 5
Figure 5
Influence of the spring constant on the steering force of RBD. The steering force along the SMD trajectories is shown for different spring force constants, given in kJ/mol/nm2. Increasing force constants are indicated by increasing depths of blue. The curves resulting from SMD simulations with a force constant of 250 kJ/mol/nm2, which were later used for umbrella sampling, are highlighted in red.
Figure 6
Figure 6
Energy and structural changes during SMD simulations with a spring force constant of 250 kJ/mol/nm2. (a) Time dependence of the interaction energy between hACE2 and RBD. The shaded areas represent non-averaged data (frame rate 0.1 ps), whereas the lines represent window averages of 300 frames. (b) Comparison of the rmsd of the backbone carbon atoms in the RBD:hACE2 complex relative to the initial frame. (c) Comparison of the rmsd of the carbon atoms in the RBD backbone relative to the initial frame. (d) Comparison of the rmsd of the carbon atoms in the hACE2 backbone relative to the initial frame.
Figure 7
Figure 7
Snapshots of the hACE2:RBD interaction interface at the force rupturing event during SMD simulation. The structure of hACE2 is shown in grey, whereas the RBD is shown in light blue. Interacting residues on both binding partners are shown in a ball-and-stick representation. Structures and values for the COM separation were extracted from an SMD simulation with a spring force constant of 250 kJ/mol/nm2. The breakage point was defined as a COM separation of 1 nm larger than the separation at the start of the simulation.
Figure 8
Figure 8
Potential of mean force calculation from SMD simulation of RBD and its S477 variants. The standard deviation is indicated by a semi-transparent band in the same colour.

References

    1. Tyrrell D, Bynoe M. Cultivation of a novel type of common-cold virus in organ cultures. BMJ. 1965;1:1467. doi: 10.1136/bmj.1.5448.1467. - DOI - PMC - PubMed
    1. Shang J, et al. Structural basis of receptor recognition by SARS-CoV-2. Nature. 2020;581:221–224. doi: 10.1038/s41586-020-2179-y. - DOI - PMC - PubMed
    1. Shang J, et al. Cell entry mechanisms of SARS-CoV-2. Proc. Natl. Acad. Sci. 2020;117:11727–11734. doi: 10.1073/pnas.2003138117. - DOI - PMC - PubMed
    1. Wrapp D, et al. Cryo-EM structure of the 2019-nCoV spike in the prefusion conformation. Science. 2020;367:1260–1263. doi: 10.1126/science.abb2507. - DOI - PMC - PubMed
    1. Walls AC, et al. Structure, function, and antigenicity of the SARS-CoV-2 spike glycoprotein. Cell. 2020;181:281. doi: 10.1016/j.cell.2020.02.058. - DOI - PMC - PubMed

Publication types

MeSH terms

Substances

LinkOut - more resources