. 2021 Feb 22;11(1):4327.
doi: 10.1038/s41598-021-83697-w.

Modeling COVID-19 epidemics in an Excel spreadsheet to enable first-hand accurate predictions of the pandemic evolution in urban areas

Affiliations

Modeling COVID-19 epidemics in an Excel spreadsheet to enable first-hand accurate predictions of the pandemic evolution in urban areas

Mario Moisés Alvarez et al. Sci Rep. .

Abstract

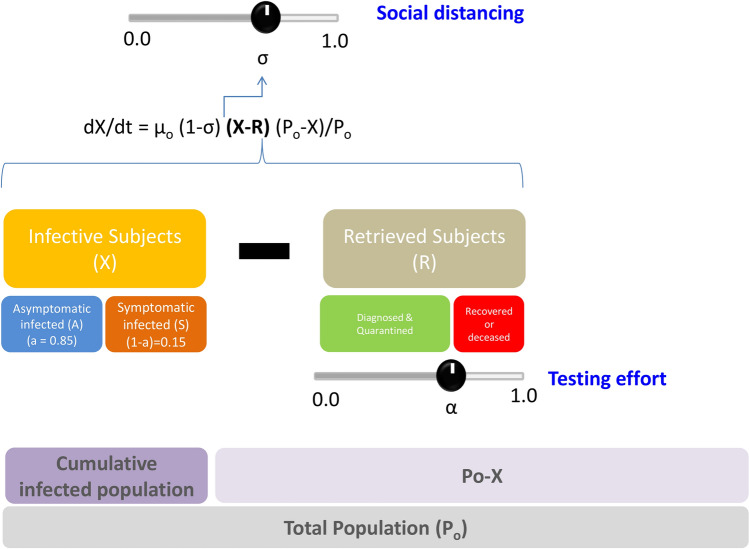
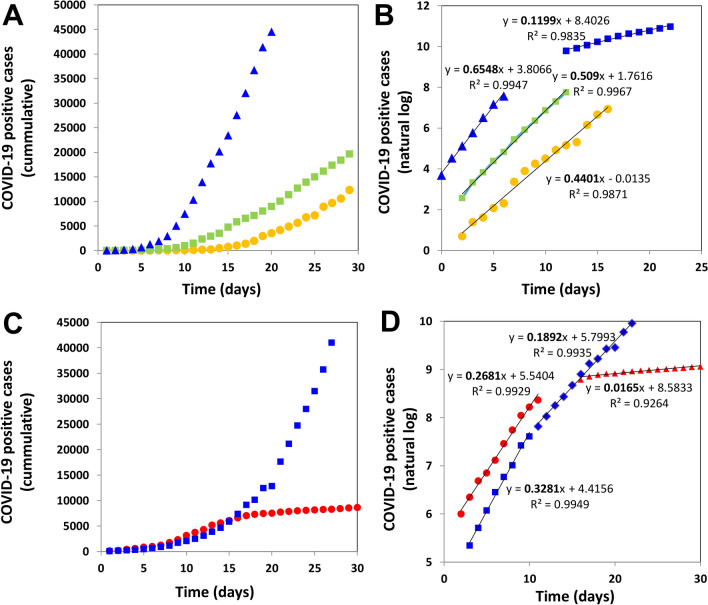
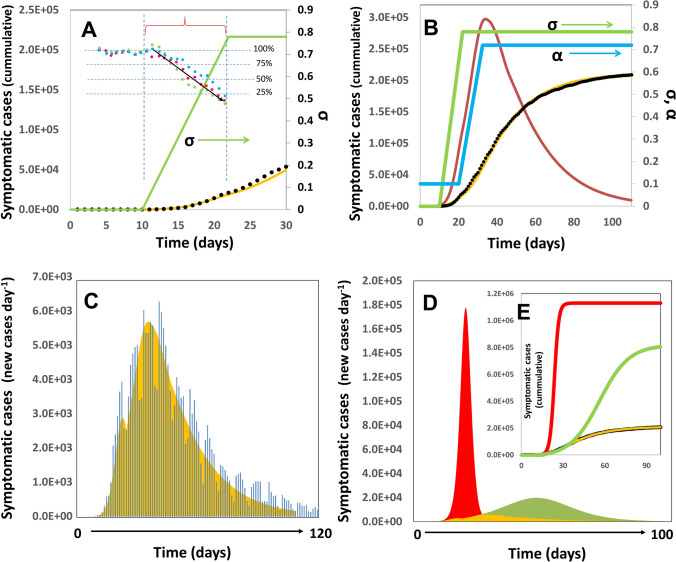
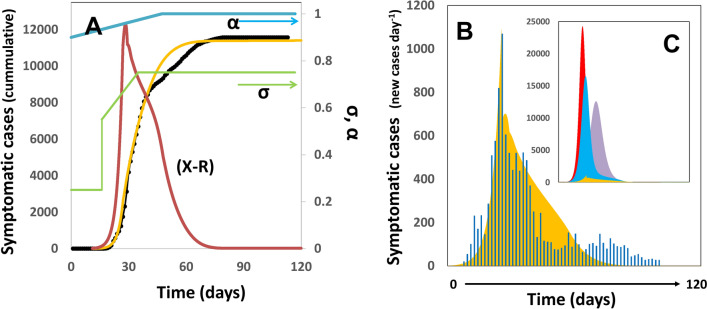
COVID-19, the first pandemic of this decade and the second in less than 15 years, has harshly taught us that viral diseases do not recognize boundaries; however, they truly do discriminate between aggressive and mediocre containment responses. We present a simple epidemiological model that is amenable to implementation in Excel spreadsheets and sufficiently accurate to reproduce observed data on the evolution of the COVID-19 pandemics in different regions [i.e., New York City (NYC), South Korea, Mexico City]. We show that the model can be adapted to closely follow the evolution of COVID-19 in any large city by simply adjusting parameters related to demographic conditions and aggressiveness of the response from a society/government to epidemics. Moreover, we show that this simple epidemiological simulator can be used to assess the efficacy of the response of a government/society to an outbreak. The simplicity and accuracy of this model will greatly contribute to democratizing the availability of knowledge in societies regarding the extent of an epidemic event and the efficacy of a governmental response.


Conflict of interest statement

The authors declare no competing interests.

Figures

Figure 1
Figure 1
Model formulation. (A) Schematic representation of the model. This novel multi-compartment demographic model formulation considers that new infections are proportional to (X–R; infected-retrieved). Demographic elements are directly integrated into the model (Po, total population). The positioning and size of different bars indicates relationships between components. For instance, as the cumulative infected population progresses, the susceptible population (Po–X; total population minus infected individuals) is reduced. The social distancing (σ) and the testing effort (α) are explicitly stated as the two main parameters that modify the epidemic progression.
Figure 2
Figure 2
Epidemiological data related to the onset of a COVID-19 pandemic in different regions. (A) Cumulative number of positive cases of COVID-19 infection in Spain (yellow circles), Iran (green squares), and NYC (blue triangles) during the first days after the outbreak. (B) Natural logarithm of the cumulative number of positive cases of COVID-19 infection in Spain (yellow circles), Iran (green squares), and NYC (blue triangles and squares). (C) Cumulative number of positive cases of COVID-19 infection in Italy (blue squares) and South Korea (red circles). (D) Natural logarithm of the cumulative number of positive cases of COVID-19 infection in Italy (blue squares and diamonds) and South Korea (red circles and triangles). Two clearly distinctive exponential stages are observed in the case of the NYC and South Korean progression.
Figure 3
Figure 3
Progression of the COVID-19 Pandemic in NYC. (A) Initial evolution of the number of positive cases of COVID-19 in NYC. Actual data points, as officially reported, are shown using black circles. Simulation predictions are described by the yellow line. The profile of social distancing values used in simulations (σ) is shown as a green line. Relative change in visits to different type of places in NYC (modified from Ref.) as reported by Bakker et al. (modified from Ref.): food (green circles), shopping (red circules), and city/outdoors (blue circles) (B) Model prediction of the total number of symptomatic patients through the months of March and May. Actual data points, as officially reported, are shown using black circles. Simulation predictions are described by the yellow line. The profiles of social distancing (σ) and testing effort (α) are shown as green and blue lines, respectively. The value of (X–R), determinant of the progression of the infection among population, is shown as a red line. (C) Model prediction (yellow) and actual number of new cases of COVID-19 per day (as reported by the NYC authorities; blue bars; https://www1.nyc.gov/site/doh/covid/covid-19-data.page) during the period from March 1 to June 30, 2020. (D) Prediction of the number of new cases of COVID-19 per day if no containment actions were adopted (red area), if only social distancing were adopted (in accordance with the green profile of σ values in A and B) (green area), or in the actual case were social distancing combined with intensified testing and quarantine were adopted (yellow area). The inset show the cumulative number of cases predicted by the model for the same scenarios previously described. Actual data points corresponding to the officially reported number of cumulative COVID-19 cases in NYC are shown as black dots.
Figure 4
Figure 4
Progression of the COVID-19 Pandemic in South Korea. (A) Model prediction of the total number of symptomatic patients through the months of February and May. Actual data points, as officially reported, are shown using black circles. Simulation predictions are described by the yellow line. The profiles of social distancing (σ) and testing effort (α) are shown as green and blue lines, respectively. The value of (X–R), determinant of the progression of the infection among population, is shown as a red line. (B) Model prediction (yellow) and actual number of new cases of COVID-19 per day (blue bars; https://en.wikipedia.org/wiki/COVID-19_pandemic_in_South_Korea) during the period from February to May, 2020. (C) Prediction of the number of new cases of COVID-19 per day if no containment actions were adopted (red area); if only intensified testing and quarantine were adopted [in accordance with the blue profile of α values in (A)] (blue area); if only social distancing were adopted [in accordance with the green profile of σ values in (A)] (purple area); or in the actual case were social distancing combined with intensified testing and quarantine were adopted (yellow area).
Figure 5
Figure 5
Progression of the COVID-19 Pandemic in Mexico City. (A) Model prediction of the total number of symptomatic patients through the months of Mach and December, 2020. Actual data points, as officially reported, are shown using black circles. Simulation predictions are described by the yellow line. The profile of social distancing (σ) is shown as a green line. A constant value of α = 0.10 was used in this simulation. (B) Model prediction (yellow line) and actual number of new cases of COVID-19 per day (as reported by the Mexican authorities; blue line; https://www.fast-trackcities.org/content/data-visualization-mexico-city-covid) during the period from February to December, 2020. (C) Prediction of the number of new cases of COVID-19 per day if the testing effort would have been doubled (light yellow area) or tripled (green area). The simulation of the actual pandemic scenario is also shown (yellow-orange area).

References

    1. Holshue ML, et al. First case of 2019 novel coronavirus in the United States. N. Engl. J. Med. 2020 doi: 10.1056/nejmoa2001191. - DOI - PMC - PubMed
    1. Sarkar K, Khajanchi S, Nieto JJ. Modeling and forecasting the COVID-19 pandemic in India. Chaos Solitons Fractals. 2020;139:110049. doi: 10.1016/j.chaos.2020.110049. - DOI - PMC - PubMed
    1. Bashir MF, Ma B, Shahzad L. A brief review of socio-economic and environmental impact of Covid-19. Air Qual. Atmos. Health. 2020;13:1403–1409. doi: 10.1007/s11869-020-00894-8. - DOI - PMC - PubMed
    1. Bilal LF, Bashir MF, Komal B, Tan D. Role of electronic media in mitigating the psychological impacts of novel coronavirus (COVID-19) Psychiatry Res. 2020;289:113041. doi: 10.1016/j.psychres.2020.113041. - DOI - PMC - PubMed
    1. MacIntyre, C. R. Global spread of COVID-19 and pandemic potential. Glob. Biosecur.10.31646/gbio.55 (2020).

Publication types

MeSH terms