. 2021 Feb;3(2):182-195.
doi: 10.1038/s42255-021-00350-6. Epub 2021 Feb 22.

A unique subset of glycolytic tumour-propagating cells drives squamous cell carcinoma

Affiliations

A unique subset of glycolytic tumour-propagating cells drives squamous cell carcinoma

Jee-Eun Choi et al. Nat Metab. 2021 Feb.

Abstract

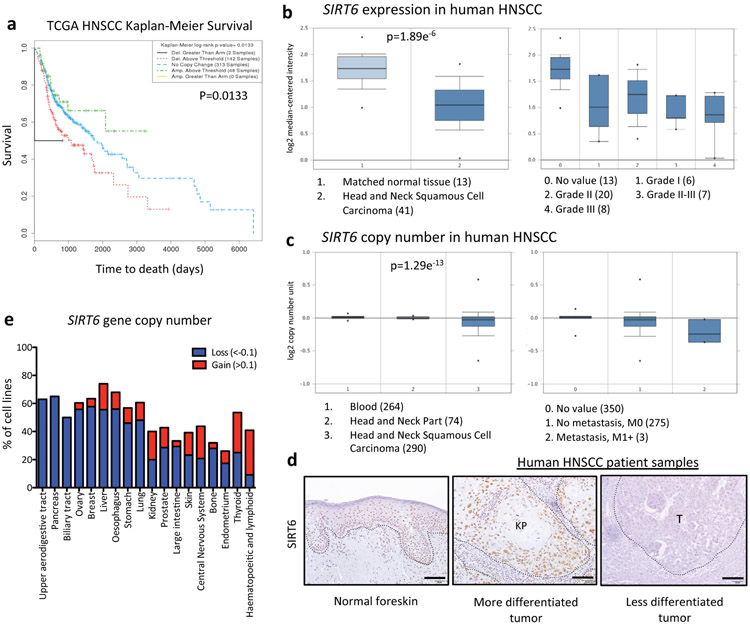
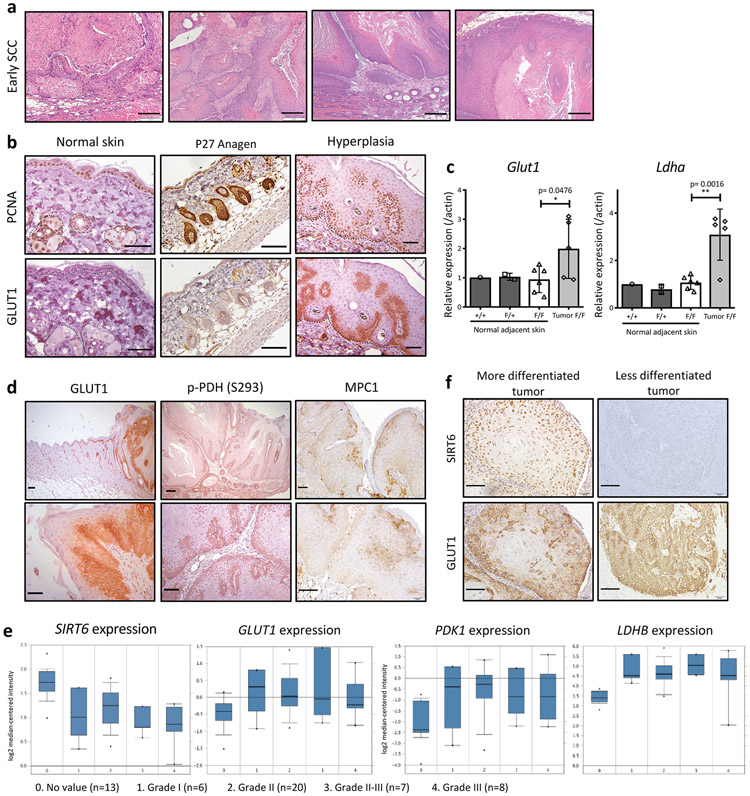
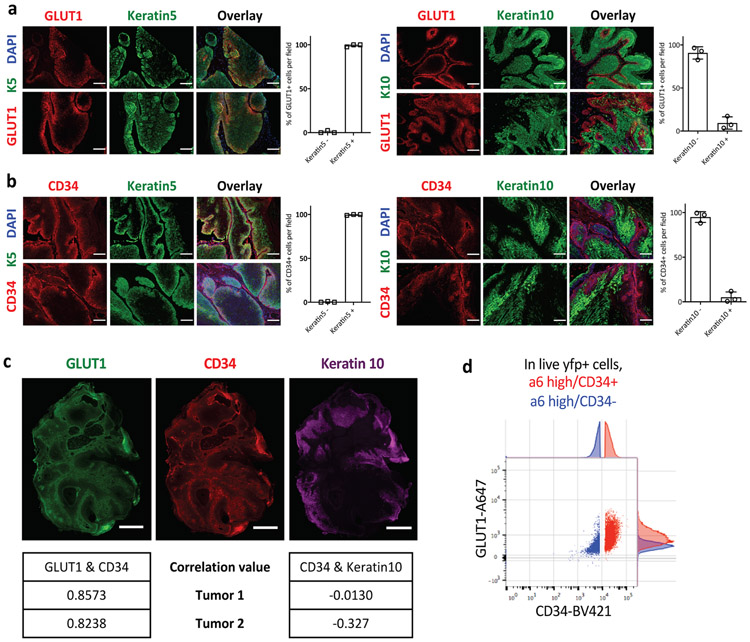
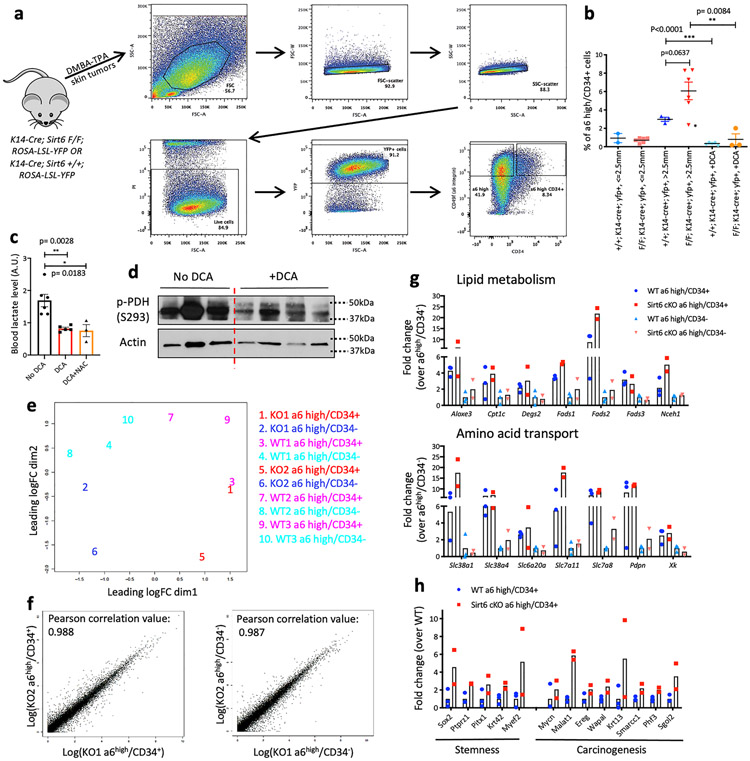
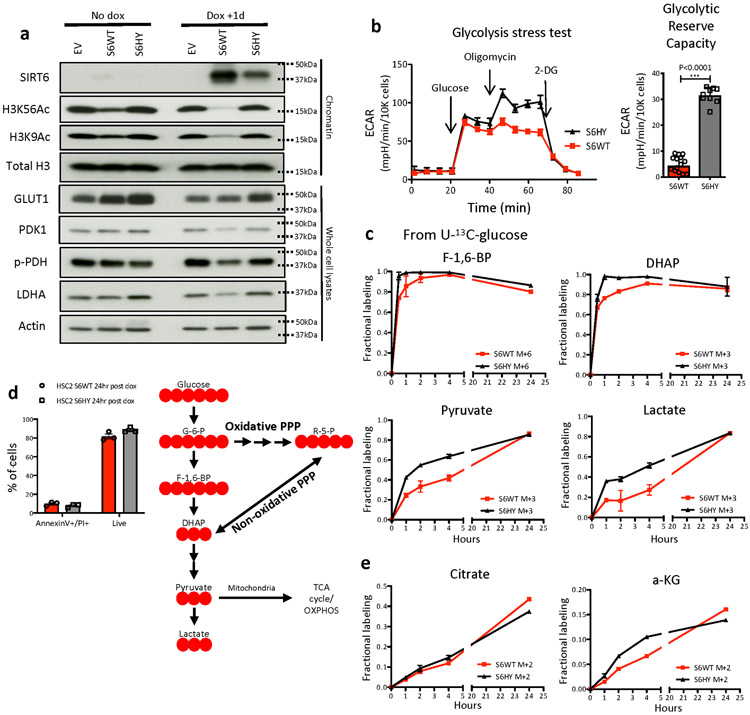
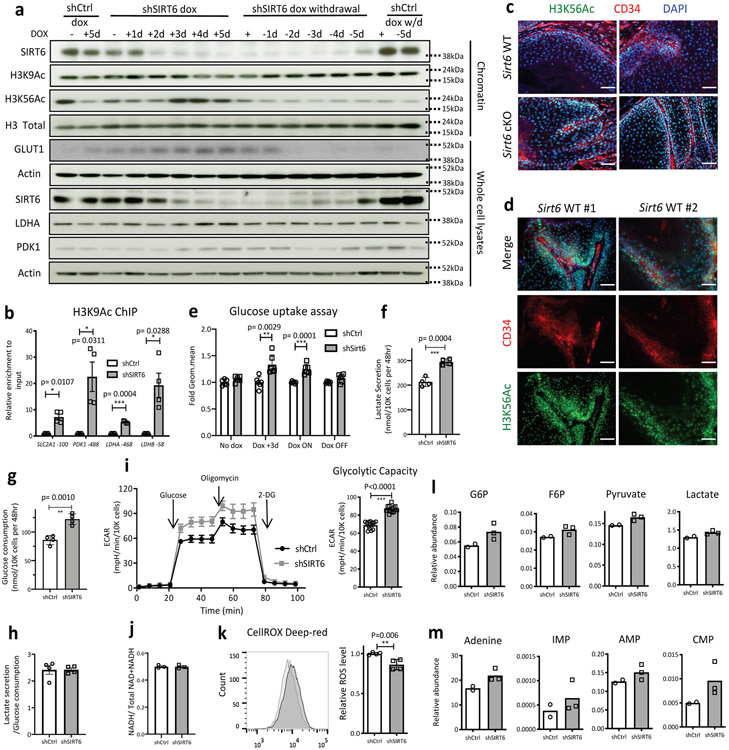
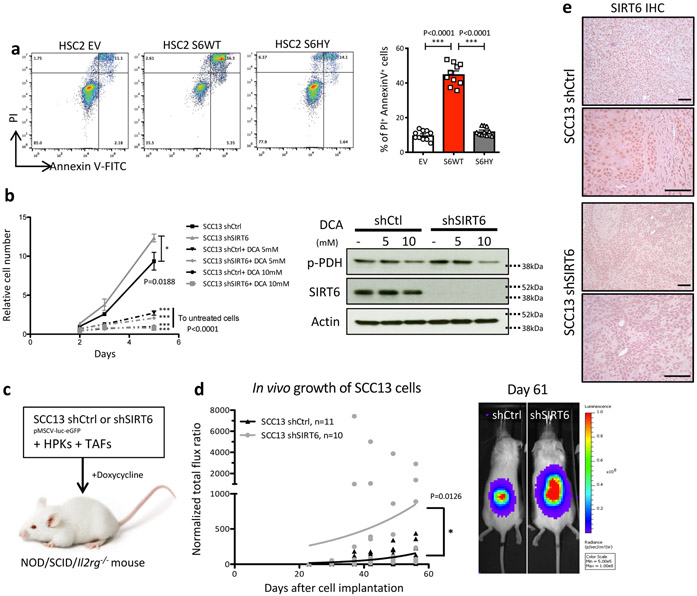
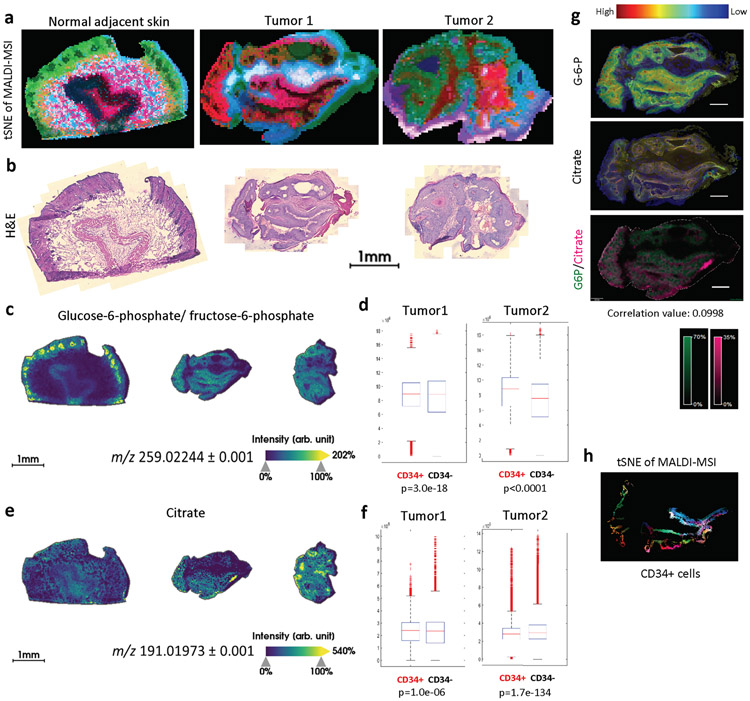
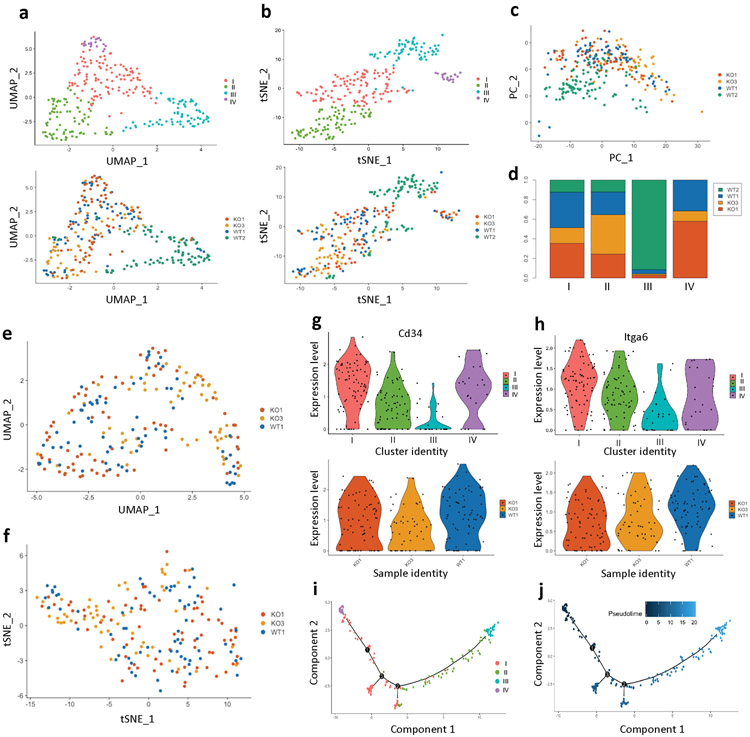
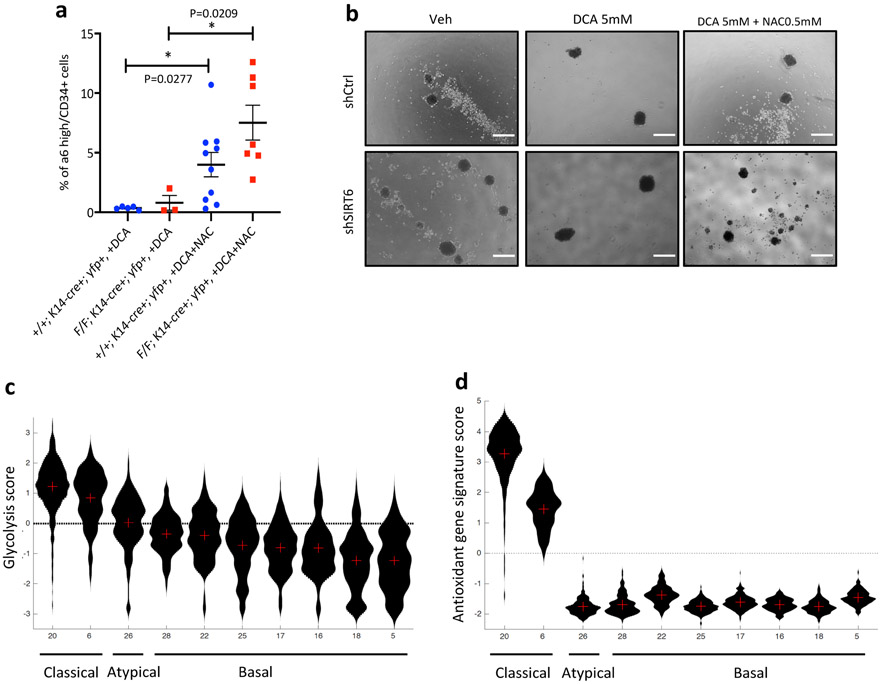
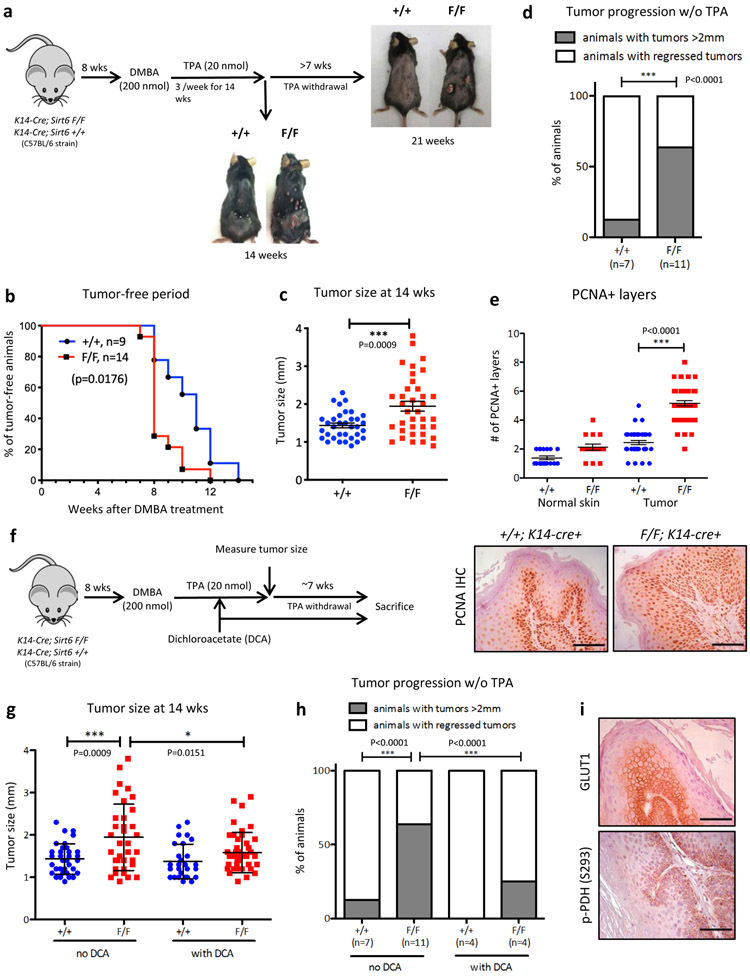
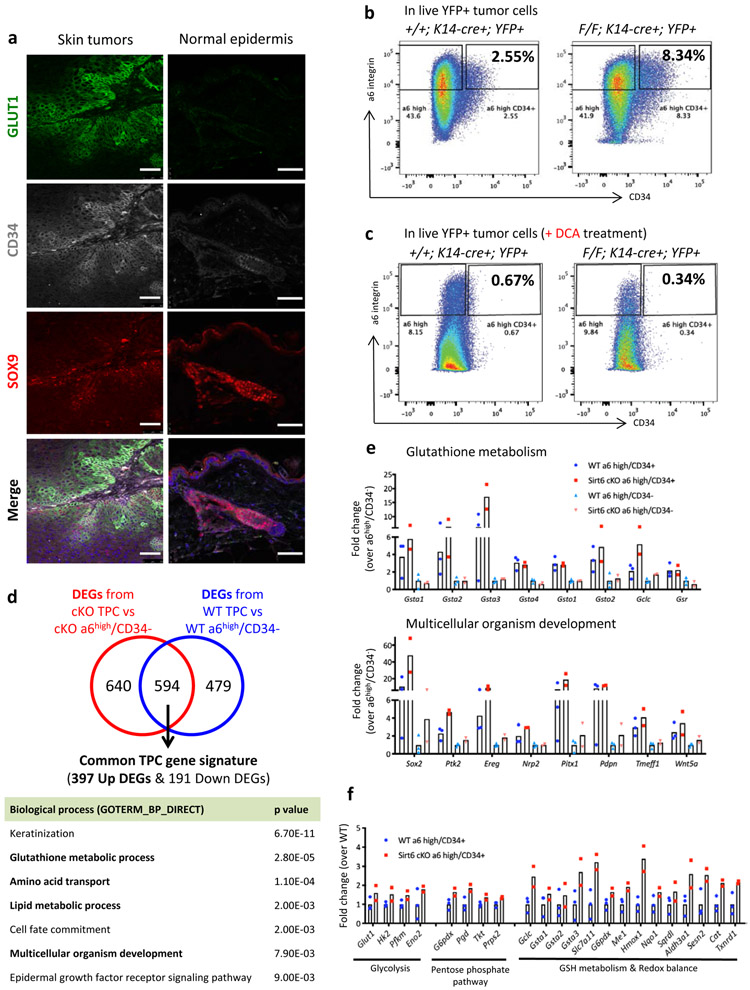
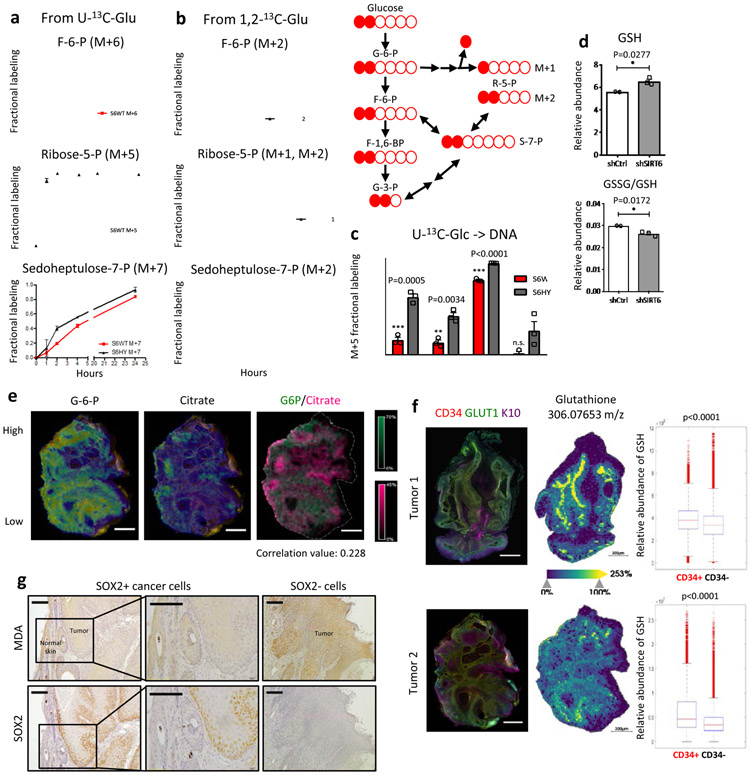
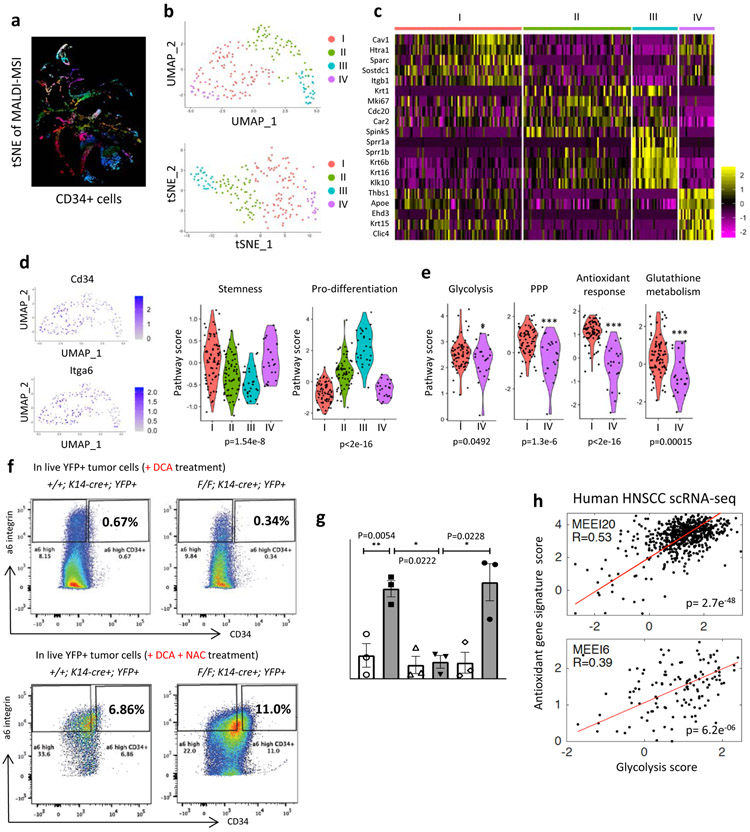
Head and neck squamous cell carcinoma (SCC) remains among the most aggressive human cancers. Tumour progression and aggressiveness in SCC are largely driven by tumour-propagating cells (TPCs). Aerobic glycolysis, also known as the Warburg effect, is a characteristic of many cancers; however, whether this adaptation is functionally important in SCC, and at which stage, remains poorly understood. Here, we show that the NAD+-dependent histone deacetylase sirtuin 6 is a robust tumour suppressor in SCC, acting as a modulator of glycolysis in these tumours. Remarkably, rather than a late adaptation, we find enhanced glycolysis specifically in TPCs. More importantly, using single-cell RNA sequencing of TPCs, we identify a subset of TPCs with higher glycolysis and enhanced pentose phosphate pathway and glutathione metabolism, characteristics that are strongly associated with a better antioxidant response. Together, our studies uncover enhanced glycolysis as a main driver in SCC, and, more importantly, identify a subset of TPCs as the cell of origin for the Warburg effect, defining metabolism as a key feature of intra-tumour heterogeneity.


Conflict of interest statement

Competing Interests Statement

R.M has a financial interest in Galilei Biosciences Inc, a company developing activators of the mammalian SIRT6 protein. R.M.’s interests were reviewed and are managed by MGH and MGB HealthCare in accordance with their conflict of interest policies. N.H. has equity in BioNtech and Related Sciences. N.Y.R.A. is a key opinion leader to Bruker Daltonics. The other authors declare no competing interests.

Figures

Extended Data Fig. 1
Extended Data Fig. 1. SIRT6 acts as a tumor suppressor in human HNSCC.
Extended Data Figure 1 (related to Fig. 1). a, Kaplan-Meier survival analysis of HNSCC patients based on SIRT6 copy number (log-rank test, p=0.0133) b, SIRT6 expression level in human HNSCC compared to matched normal tissue (t-test, p=1.89e-6), or by tumor grade, respectively from the Oncomine c, SIRT6 copy number change in human HNSCC compared to normal tissue (t-test, p=1.29e-13), or by metastasis feature from the TCGA listed in the Oncomine. d, Representative SIRT6 immunostaining from human normal foreskin, differentiated HNSCC characterized by keratin pearl (KP), and undifferentiated HNSCC (T, tumor). Scale bars indicate 100μm. e, SIRT6 gene copy number change in human cancer cell lines from the CCLE. Statistics, sample sizes (n) and numbers of replications are presented in Methods, ‘Statistics and reproducibility’.
Extended Data Fig. 2
Extended Data Fig. 2. Dysplastic cancer cells presented increased glycolysis in an in vivo model of cutaneous SCC and in human HNSCC in the context of SIRT6.
Extended Data Figure 2 (related to Fig. 1)a, H&E stained images of early SCC found only among Sirt6 cKO tumors. Scale bars indicate 200μm b, PCNA (top) and GLUT1 (bottom) immunostaining in normal untreated skin, P27 anagen animal back skin, and dysplastic skin treated with DMBA/TPA. Dashed line indicates either hair follicle or epidermis. For normal skin, both images came from the same untreated mouse, but not immediate adjacent skin sections. Scale bars indicate 100μm. c, Glut1 and Ldha expression in normal skin and skin tumors from Sirt6-deficient animals at 21 weeks after DMBA treatment. Data indicate mean ± S.E.M. d, GLUT1, phospho-PDH (Ser293), and MPC1 immunostaining in Sirt6-deleted large papilloma samples. Scale bars indicate 100μm. e, SIRT6, GLUT1, PDK1, and LDHB expression levels in human HNSCC compared by tumor grade from Ginos et al. listed in the Oncomine. f, Representative SIRT6 and GLUT1 immunostaining from human differentiated HNSCC and undifferentiated HNSCC. Scale bars indicate 100μm. Statistics, sample sizes (n) and numbers of replications are presented in Methods, ‘Statistics and reproducibility’. * p<0.05 ** p<0.01
Extended Data Fig. 3
Extended Data Fig. 3. Metabolic features of tumor basal cells.
Extended Data Figure 3 (related to Fig. 2). a, GLUT1 and Keratin5 (left panel), and GLUT1 and Keratin10 (right panel) immunofluorescence in skin tumor samples treated with DMBA/TPA. Scale bars indicate 200μm. Data indicate mean ± S.E.M. b, CD34 and Keratin5 (left panel), and CD34 and Keratin10 (right panel) immunofluorescence in skin tumor samples treated with DMBA/TPA. Scale bars indicate 200μm. Data indicate mean ± S.E.M. c, Representative whole tumor immunofluorescence with GLUT1, CD34, and Keratin 10 in skin tumor samples treated with DMBA/TPA. Images were taken at 40x and stitched with the software in Zeiss confocal microscope. Correlation value is calculated in Matlab. Scale bars indicate 300μm. d, Representative flow cytometry plot of GLUT1-A647 and CD34-BV421 co-stained tumor cells after gating live, YFP positive, a6 integrin high cells. Statistics, sample sizes (n) and numbers of replications are presented in Methods, ‘Statistics and reproducibility’.
Extended Data Fig. 4
Extended Data Fig. 4. Analysis of tumor-propagating cell enrichment and transcriptome.
Extended Data Figure 4 (related to Fig. 2). a, Representative flow sorting scheme from mouse skin tumors to isolate α6 integrinhigh/CD34+ cells in FACSAria II b, Percentage of α6 integrinhigh/CD34+ cells from Sirt6 WT or Sirt6-deleted skin tumors with or without DCA treatment. Skin tumors were grouped based on their tumor size and genotype for comparison. In the group of skin tumors bigger than 2.5mm from Sirt6 F/F; K14-cre+; YFP+ animals, if we exclude the lowest value from the group (marked with a star sign), the difference in the enrichment α6 integrinhigh/CD34+ cells between Sirt6 WT and Sirt6-deleted skin tumors that were bigger than 2.5mm becomes statistically significant (** p=0.0086) Data indicate mean ± S.E.M. c, Blood (from tail vein) lactate level assessed by GC-MS in DCA-treated animals and control animals Data indicate mean ± S.E.M. d, Western blot analysis of p-PDH (Ser293) from DCA-treated skin samples and vehicle control. e, An MDS plot of all the samples with top 500 DEGs f, Correlation plots between biological duplicates of KO tumor subpopulations g, Representative gene list and corresponding fold changes in expression from Sirt6 WT or cKO TPCs and its negative counterparts (α6high/CD34) for functional gene categories associated with lipid metabolism (top) and amino acid transport (bottom). Data indicate mean. h, Representative gene list and corresponding fold changes in expression from Sirt6 WT or cKO TPCs for functional gene categories associated with each biological process. Data indicate mean. Statistics, sample sizes (n) and numbers of replications are presented in Methods, ‘Statistics and reproducibility’. * p<0.05 ** p<0.01 *** p<0.0001
Extended Data Fig. 5
Extended Data Fig. 5. Overexpression of SIRT6 WT negatively affects glycolytic gene expression, and slows down glycolytic flux, while minimally affecting the mitochondrial TCA cycle in HSC2 cells.
Extended Data Figure 5 (related to Fig. 3). a, Chromatin fraction and whole cell lysates were extracted respectively and were analyzed by Western blot in doxycycline-inducible SIRT6 WT or H133Y overexpressing HSC2 cells in addition to EV (empty vector) control. b, Glycolysis stress test was performed using the Seahorse bioanalyzer following the manufacturer’s instruction in HSC2 cells pretreated with doxycycline for 24hrs. ECAR value was normalized by cell number of each well using the Cyquant cell proliferation assay kit. Data indicate mean ± S.D. c & e, Relative enrichment of fully labeled glycolysis intermediates (c) or labeled TCA cycle intermediates (e) after incubation with U-13C-glucose at a given time point either in SIRT6 WT or H133Y overexpressing HSC2 cells (26hr post doxycycline). Data indicate mean ± S.D. d, Annexin V and PI staining in HSC2 cells 24hr post dox, analyzed by MACSQuant VYB Data indicate mean ± S.E.M. Statistics, sample sizes (n) and numbers of replications are presented in Methods, ‘Statistics and reproducibility’. *** p<0.001
Extended Data Fig. 6
Extended Data Fig. 6. SIRT6 is an H3K56Ac and H3K9Ac deacetylase, regulating glycolysis.
Extended Data Figure 6 (related to Fig. 3). a, Chromatin fractions and whole cell lysates were extracted respectively and were analyzed by Western blot in doxycycline-inducible SIRT6 knockdown SCC13 cells as well as control cells over time. b, Chromatin immunoprecipitation assay against H3K9Ac was performed, followed by qPCR analysis on the promoter regions of the known SIRT6 target glycolysis genes. Data indicate mean ± S.D. c & d, Immunofluorescence staining against H3K56Ac and CD34 in DMBA/TPA-treated Sirt6 WT or cKO tumors. More concentrated antibody condition was used in the samples shown in d for H3K56Ac. Scale bars indicate 100μm. e, Glucose uptake was measured after 2-NBDG incubation in SCC13 cells followed by FACSAria II analysis. Data indicate mean ± S.D. Cells were cultured in the presence of doxycycline to induce knockdown of SIRT6, and then either kept in Dox (Dox ON) or withdrew from Dox for 3 days (Dox OFF) f-h, Glucose and lactate concentration, and the ratio of these two were measured in media of SCC13 cells pretreated with doxycycline for 3 days by using kits from Biovision. Data indicate mean ± S.D. i, Glycolysis stress test was performed using the Seahorse bioanalyzer following the manufacturer’s instruction in SCC13 cells pretreated with doxycycline for at least 3 days. ECAR value was normalized by cell number of each well using the Cyquant cell proliferation assay kit. Data indicate mean ± S.D. j, Ratio of NAD+/NADH was assessed by a kit from Abcam in SCC13 cells pretreated with doxycycline for 3 days k, Relative reactive oxygen species level analyzed by LSRII using CellROX deepred in SCC13 cells 3 days post doxycycline. Data indicate mean ± S.D. l & m, Relative abundance of the indicated metabolites either in control (shCtrl) or SIRT6 knockdown (shSIRT6) SCC13 cells 3 days post doxycycline. Data indicate mean. Statistics, sample sizes (n) and numbers of replications are presented in Methods, ‘Statistics and reproducibility’. * p<0.05, ** p<0.01, *** p<0.001
Extended Data Fig. 7
Extended Data Fig. 7. Glycolytic metabolism enhances cell survival and cell proliferation.
Extended Data Figure 7 (related to Fig. 3). a, Apoptosis assay in HSC2 cells pretreated with doxycycline for at least 4 days. Propidium iodide (PI) and annexin V double positive cells were considered as dead cells. Data indicate mean ± S.D. b, Cell proliferation assay in SCC13 cells pretreated with doxycycline for at least 3 days with or without DCA over time. Data indicate mean ± S.E.M. (left). Western blot analysis of whole cell lysates was performed at day 5 in the cell proliferation assay (right). c, Schematic presentation of skin xenotransplantation assay in severely immunocompromised NSG (NOD/SCID/Il2rg−/−) mice. Doxycycline was administered in drinking water. HPKs; human primary keratinocytes, TAFs; tumor-associated fibroblasts d, In vivo growth of SCC13 cells was monitored by bioluminescence imaging over time. Normalized total flux ratio of each mouse was used to track in vivo tumor growth (left). Representative bioluminescence images of tumors with control or SIRT6-deficient SCC13 cells at day 61 (right). e, Knockdown of SIRT6 by in vivo doxycycline administration in tumors was confirmed by immunohistochemistry. Scale bars indicate 100μm. Statistics, sample sizes (n) and numbers of replications are presented in Methods, ‘Statistics and reproducibility’. * p<0.05, *** p<0.001
Extended Data Fig. 8
Extended Data Fig. 8. Metabolic heterogeneity within tumors as determined by MALDI-MSI.
Extended Data Figure 8 (related to Fig. 3). a, tSNE analysis of all the metabolites analyzed by MALDI-MSI in each sample. Rainbow spectrum represents how close each pixel to the others is within each sample. There was no input of histological information of tissue to perform this dimensionality reduction. b, H&E staining in the same section as MALDI-MSI. Images were taken at 40x and stitched with the software in Zeiss microscope. Scale bars indicate 1mm. c & e, MALDI-MSI data of glucose-6-phosphate and citrate in DMBA/TPA-treated tumors and adjacent skin Scale bars indicate 1mm. d & f, Quantification of MALDI-MSI signal intensity of each metabolite from CD34+ and CD34− areas g, Co-registration images (the left two) of G-6-P and citrate on top of immunofluorescence stained image in tumor 1. Overlay image (the very right) of G-6-P and citrate with a correlation value of distribution between two metabolites. Scale bars indicate 300μm. h, tSNE analysis of CD34+ area in tumor 1. Statistics, sample sizes (n) and numbers of replications are presented in Methods, ‘Statistics and reproducibility’.
Extended Data Fig. 9
Extended Data Fig. 9. Single cell RNA-seq analysis of TPCs from 2 WT and 2 KO tumors.
Extended Data Figure 9 (related to Fig. 4). a, Dimensionality reduction analysis of prospectively isolated TPCs from 2 WT and 2 KO tumors using UMAP (resolution = 0.5), color-coded by clusters (top) or samples (bottom) b, Dimensionality reduction analysis of prospectively isolated TPCs from 2 WT and 2 KO tumors using tSNE, color-coded by clusters (top) or samples (bottom) c, Principal component analysis of prospectively isolated TPCs from 2 WT and 2 KO tumors, color-coded by samples d, Bar graph indicating cluster frequency by mouse samples. e & f, Dimensionality reduction analysis of prospectively isolated TPCs from 1 WT and 2 KO tumors using UMAP (resolution = 0.5, e) or tSNE (f), color-coded by samples g & h, Violin plots to show expression levels of Cd34 (g) or a6 integrin (h), shown by clusters (top) and samples (bottom) i & j, Trajectory analysis of TPCs, shown by clusters (i) or pseudotime (j)
Extended Data Fig. 10
Extended Data Fig. 10. Antioxidant protection in TPCs.
Extended Data Figure 10 (related to Fig. 4). a, Percentage of α6 integrinhigh/CD34+ cells from Sirt6 WT or Sirt6-deleted skin tumors with or without NAC treatment under DCA administration Data indicate mean ± S.E.M. b, Representative bright field images of tumorspheres (Day 10) in SCC13 cells. Scale bars indicate 500μm. c & d, Violin plots, showing the distribution and mean of glycolytic scores (c) and antioxidant gene signature scores (d), across single cancer cells from 10 HNSCC tumors published in Puram et al. Tumors were ordered by their glycolytic scores and are further classified into three subtypes, demonstrating that the classical subtype is associated with high glycolytic and antioxidant gene signature scores. Statistics, sample sizes (n) and numbers of replications are presented in Methods, ‘Statistics and reproducibility’.
Figure 1.
Figure 1.. Sirt6 acts as a tumor suppressor in squamous cell carcinoma by negatively regulating aerobic glycolysis.
a, DMBA/TPA-induced skin carcinogenesis protocol in Sirt6 WT or Sirt6 cKO animals. b, Tumor-free period after starting DMBA treatment in Sirt6 WT or Sirt6 cKO animals. Statistical analysis was done by log-rank test. c, Tumor size was measured at 14 weeks after DMBA treatment. Data are presented as mean ±S.D. d, Tumor progression was assessed after stopping TPA treatment (at 14 weeks post DMBA) for least 7 weeks. Fisher’s exact test was performed for statistical analysis (p<0.0001, two-sided). e, PCNA immunostaining in DMBA/TPA-treated skin tumors from Sirt6 WT or Sirt6 cKO animals. Representative images (lower panel, scale bars indicate 100μm) and quantification of PCNA+ layers from normal adjacent skin and skin tumors (upper panel). f, Schematic presentation of DCA treatment in DMBA/TPA-treated animals. DCA was administered at 7-8 weeks after DMBA treatment, in order to avoid any confounding effect of DCA on tumor initiation. g, Tumor size was measured at 14 weeks after DMBA treatment. Data are presented as mean ±S.D. h, Tumor progression was assessed after stopping TPA treatment with continuous DCA treatment. Data of the first two groups shown in Figure 1d were used again for comparison. Fisher’s exact test was performed for statistical analysis (p<0.0001, two-sided). i, GLUT1 and phospho-PDH (Ser293) immunostaining in Sirt6-deleted large papilloma samples. Scale bars indicate 100μm. Statistics, sample sizes (n) and numbers of replications are presented in Methods, ‘Statistics and reproducibility’. * p<0.05, ** p<0.01, *** p<0.001
Figure 2.
Figure 2.. Increased glycolysis enriches for tumor-propagating cells in vivo.
a, Immunofluorescence images against GLUT1, CD34, and SOX9 in Sirt6-deficient tumors and normal epidermis. Images were acquired by a Leica SP8 white light confocal microscope. Scale bars indicate 50μm. b & c, Representative FACS plots to analyze and isolate tumor-propagating cells (α6 integrinhigh/CD34+) from Sirt6 WT or Sirt6-deleted skin tumors without DCA (b) or with DCA (c). d, DAVID pathway analysis (GOTERM_BP_DIRECT) of 397 commonly upregulated genes in TPCs from differentially expressed genes (DEGs) between TPCs and α6high/CD34 cells in each genotype. e & f, Representative gene list and corresponding fold changes in expression from Sirt6 WT or cKO TPCs and its negative counterparts (α6high/CD34) for functional gene categories associated with each biological process. Data indicate mean. Statistics, sample sizes (n) and numbers of replications are presented in Methods, ‘Statistics and reproducibility’.
Figure 3.
Figure 3.. Glycolytic TPCs uniquely upregulate glutathione metabolism via the oxidative PPP to mitigate oxidative stress.
a & b, Relative enrichment of fully labeled metabolic intermediates after incubation with U-13C-glucose (a) or 1,2-13C-glucose (b) at a given time point either in SIRT6 WT or H133Y overexpressing HSC2 cells (26hr post doxycycline). Data are presented as mean ±S.D. c, 13C incorporation into DNA from U-13C-glucose via ribose-5-phosphate (M+5) at 24hr either in SIRT6 WT or H133Y overexpressing HSC2 cells (26hr post doxycycline). Data are presented as mean ±S.D. d, A relative abundance of GSH and a relative ratio of GSSG/GSH either in control (shCtrl) or SIRT6 knockdown (shSIRT6) SCC13 cells 3 days post doxycycline. Data is from at least two biological replicates (n=2 for shCtrl and n=3 for shSIRT6). Data are presented as mean ±S.E.M. e, Co-registration images (the left two) of G-6-P and citrate on top of immunofluorescence image (CD34 and GLUT1) in tumor 2. Overlay image (the very right) of G-6-P and citrate with a correlation value of distribution between two metabolites. Scale bars indicate 300μm f, Immunofluorescence image against CD34, GLUT1, and Keratin10 (left panels) and MALDI-MSI (glutathione) from DMBA/TPA-treated skin tumors (middle panels), and box plots to compare glutathione abundance between different tumor subpopulations (right panels). Scale bars indicate 300μm g, Immunohistochemical analysis against malonyldialdehyde (MDA), a lipid peroxidation marker and SOX2, a functional TPC marker in the same tumor samples (serially sectioned). Scale bars indicate 100μm. Statistics, sample sizes (n) and numbers of replications are presented in Methods, ‘Statistics and reproducibility’. * p<0.05, ** p<0.01, *** p<0.001
Figure 4.
Figure 4.. A subset of TPCs that are glycolytic supports glutathione metabolism and antioxidant response, functionally critical for TPC enrichment and tumorigenic potential in vivo.
a, A tSNE image of MALDI-MSI only with CD34+ cells b, Dimensionality reduction analysis (UMAP (resolution 0.5) and tSNE) of prospectively isolated CD34+ TPCs (1 WT tumor and 2 Sirt6 cKO tumors) c, A heatmap showing top 5 differentially expressed genes in each cluster d, Cd34 and a6 integrin expression levels in UMAP graphs (the very left), and violin plots (right two) showing stemness and pro-differentiation program score in each cluster e, Violin plots showing glycolysis, pentose phosphate pathway (PPP), antioxidant response, and glutathione metabolism program score in the cluster I and IV f, Representative FACS plots to analyze and isolate tumor-propagating cells (α6 integrinhigh/CD34+) from Sirt6 WT or Sirt6-deleted skin tumors with DCA (top) or with DCA and NAC (bottom). DCA treatment plots in the top are the same as the ones in Fig. 2C. g, The number of tumorspheres at day 10 in SCC13 cells in indicated conditions. Data indicate mean ±S.E.M. h, Scatter plot of glycolysis score and antioxidant gene signature score in single cells of two classical subtypes of HNSCC with a linear regression. Pearson correlation coefficients are 2.7e−48 for MEEI20 and 6.2e−06 for MEEI6, respectively. Statistics, sample sizes (n) and numbers of replications are presented in Methods, ‘Statistics and reproducibility’. * p<0.05, ** p<0.01, *** p<0.001

References

    1. Visvader JE & Lindeman GJ Cancer Stem Cells: Current Status and Evolving Complexities. Cell Stem Cell 10, 717–728 (2012). - PubMed
    1. Frank NY, Schatton T & Frank MH The therapeutic promise of the cancer stem cell concept. J. Clin. Invest 120, 41–50 (2010). - PMC - PubMed
    1. Malanchi I et al. Cutaneous cancer stem cell maintenance is dependent on β-catenin signalling. Nature 452, 650–653 (2008). - PubMed
    1. Lapouge GEL et al. Skin squamous cell carcinoma propagating cells increase with tumour progression and invasiveness. The EMBO Journal 31, 4563–4575 (2012). - PMC - PubMed
    1. Boumahdi S et al. SOX2 controls tumour initiation and cancer stem-cell functions in squamous-cell carcinoma. Nature 10, 246–250 (2014). - PubMed

REFERENCES for METHODS

    1. Rhodes DR et al. Oncomine 3.0: genes, pathways, and networks in a collection of 18,000 cancer gene expression profiles. Neoplasia (New York, N.Y.) 9, 166–180 (2007). - PMC - PubMed
    1. Barretina J et al. The Cancer Cell Line Encyclopedia enables predictive modelling of anticancer drug sensitivity. Nature 483, 603–607 (2012). - PMC - PubMed
    1. Lawrence MS et al. Comprehensive genomic characterization of head and neck squamous cell carcinomas. Nature 517, 576–582 (2015). - PMC - PubMed
    1. Fitamant J et al. YAP Inhibition Restores Hepatocyte Differentiation in Advanced HCC, Leading to Tumor Regression. Cell reports 10, 1692–1707 (2015). - PMC - PubMed
    1. Dobin A et al. STAR: ultrafast universal RNA-seq aligner. Bioinformatics 29, 15–21 (2013). - PMC - PubMed

Publication types