. 2021 Feb;3(2):166-181.
doi: 10.1038/s42255-020-00338-8. Epub 2021 Feb 22.

Multiple cell types contribute to the atherosclerotic lesion fibrous cap by PDGFRβ and bioenergetic mechanisms

Affiliations

Multiple cell types contribute to the atherosclerotic lesion fibrous cap by PDGFRβ and bioenergetic mechanisms

Alexandra A C Newman et al. Nat Metab. 2021 Feb.

Abstract

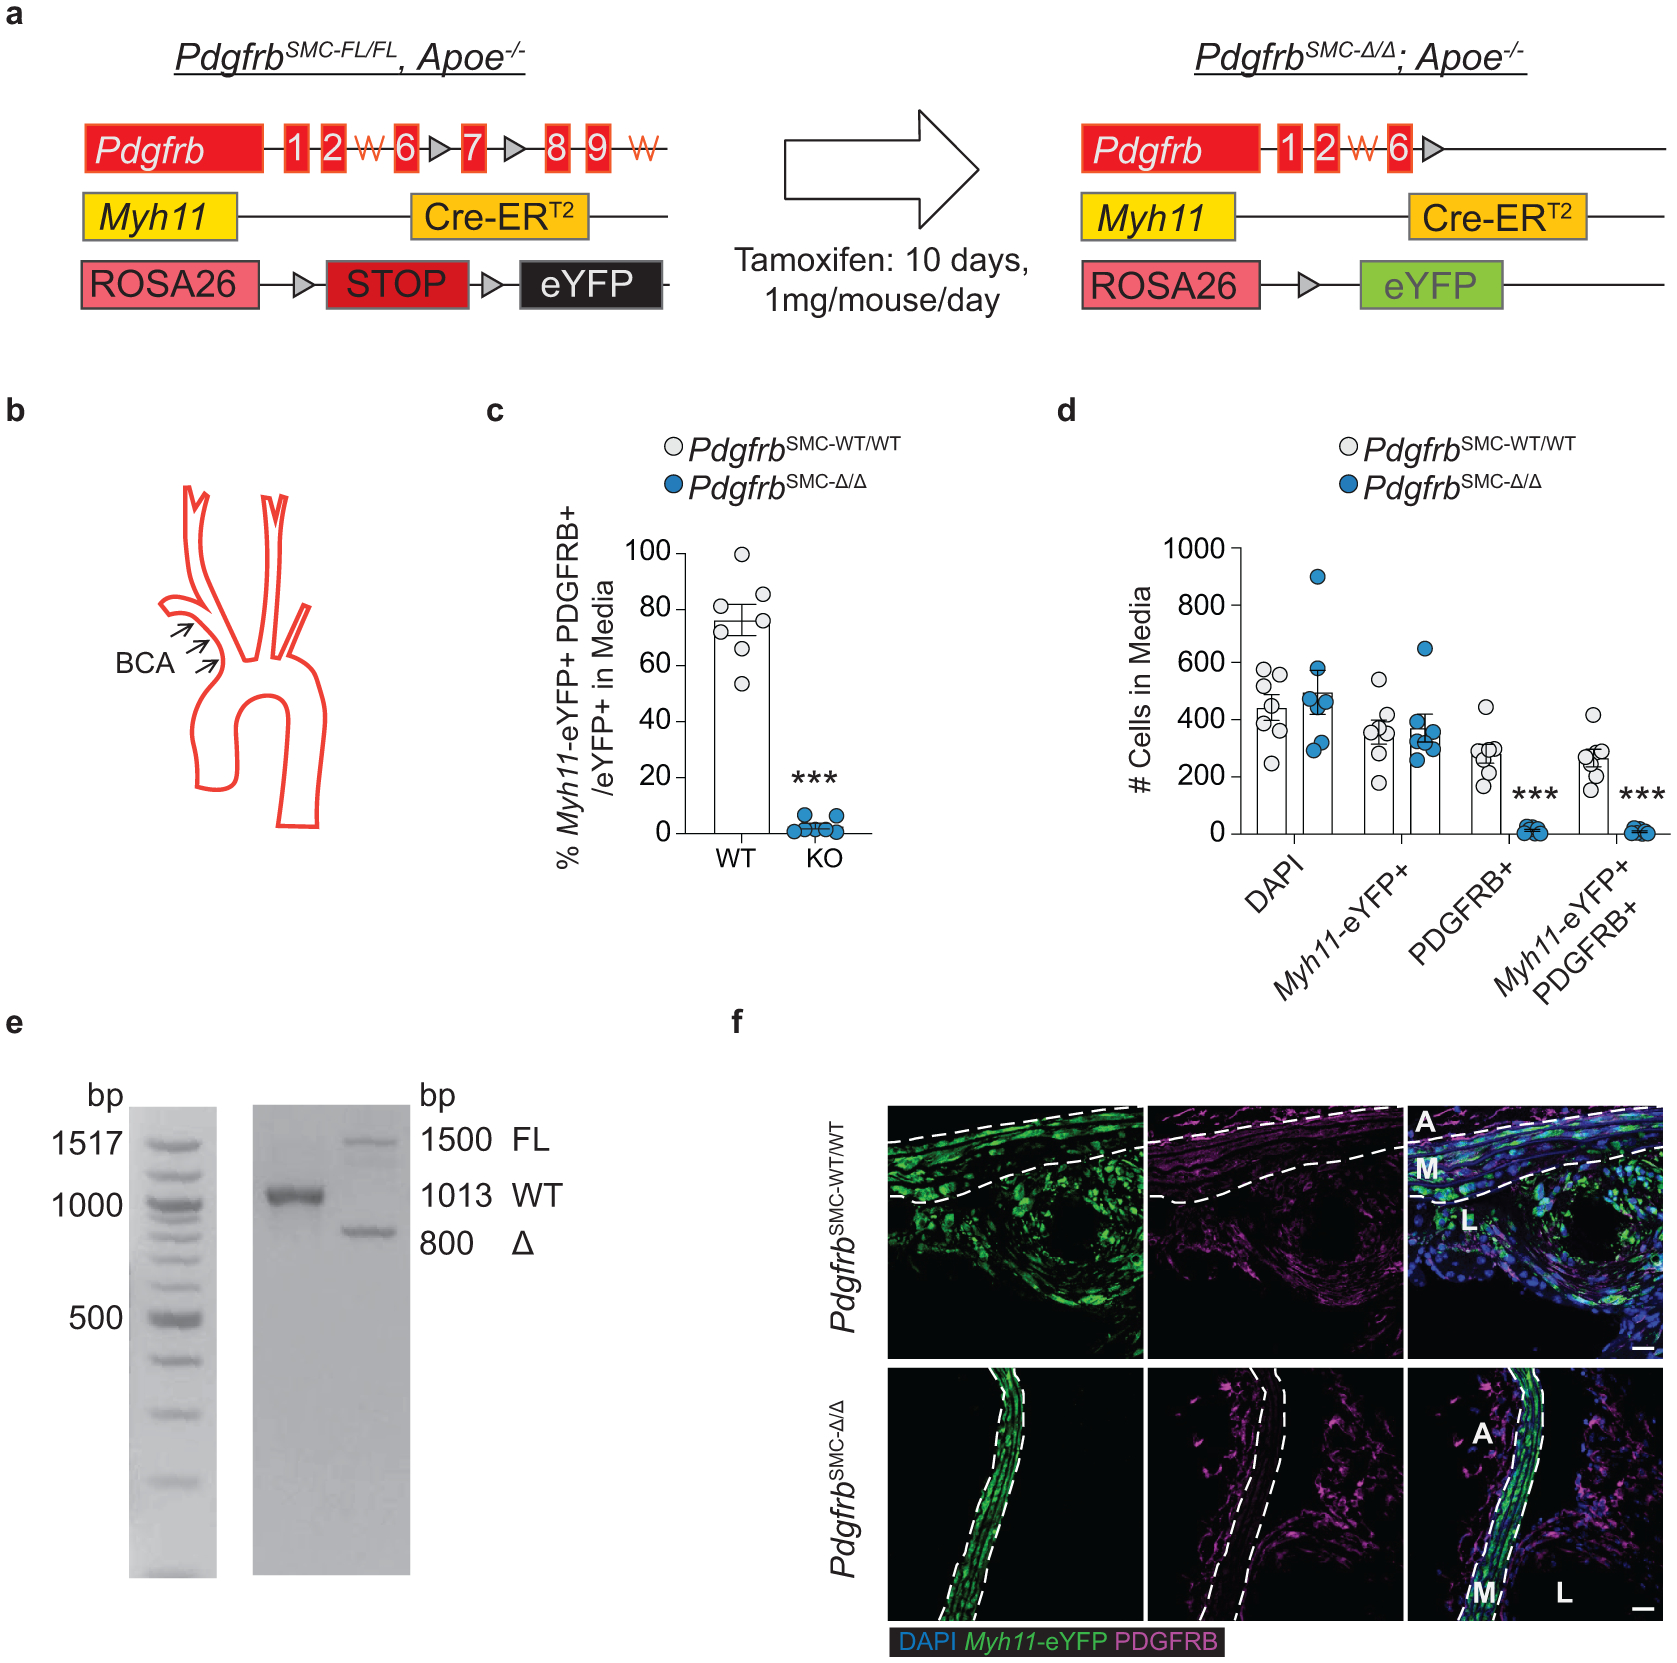
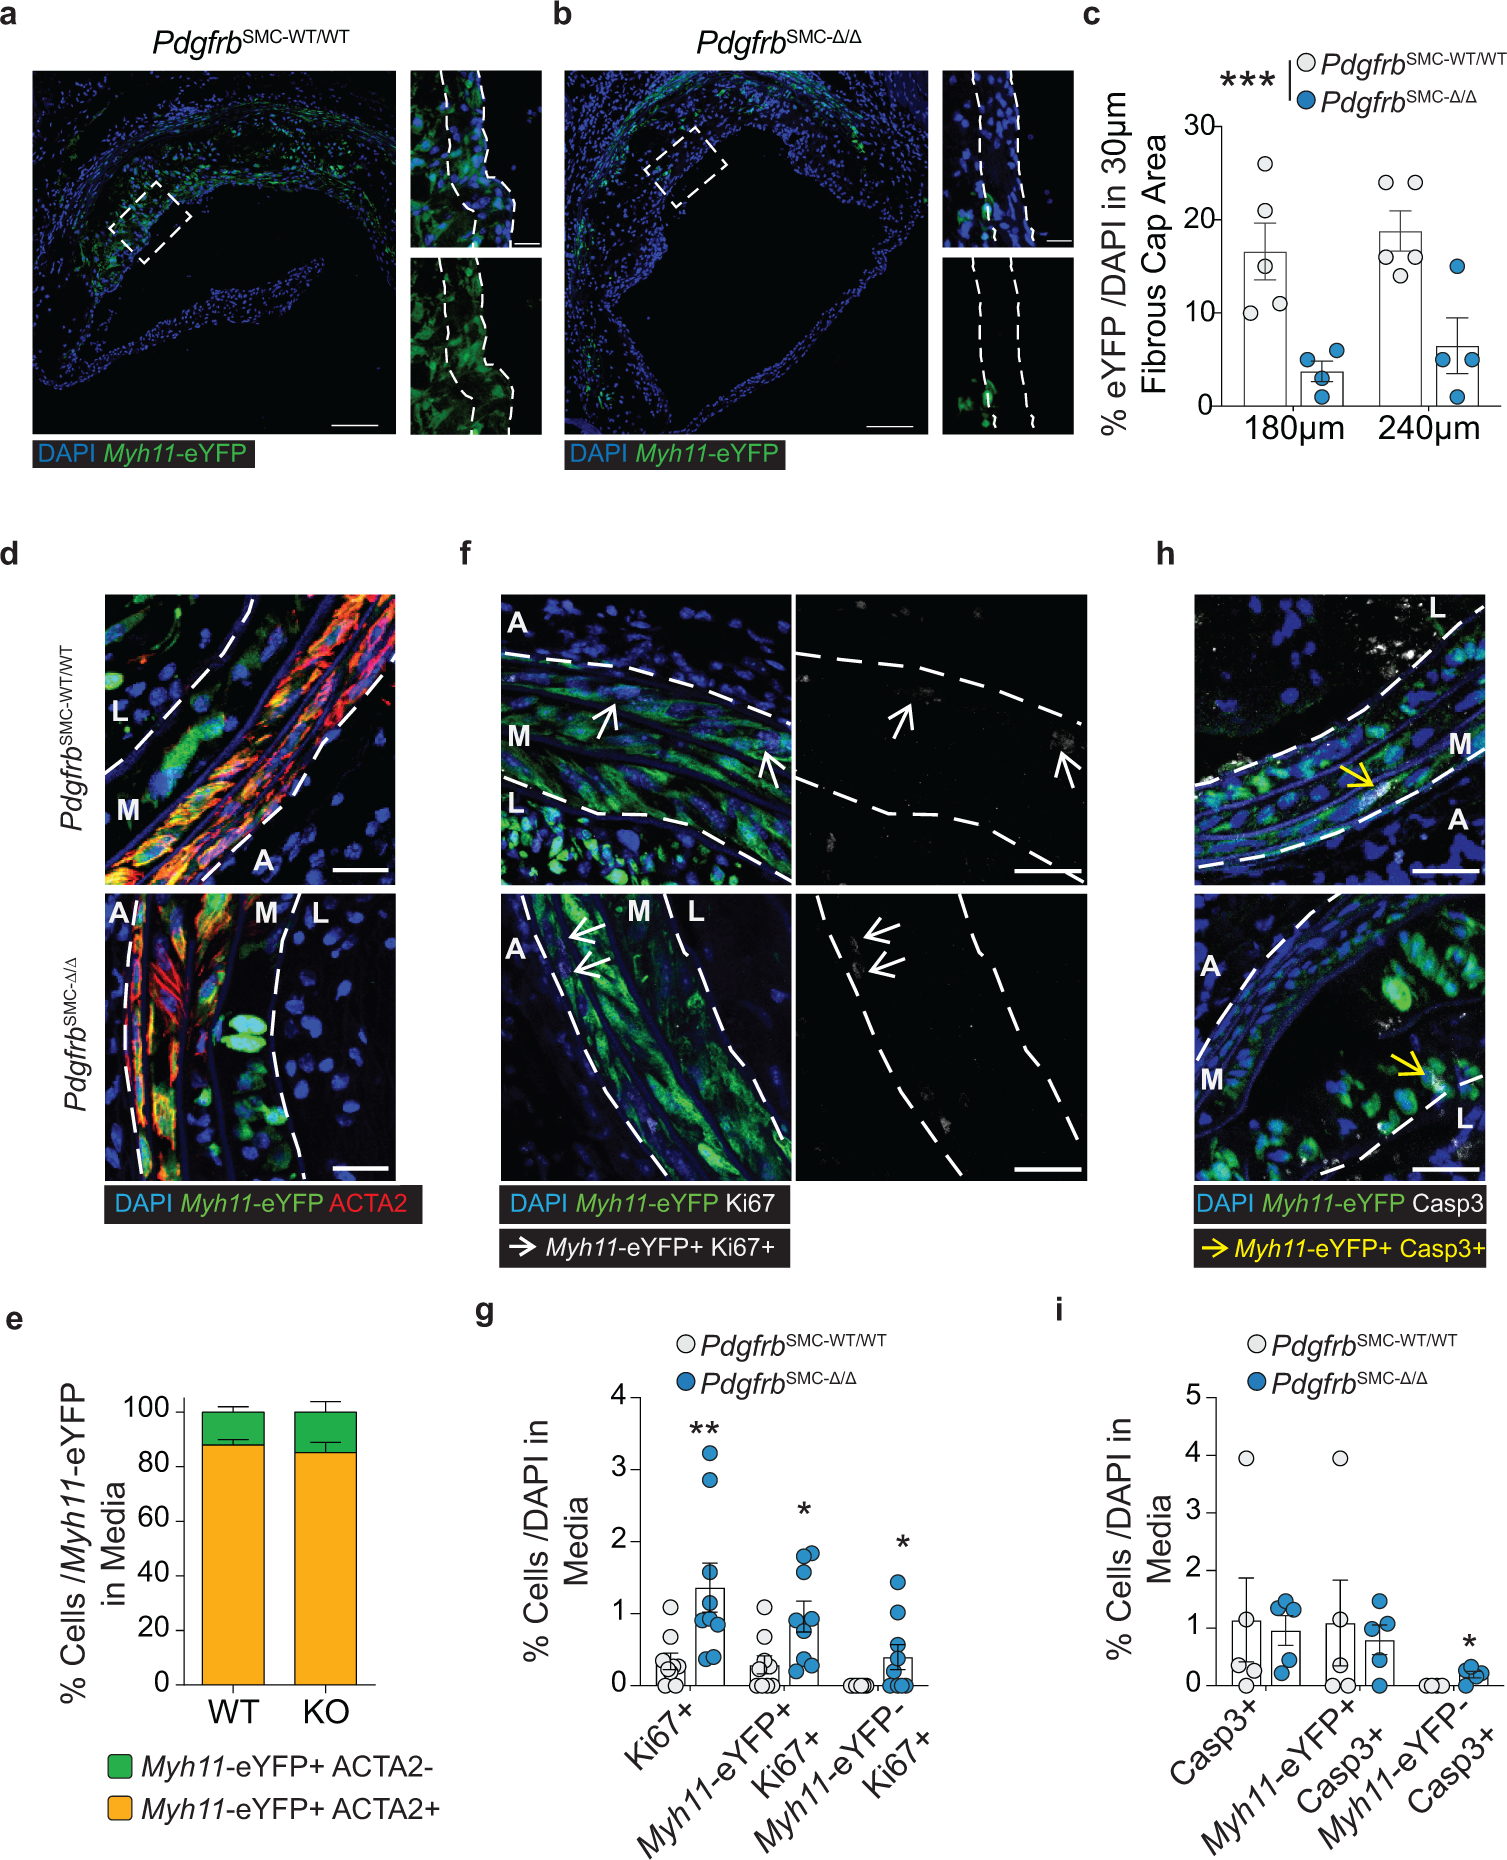
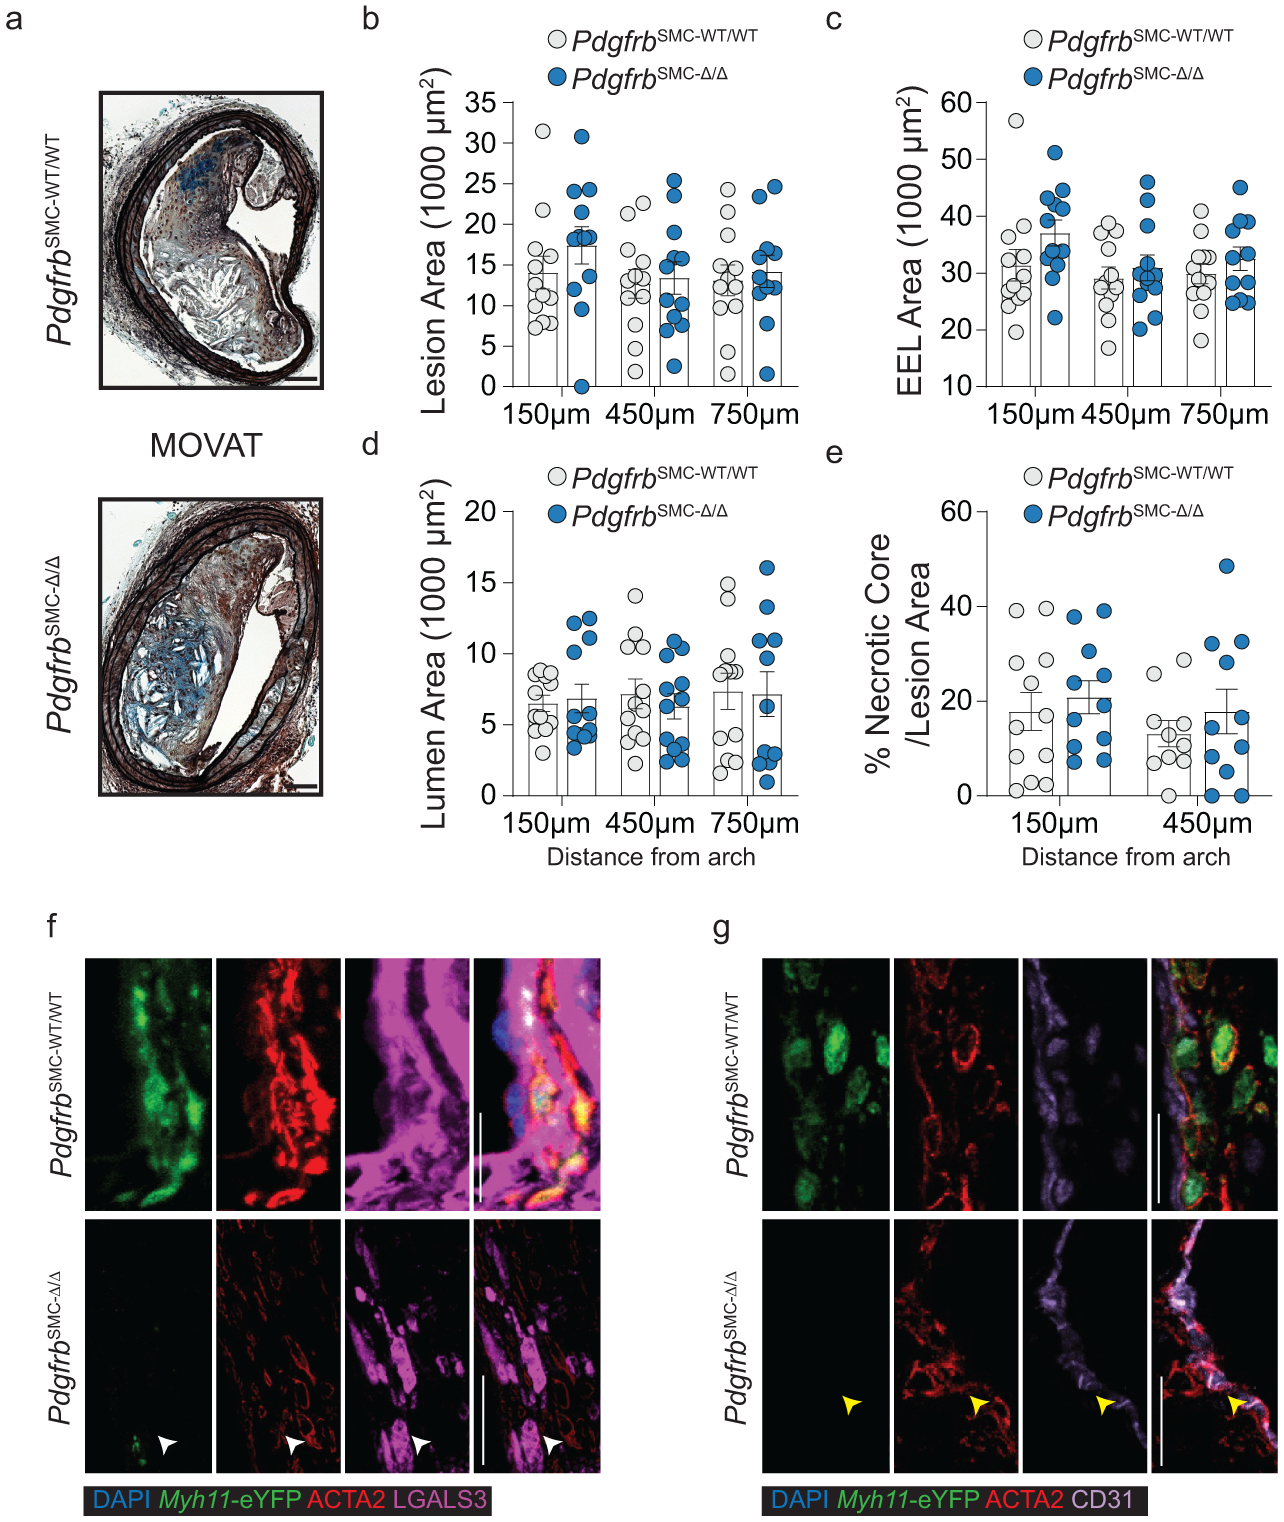
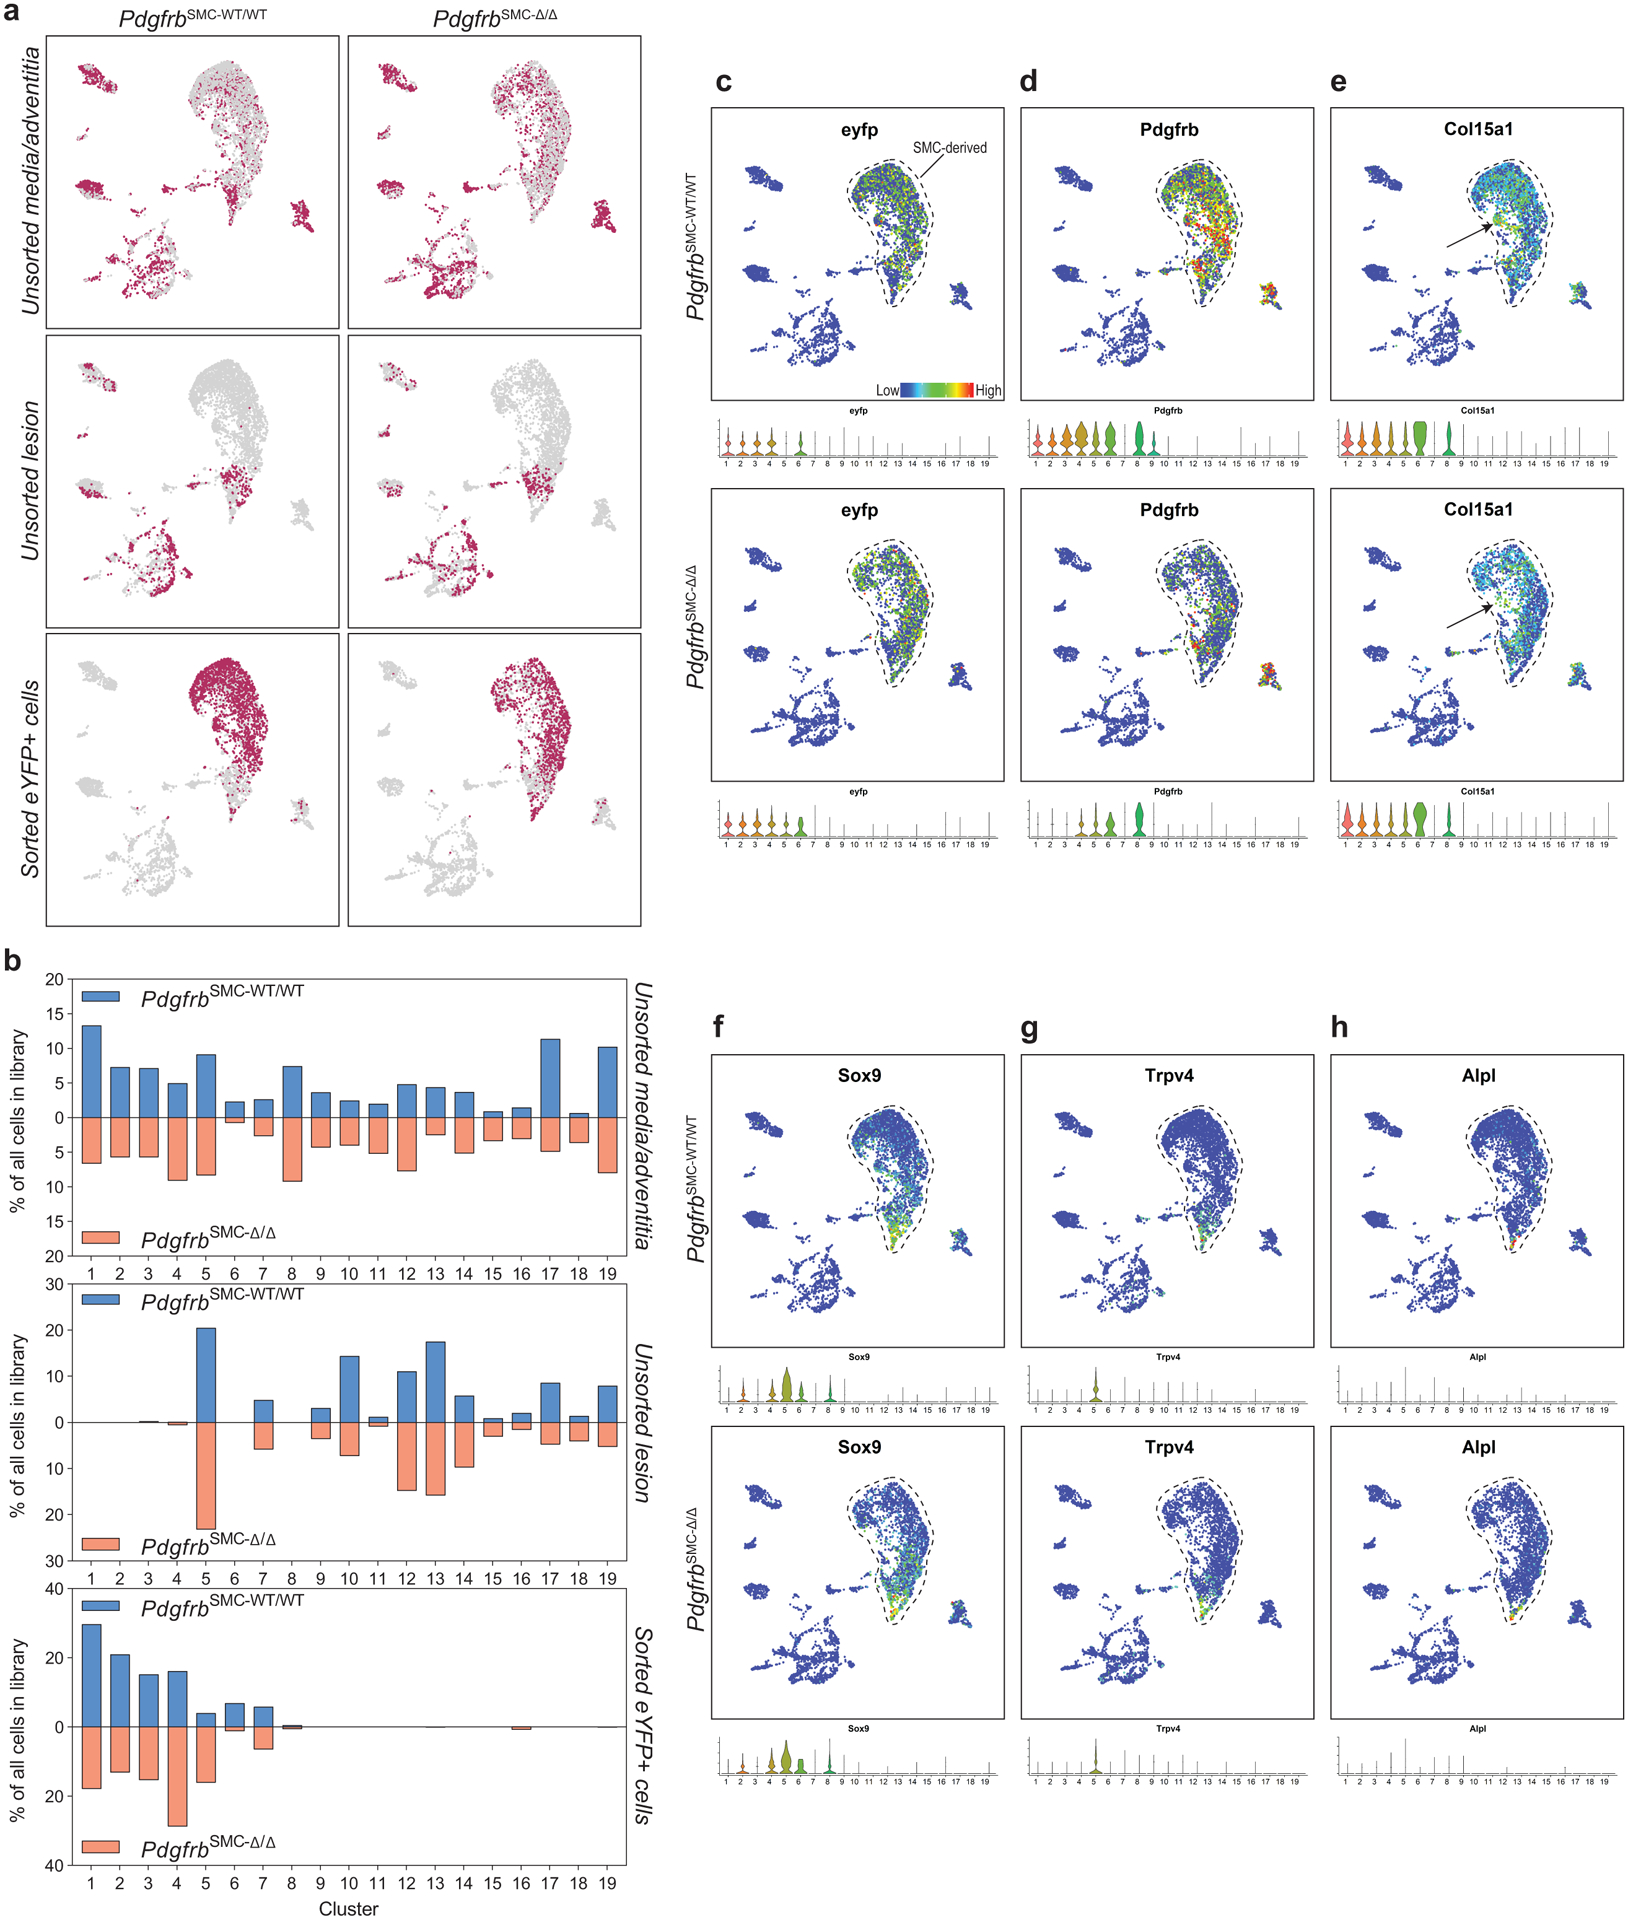
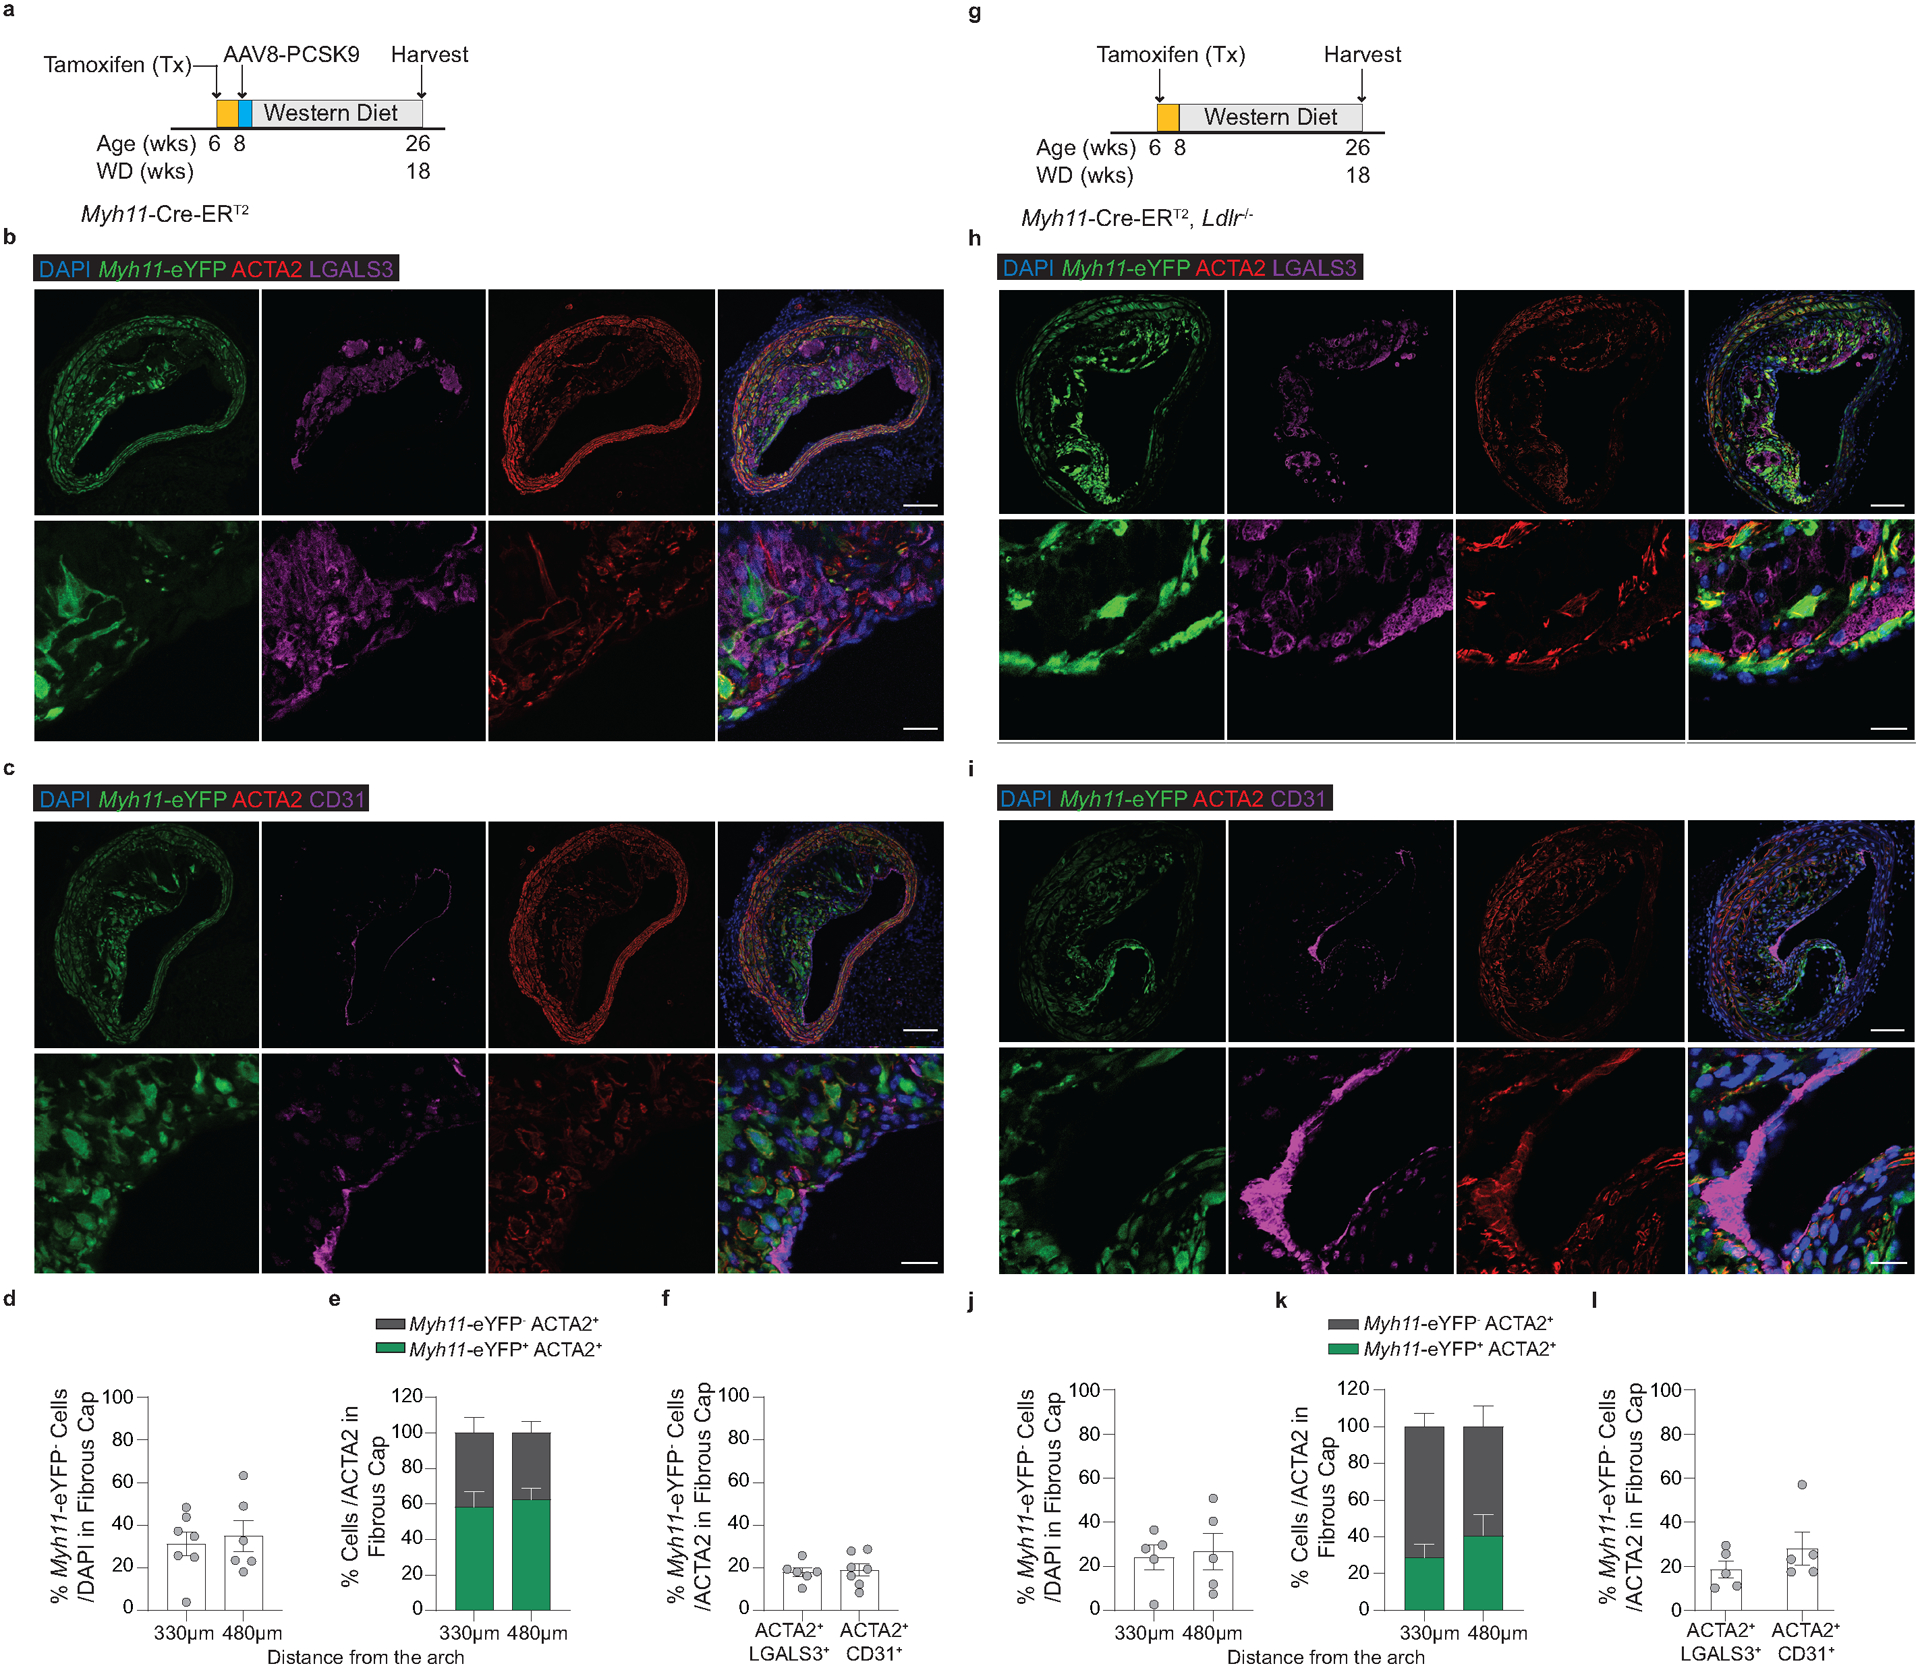
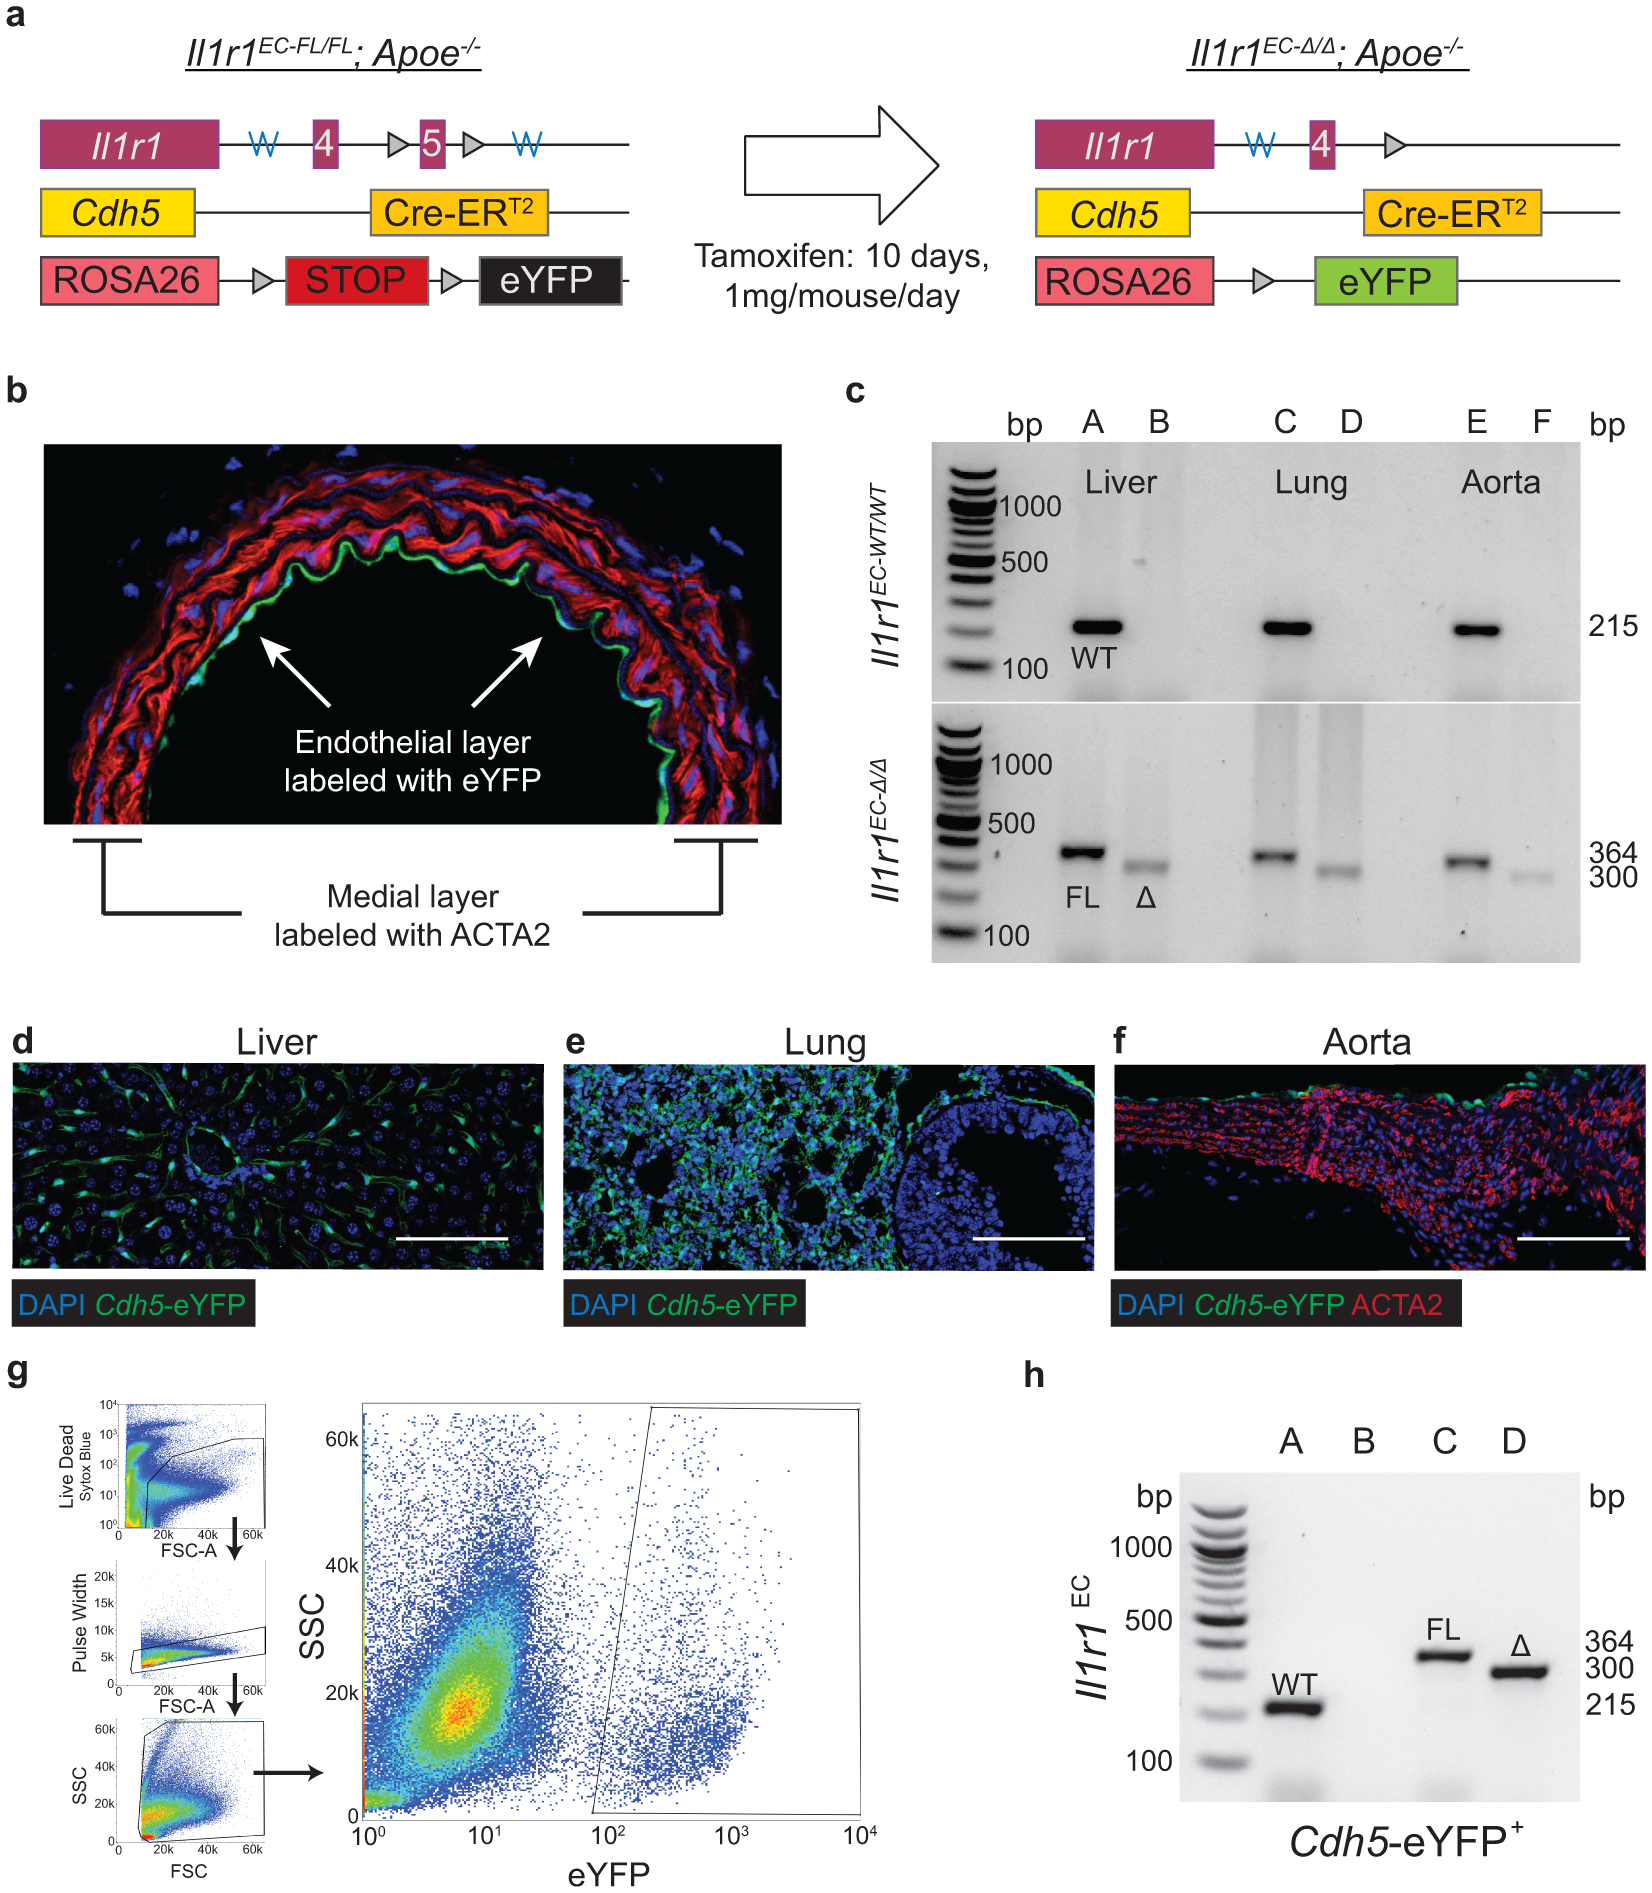
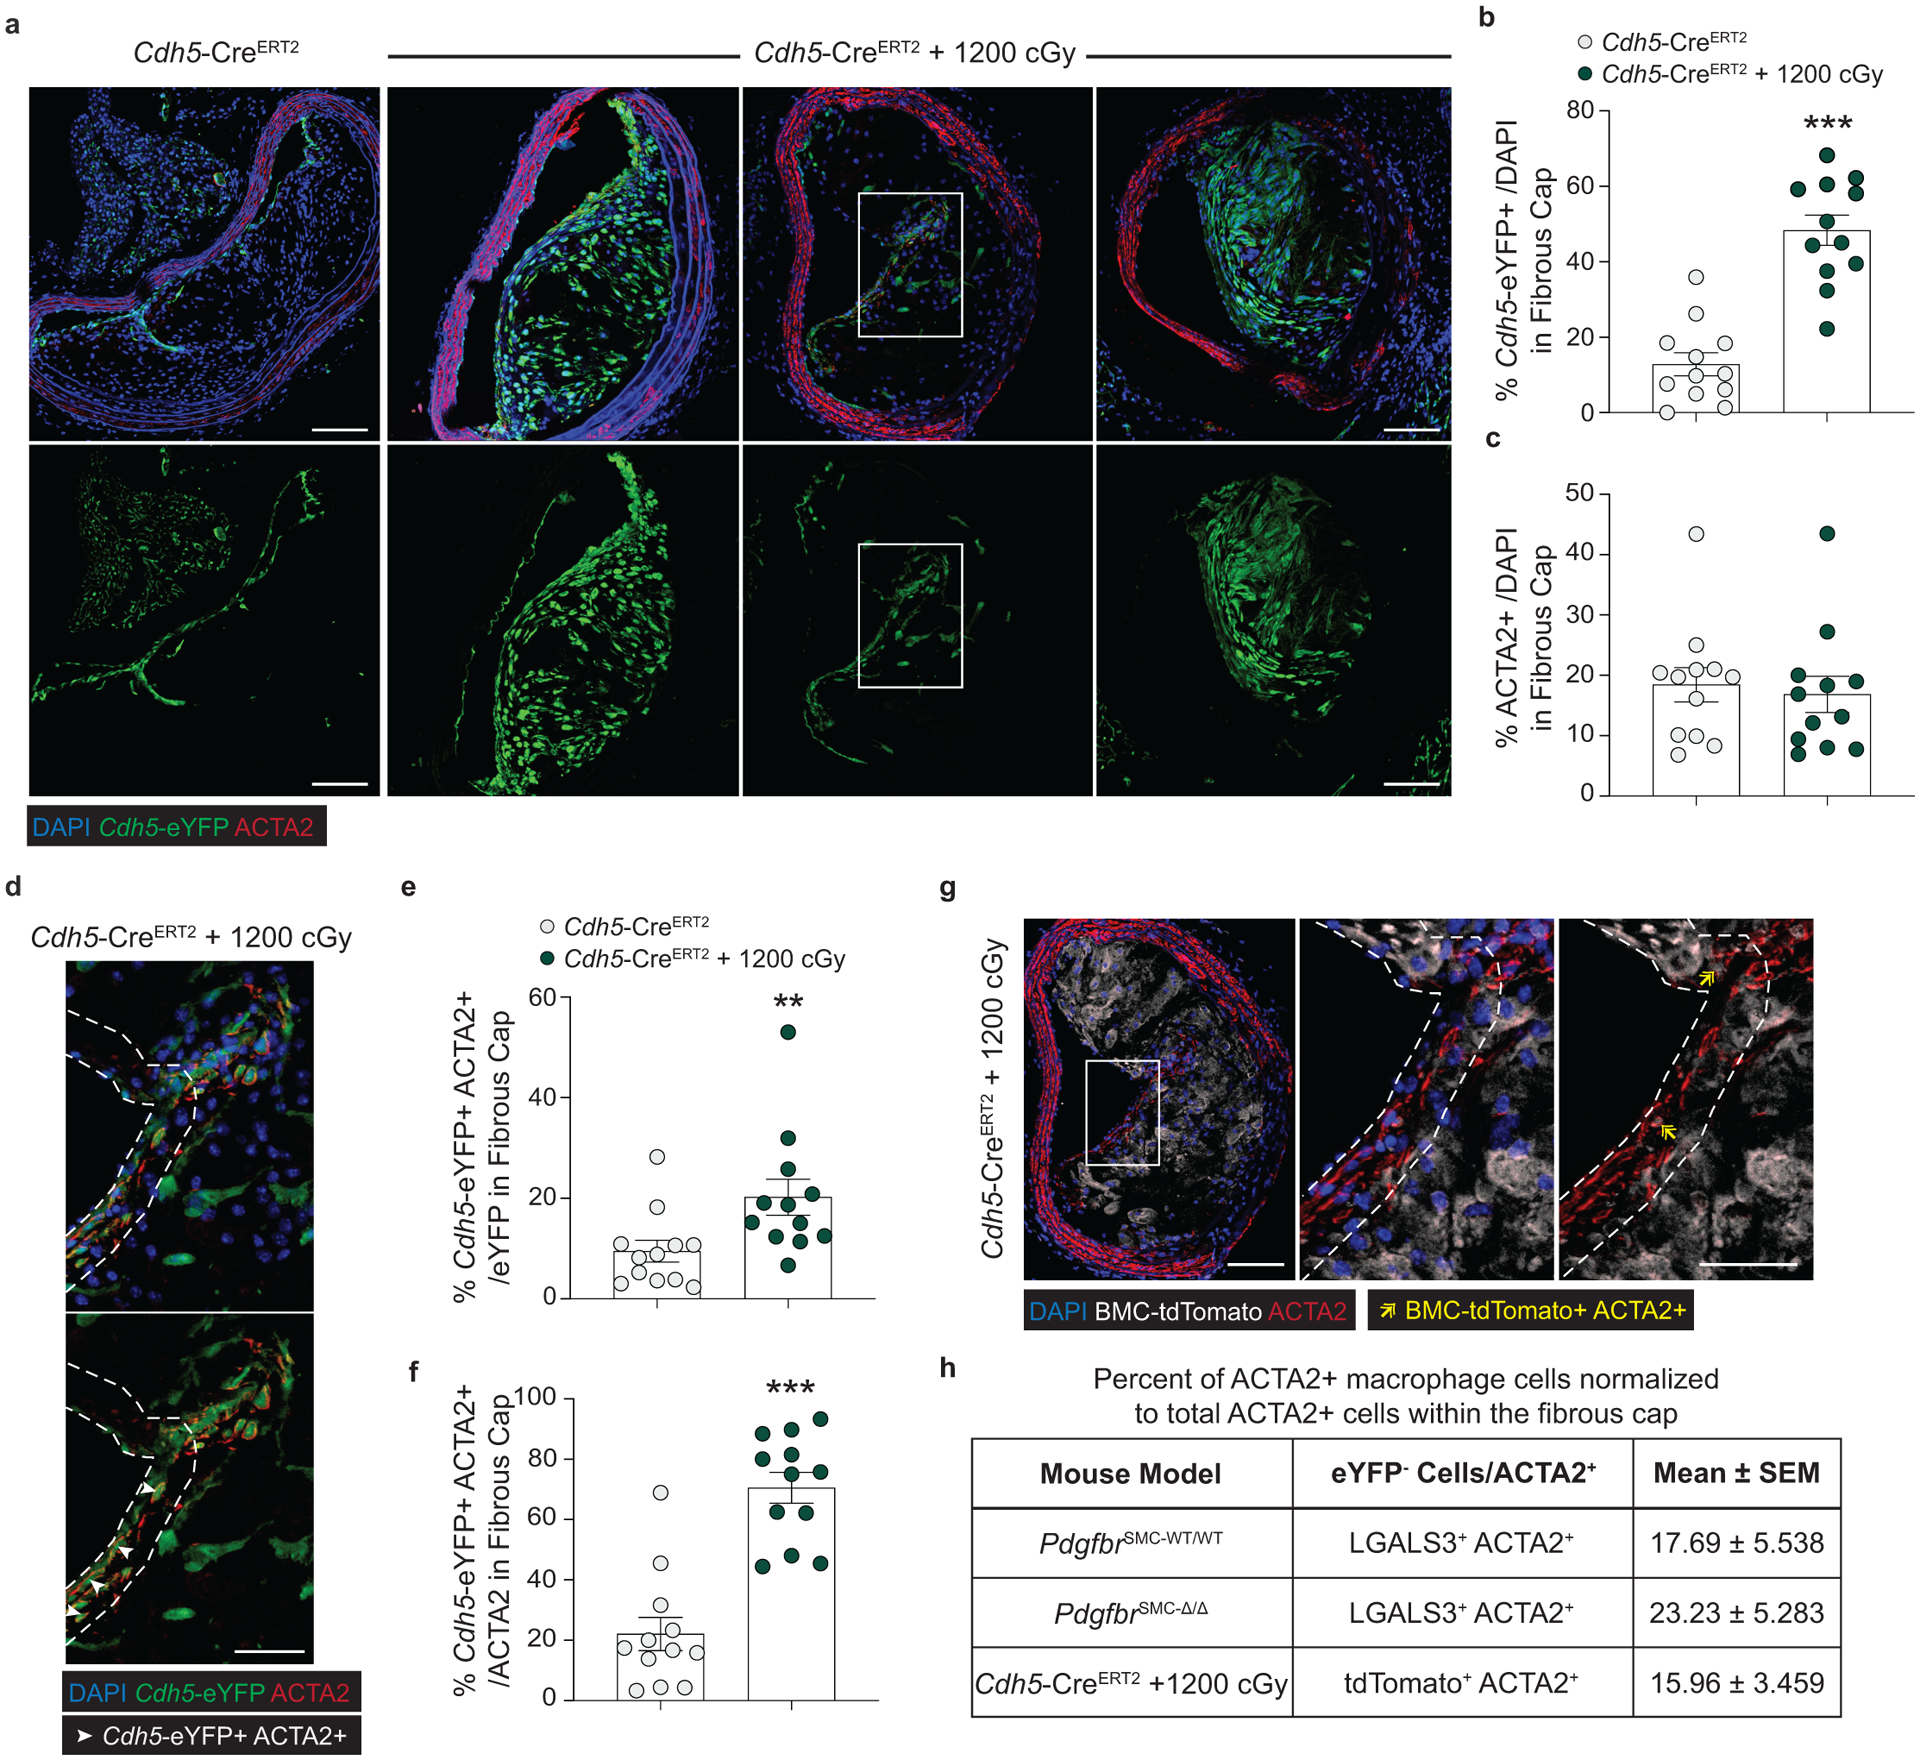
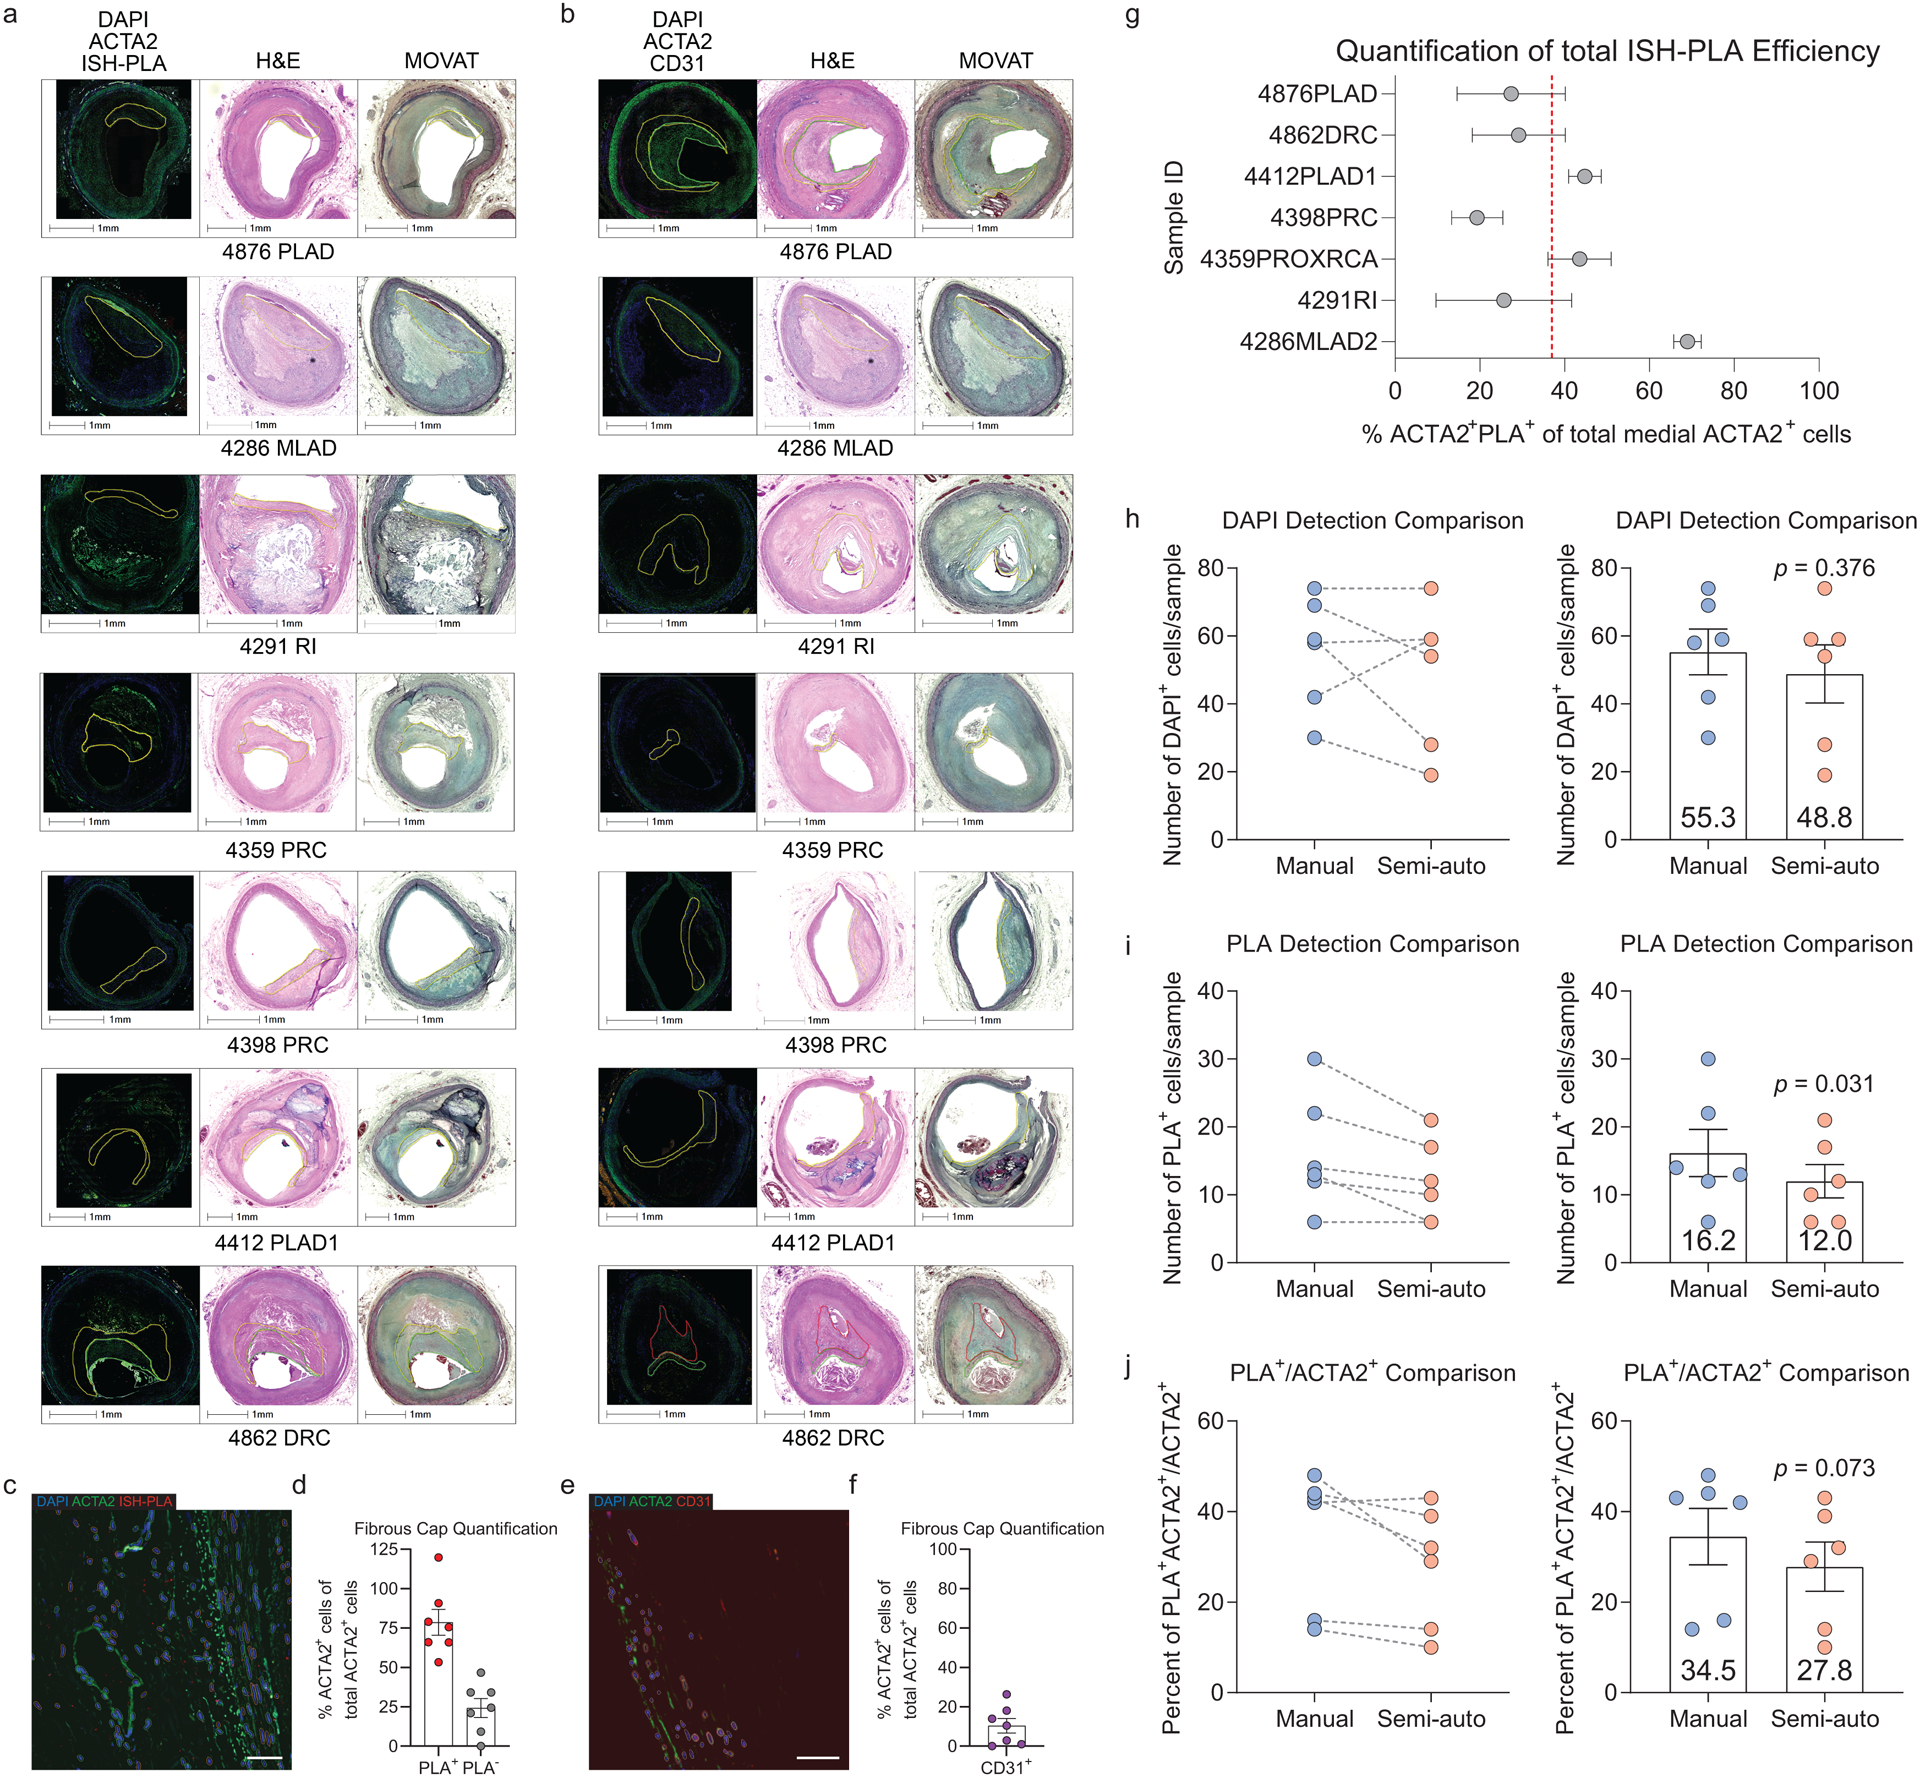
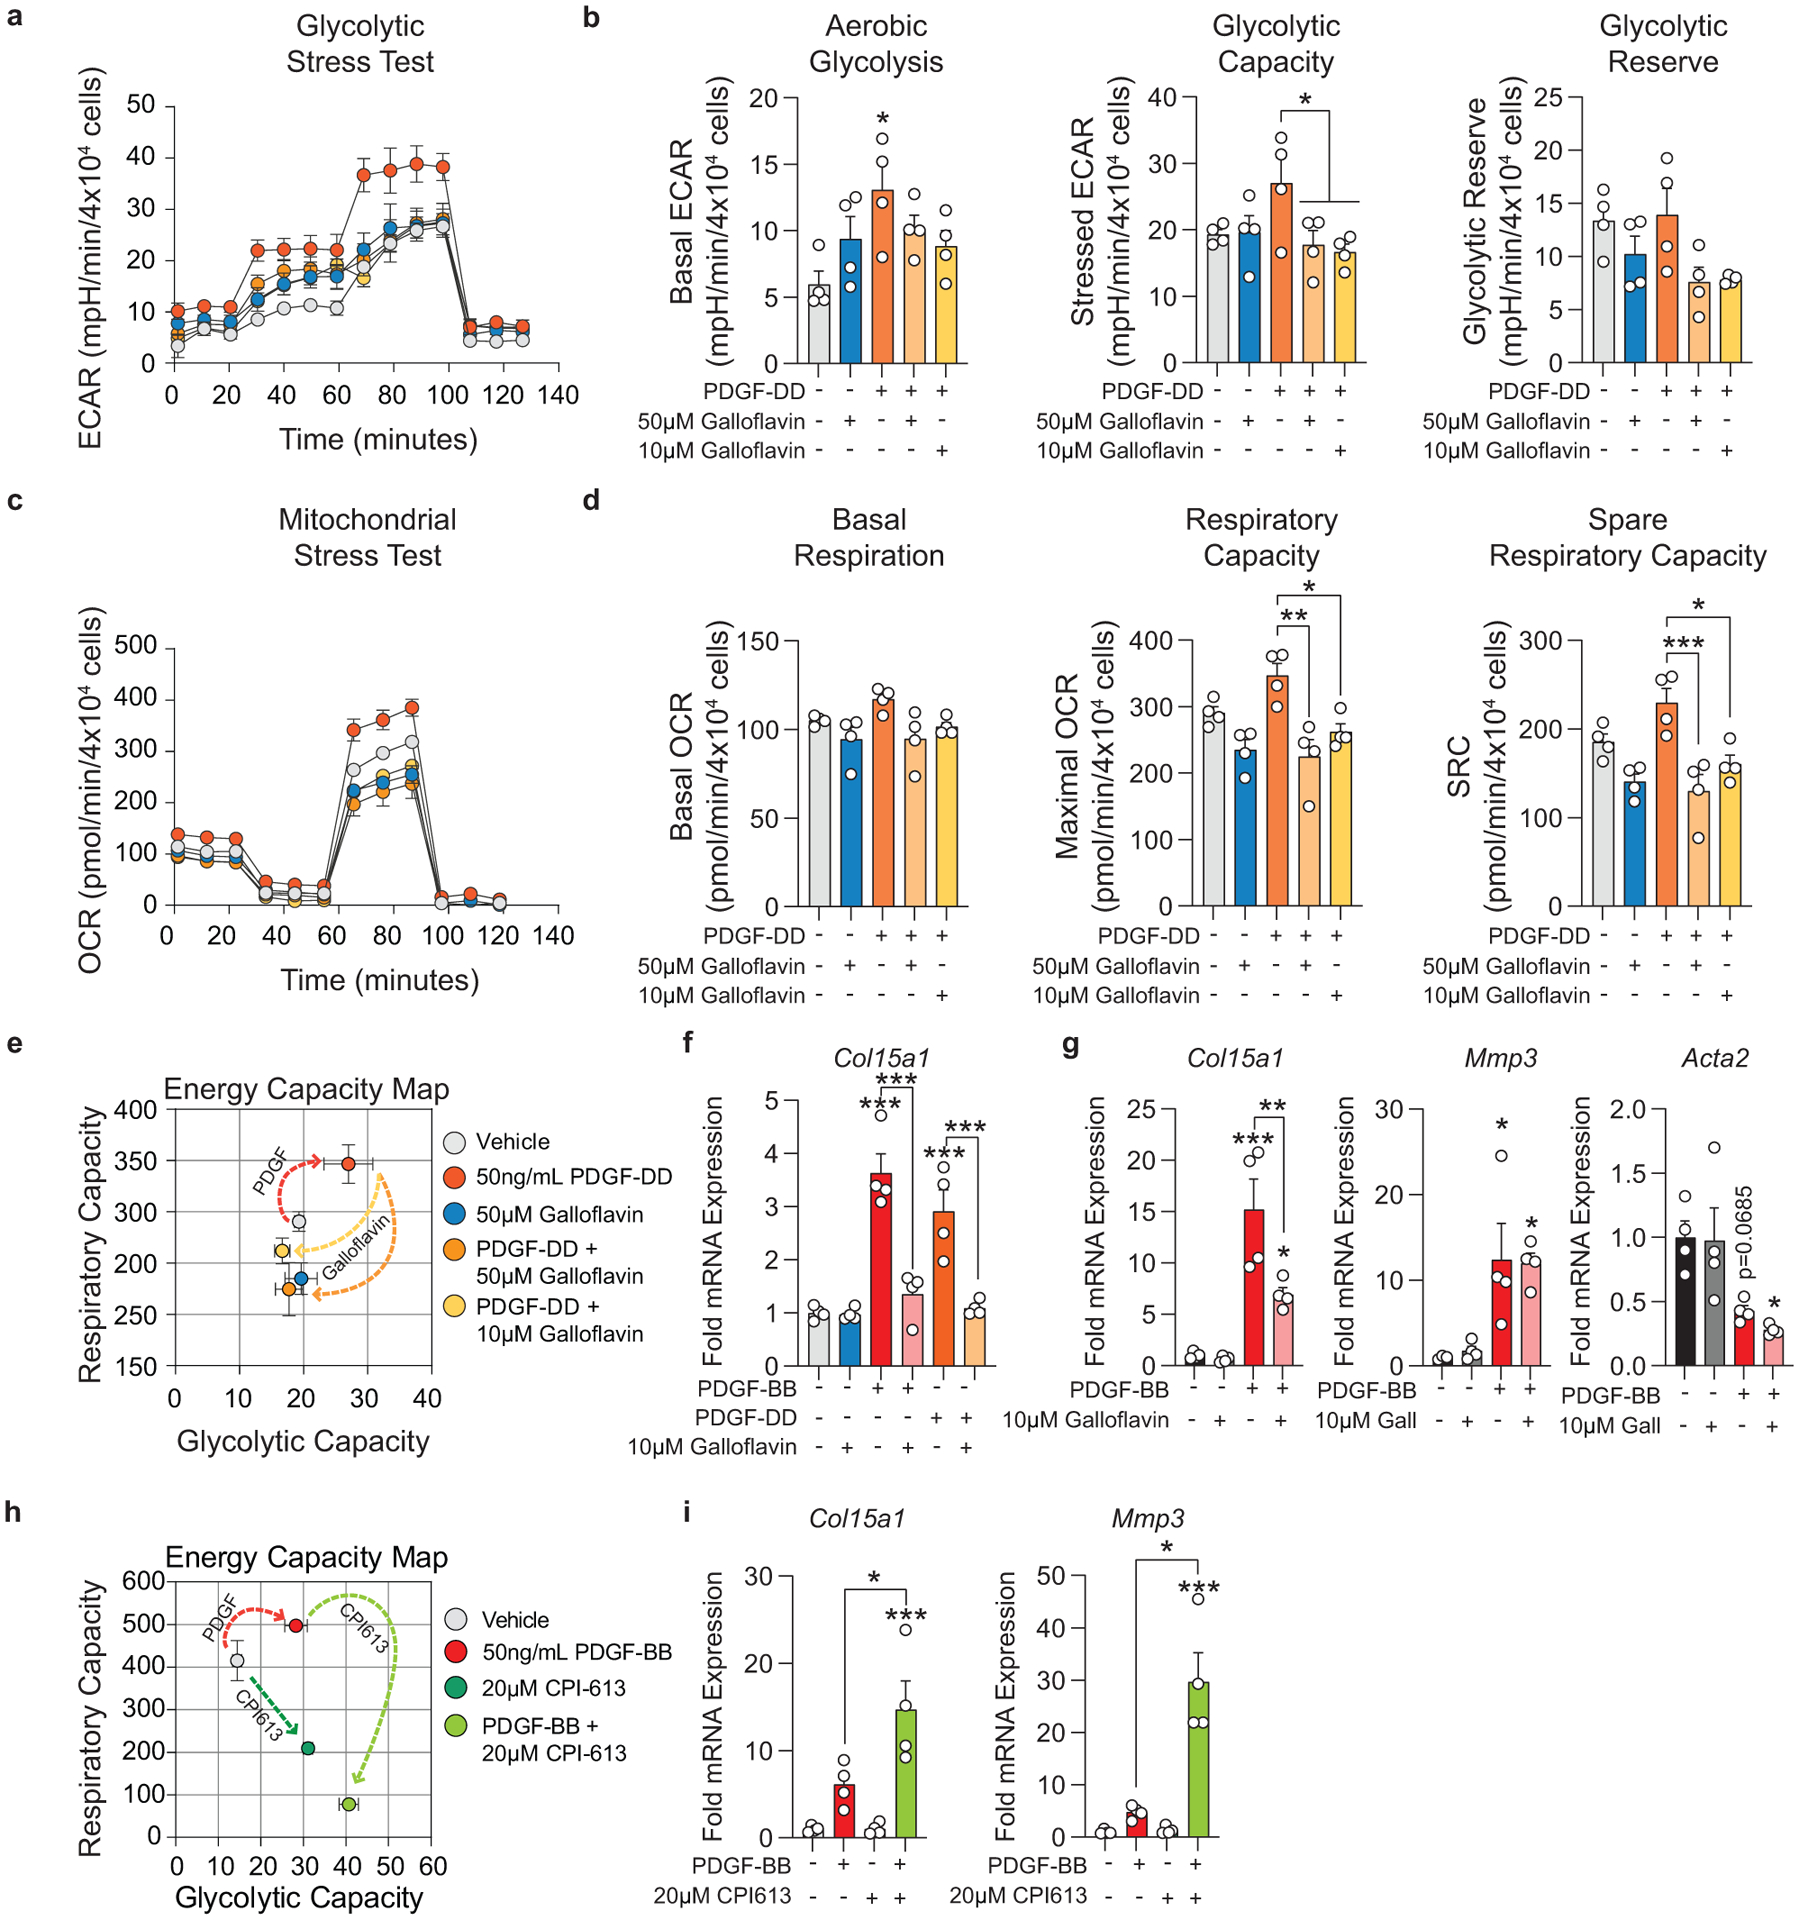
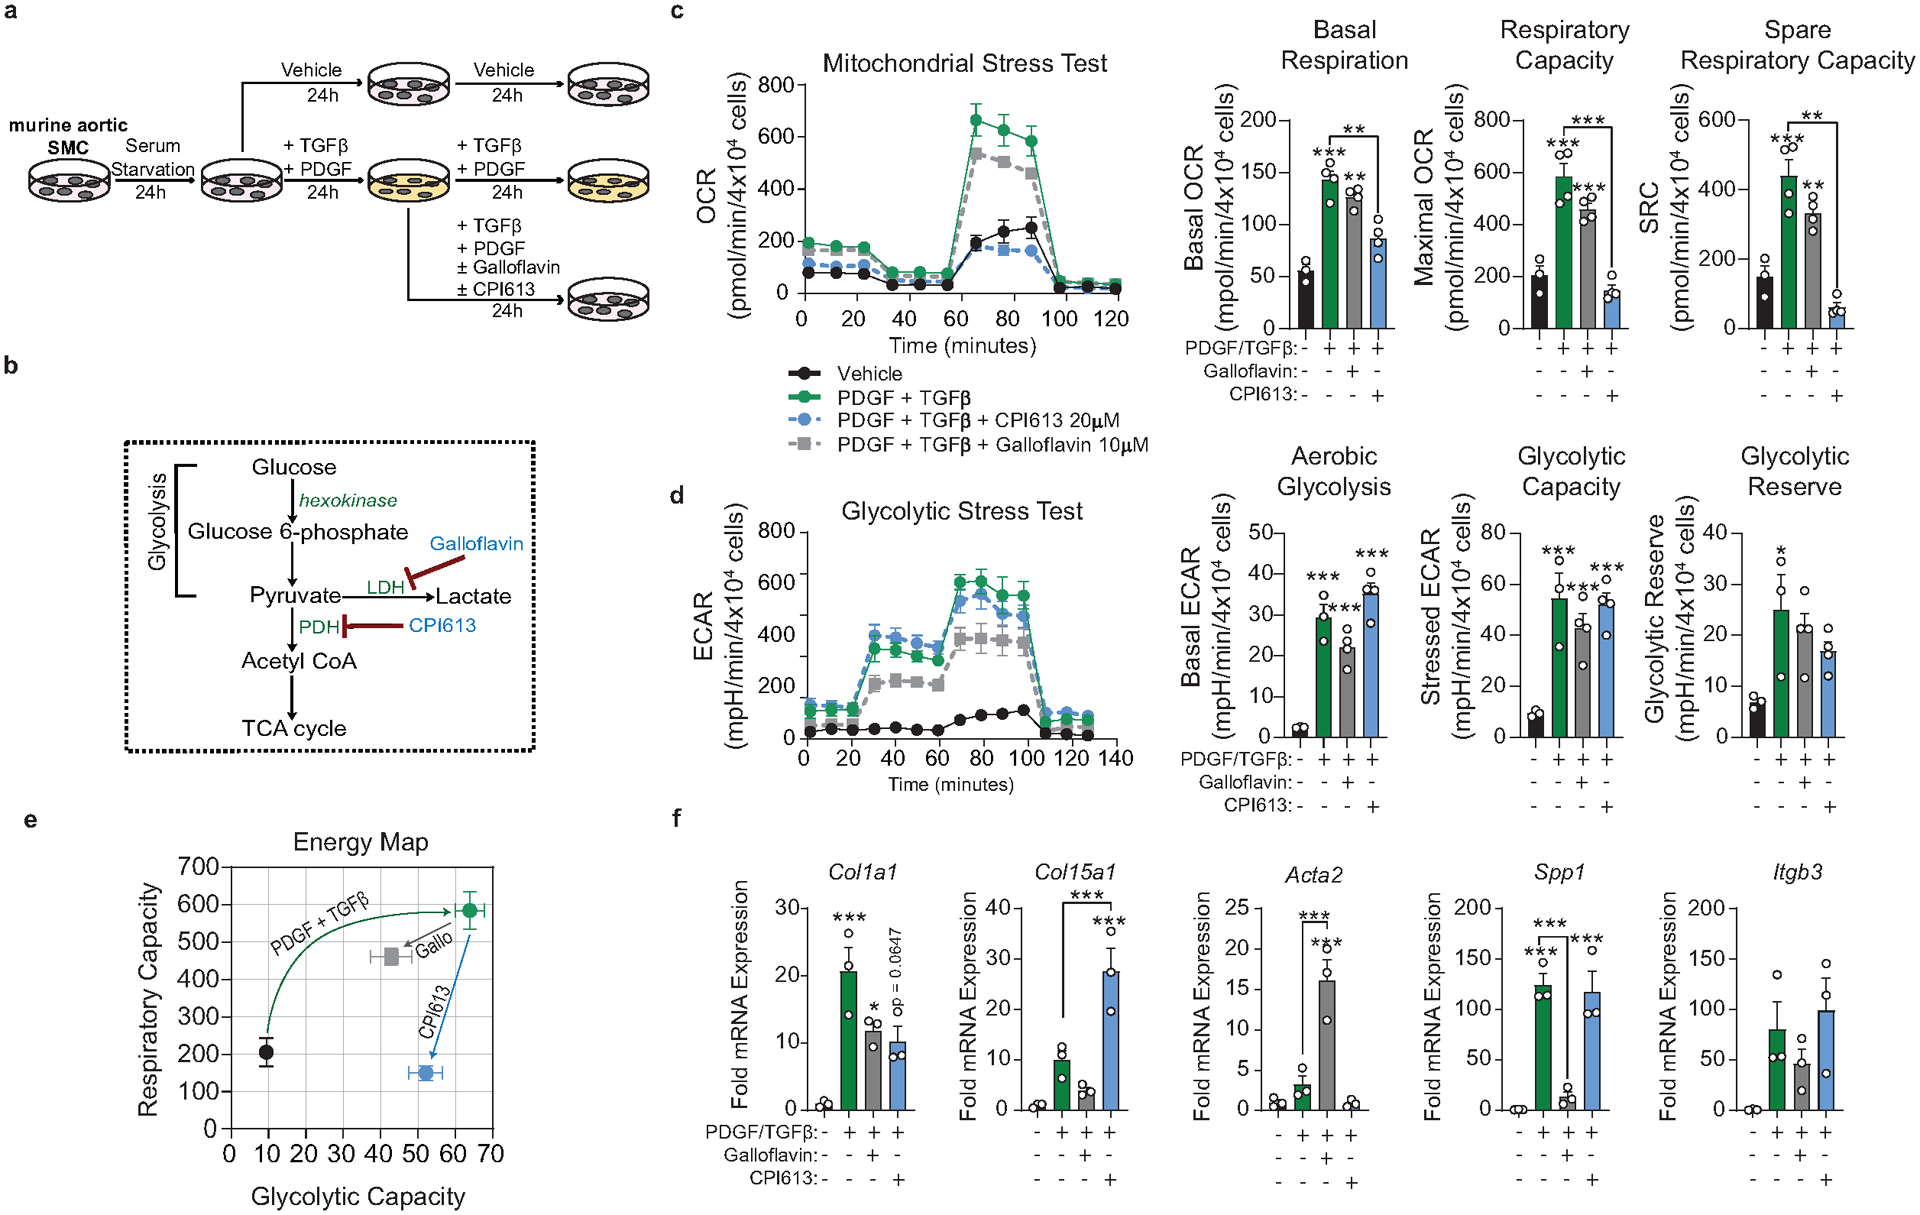
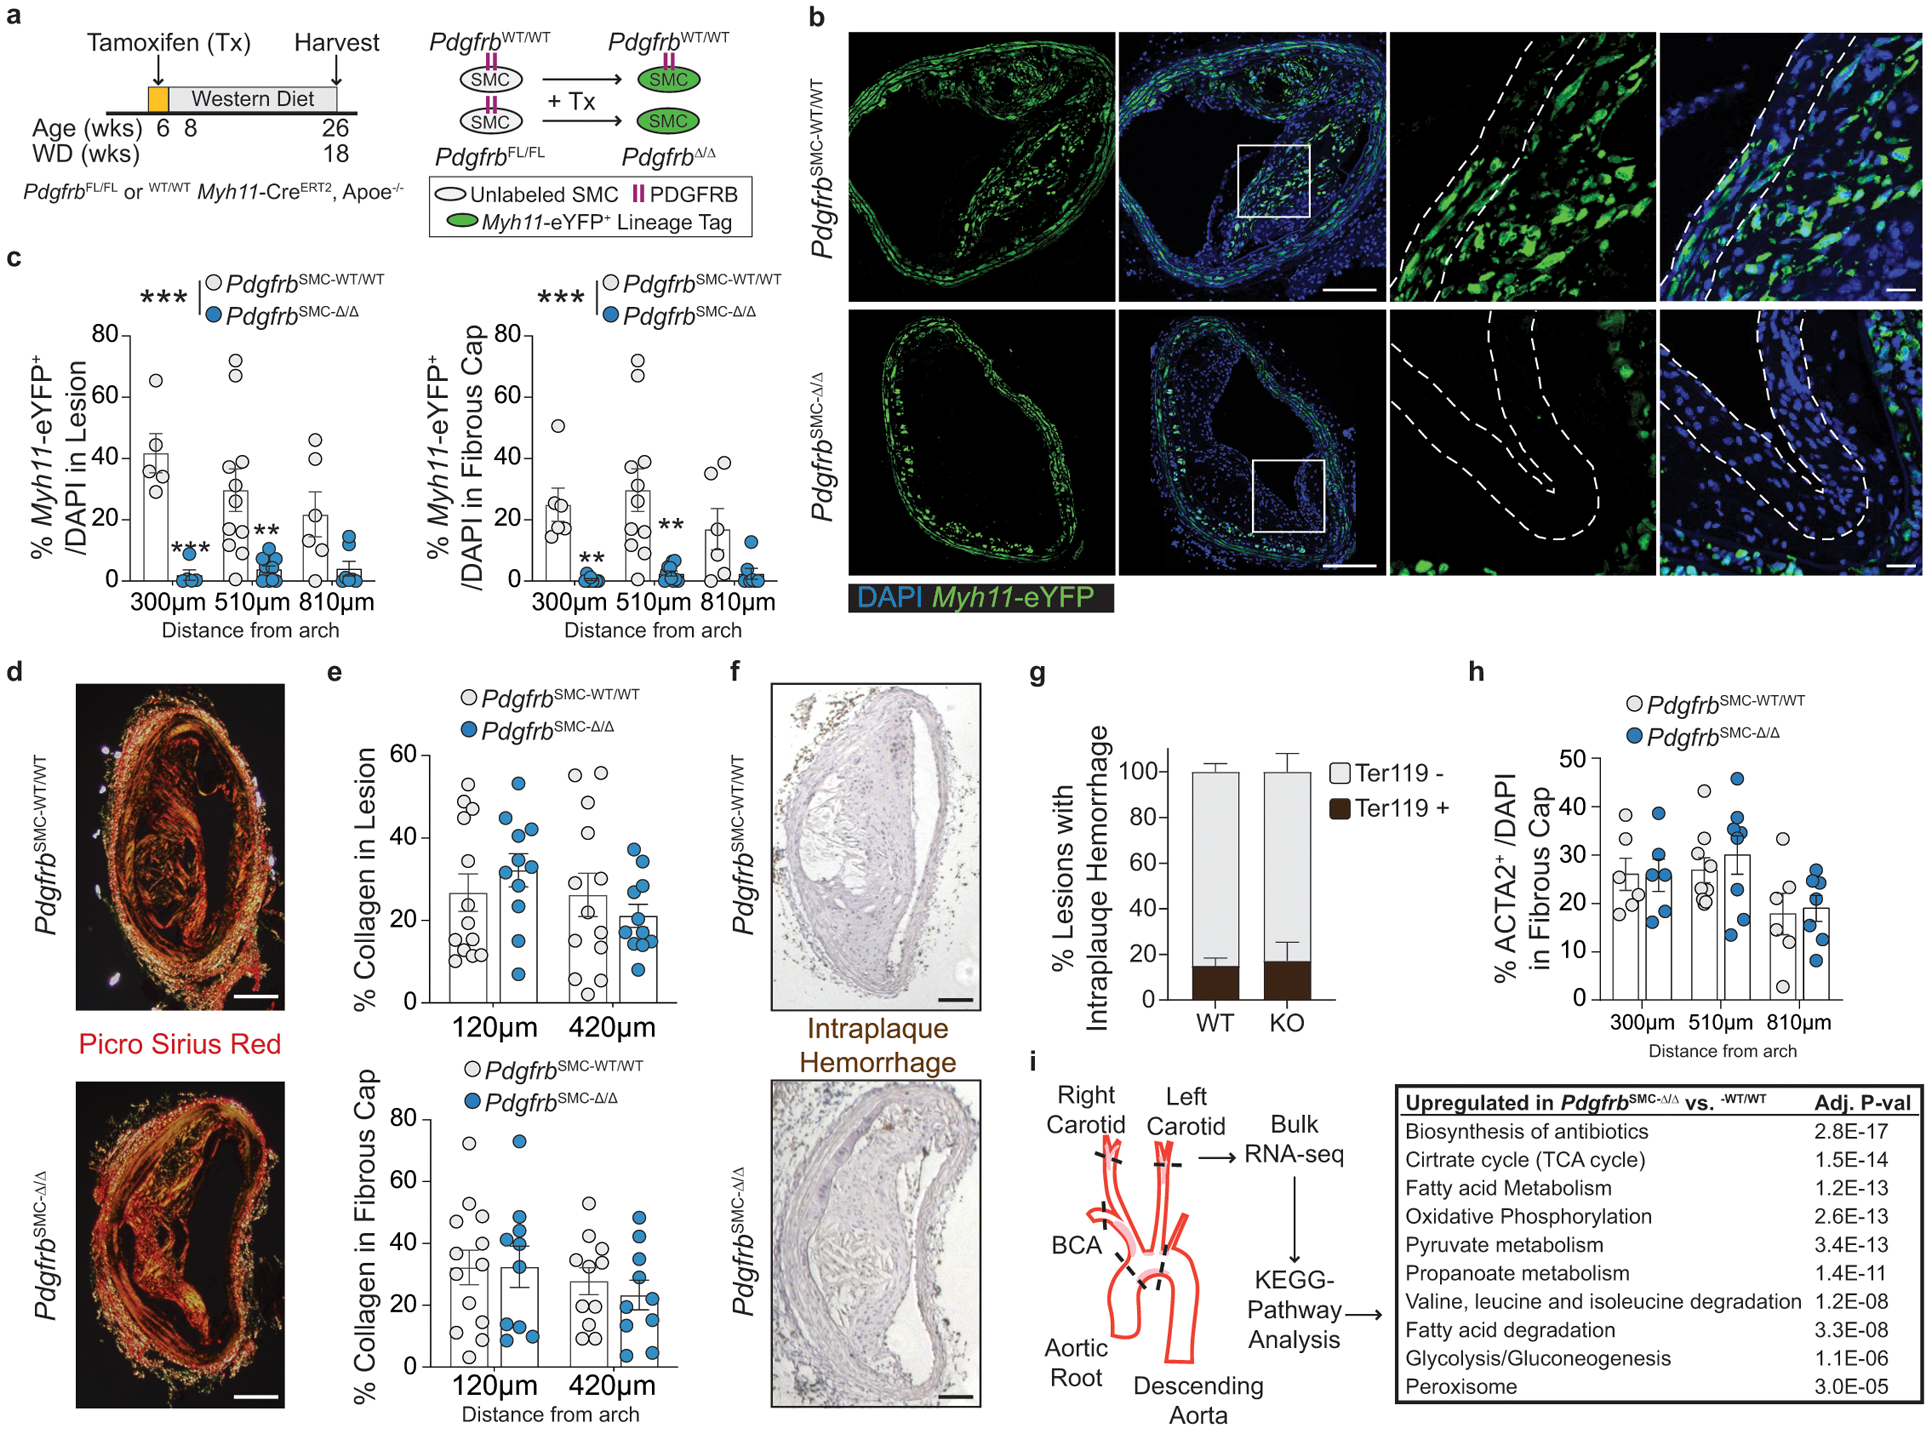
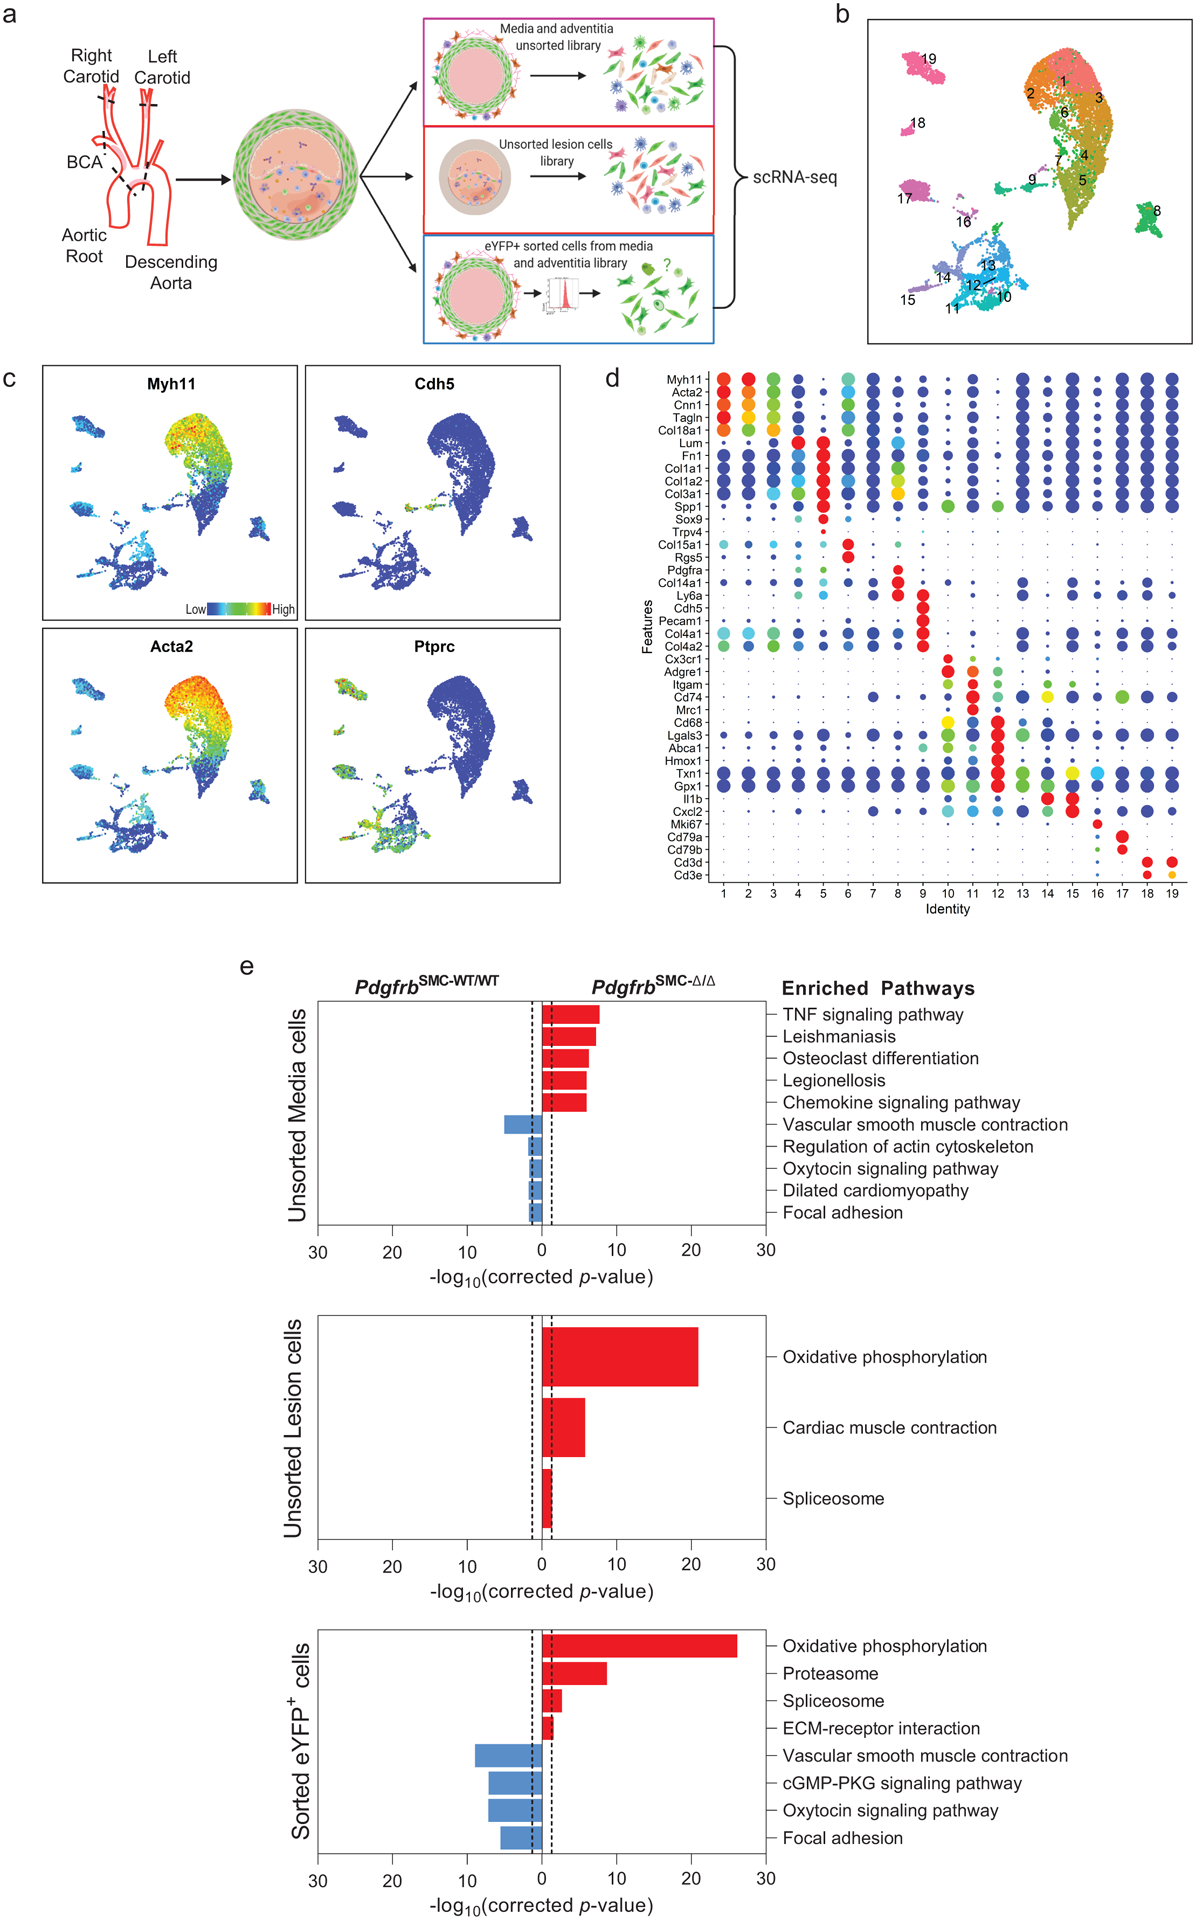
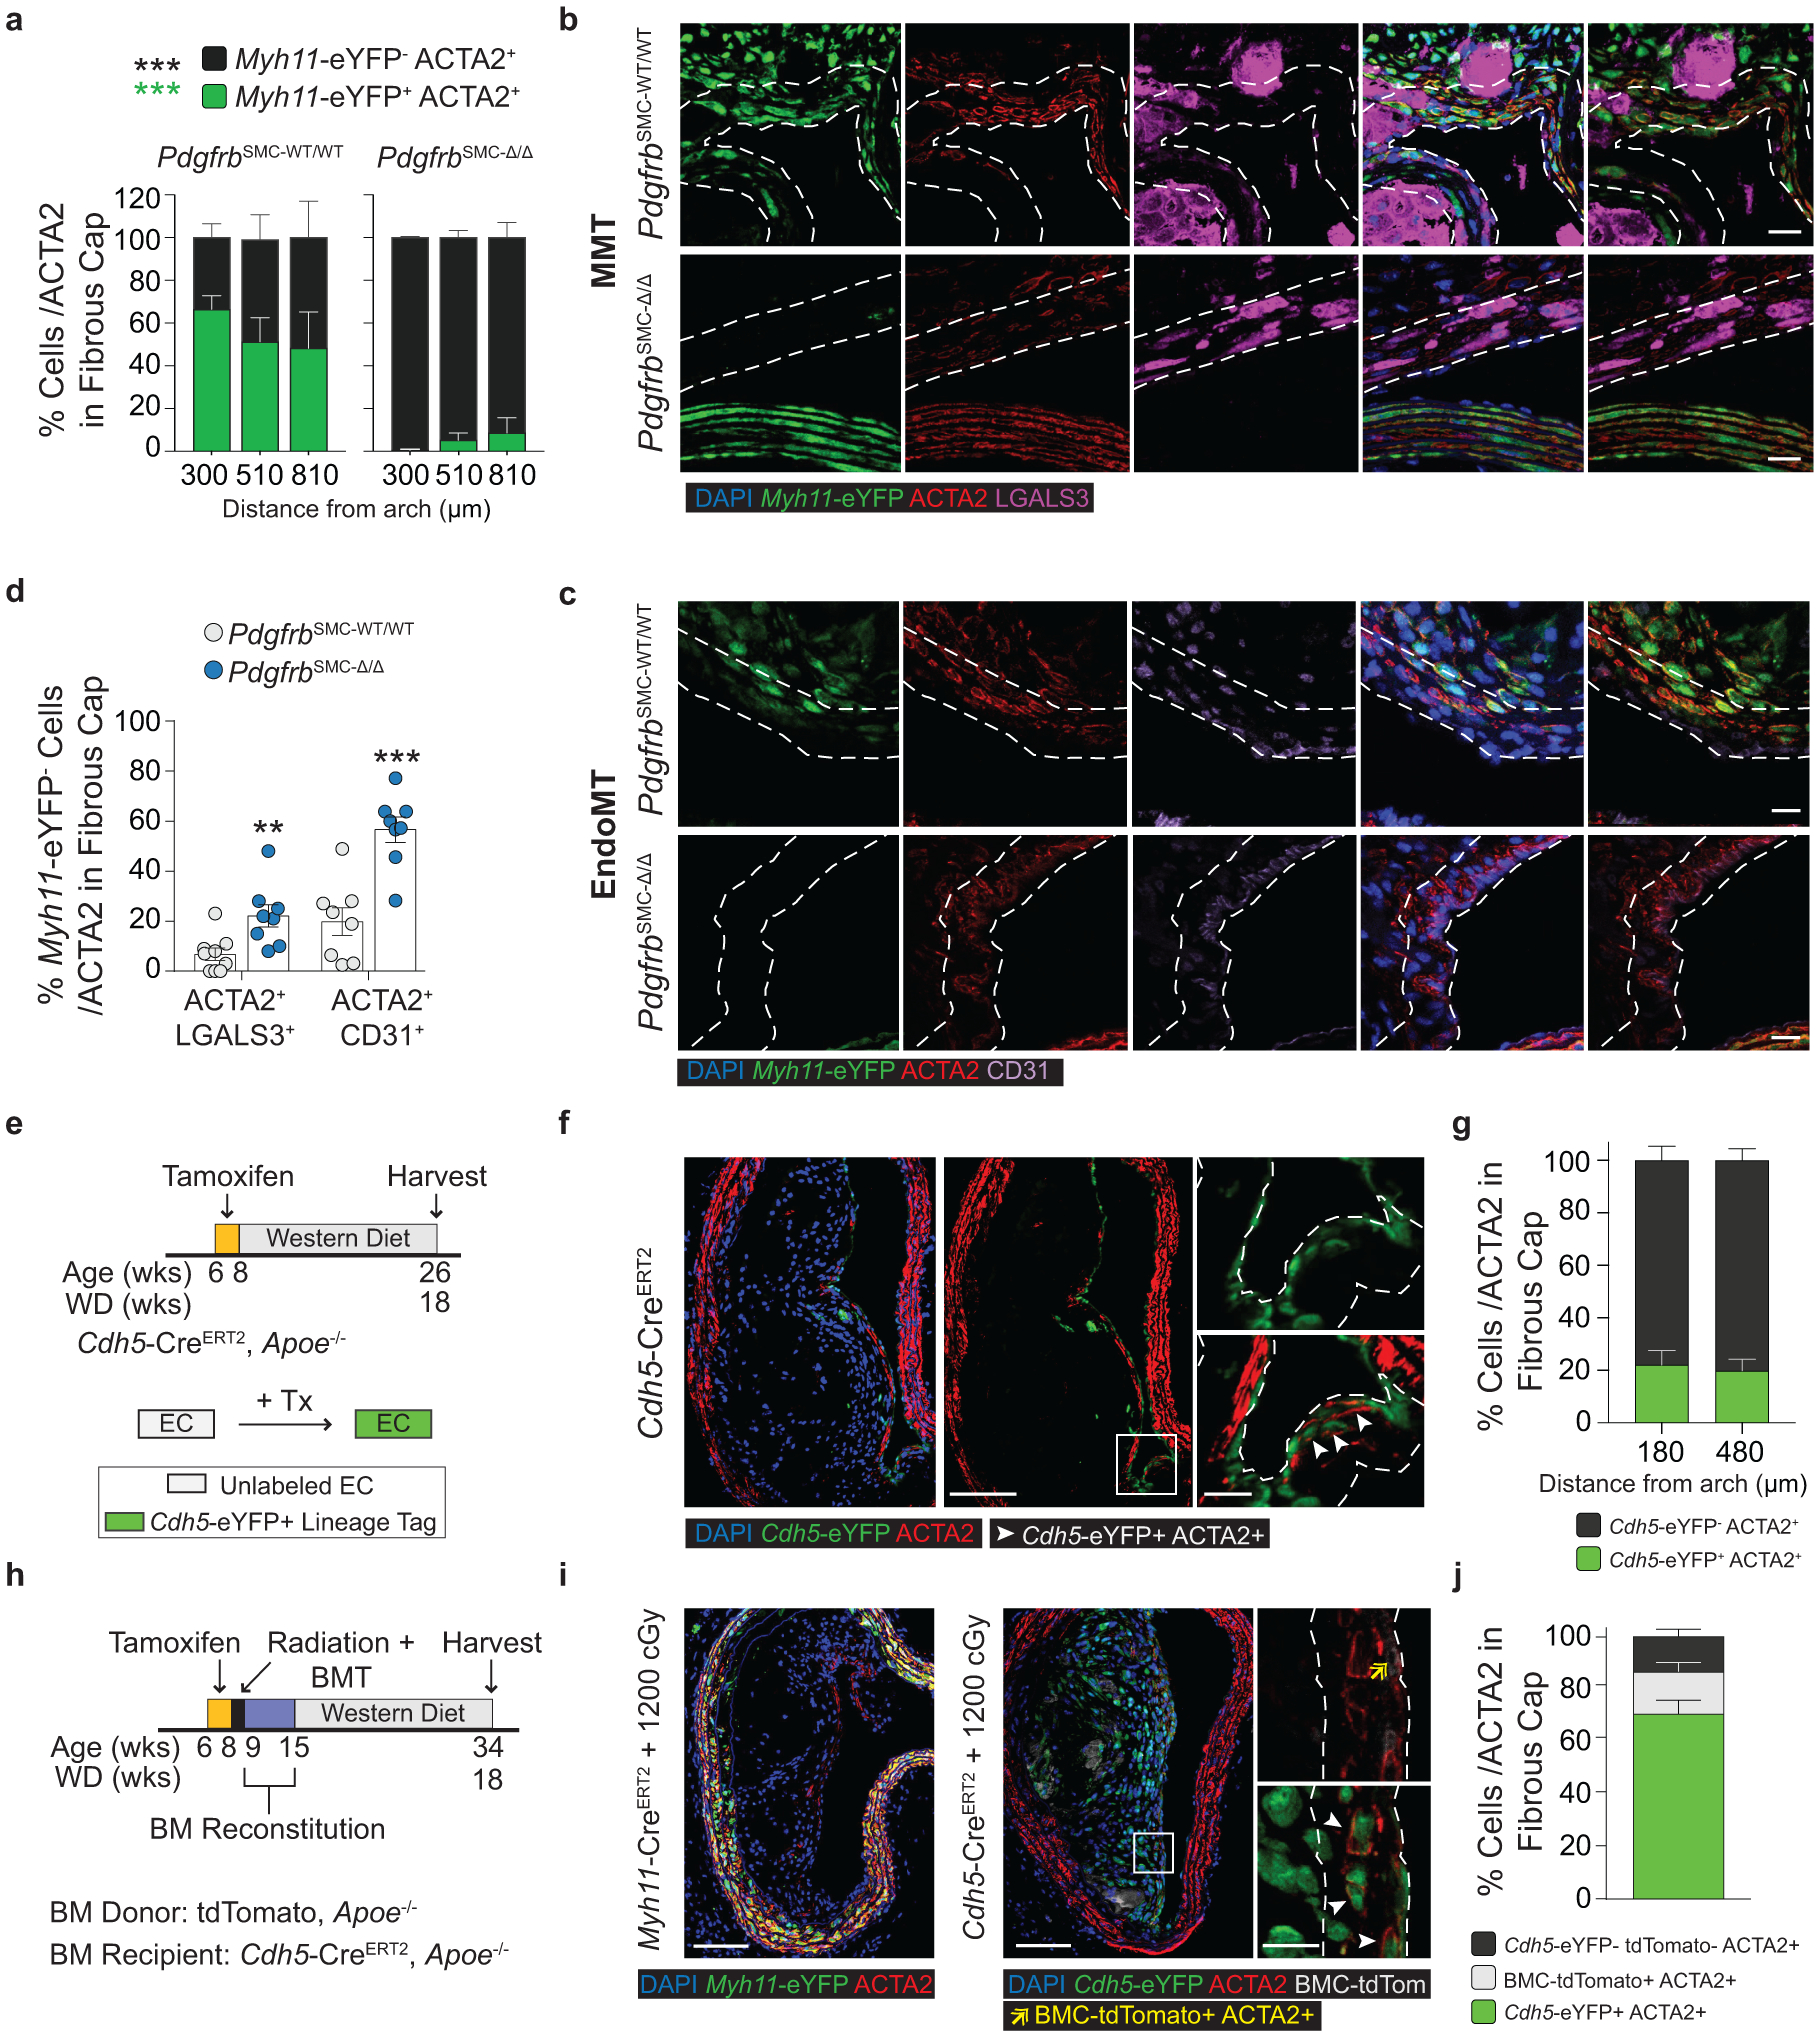
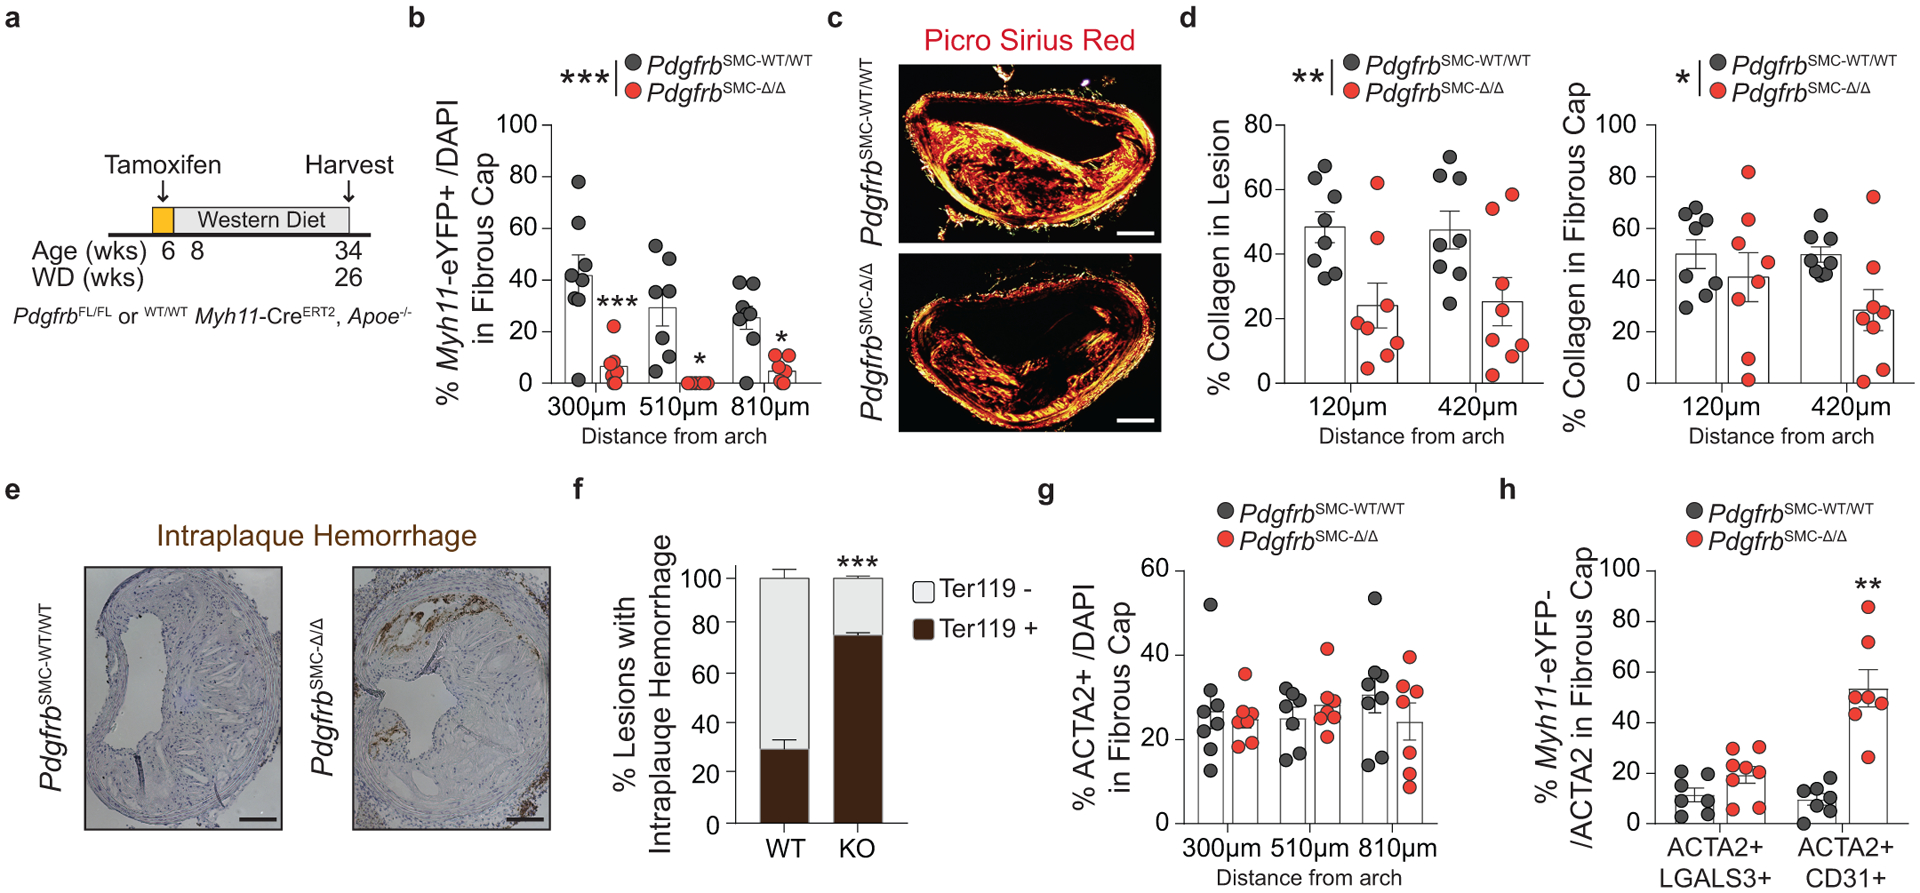
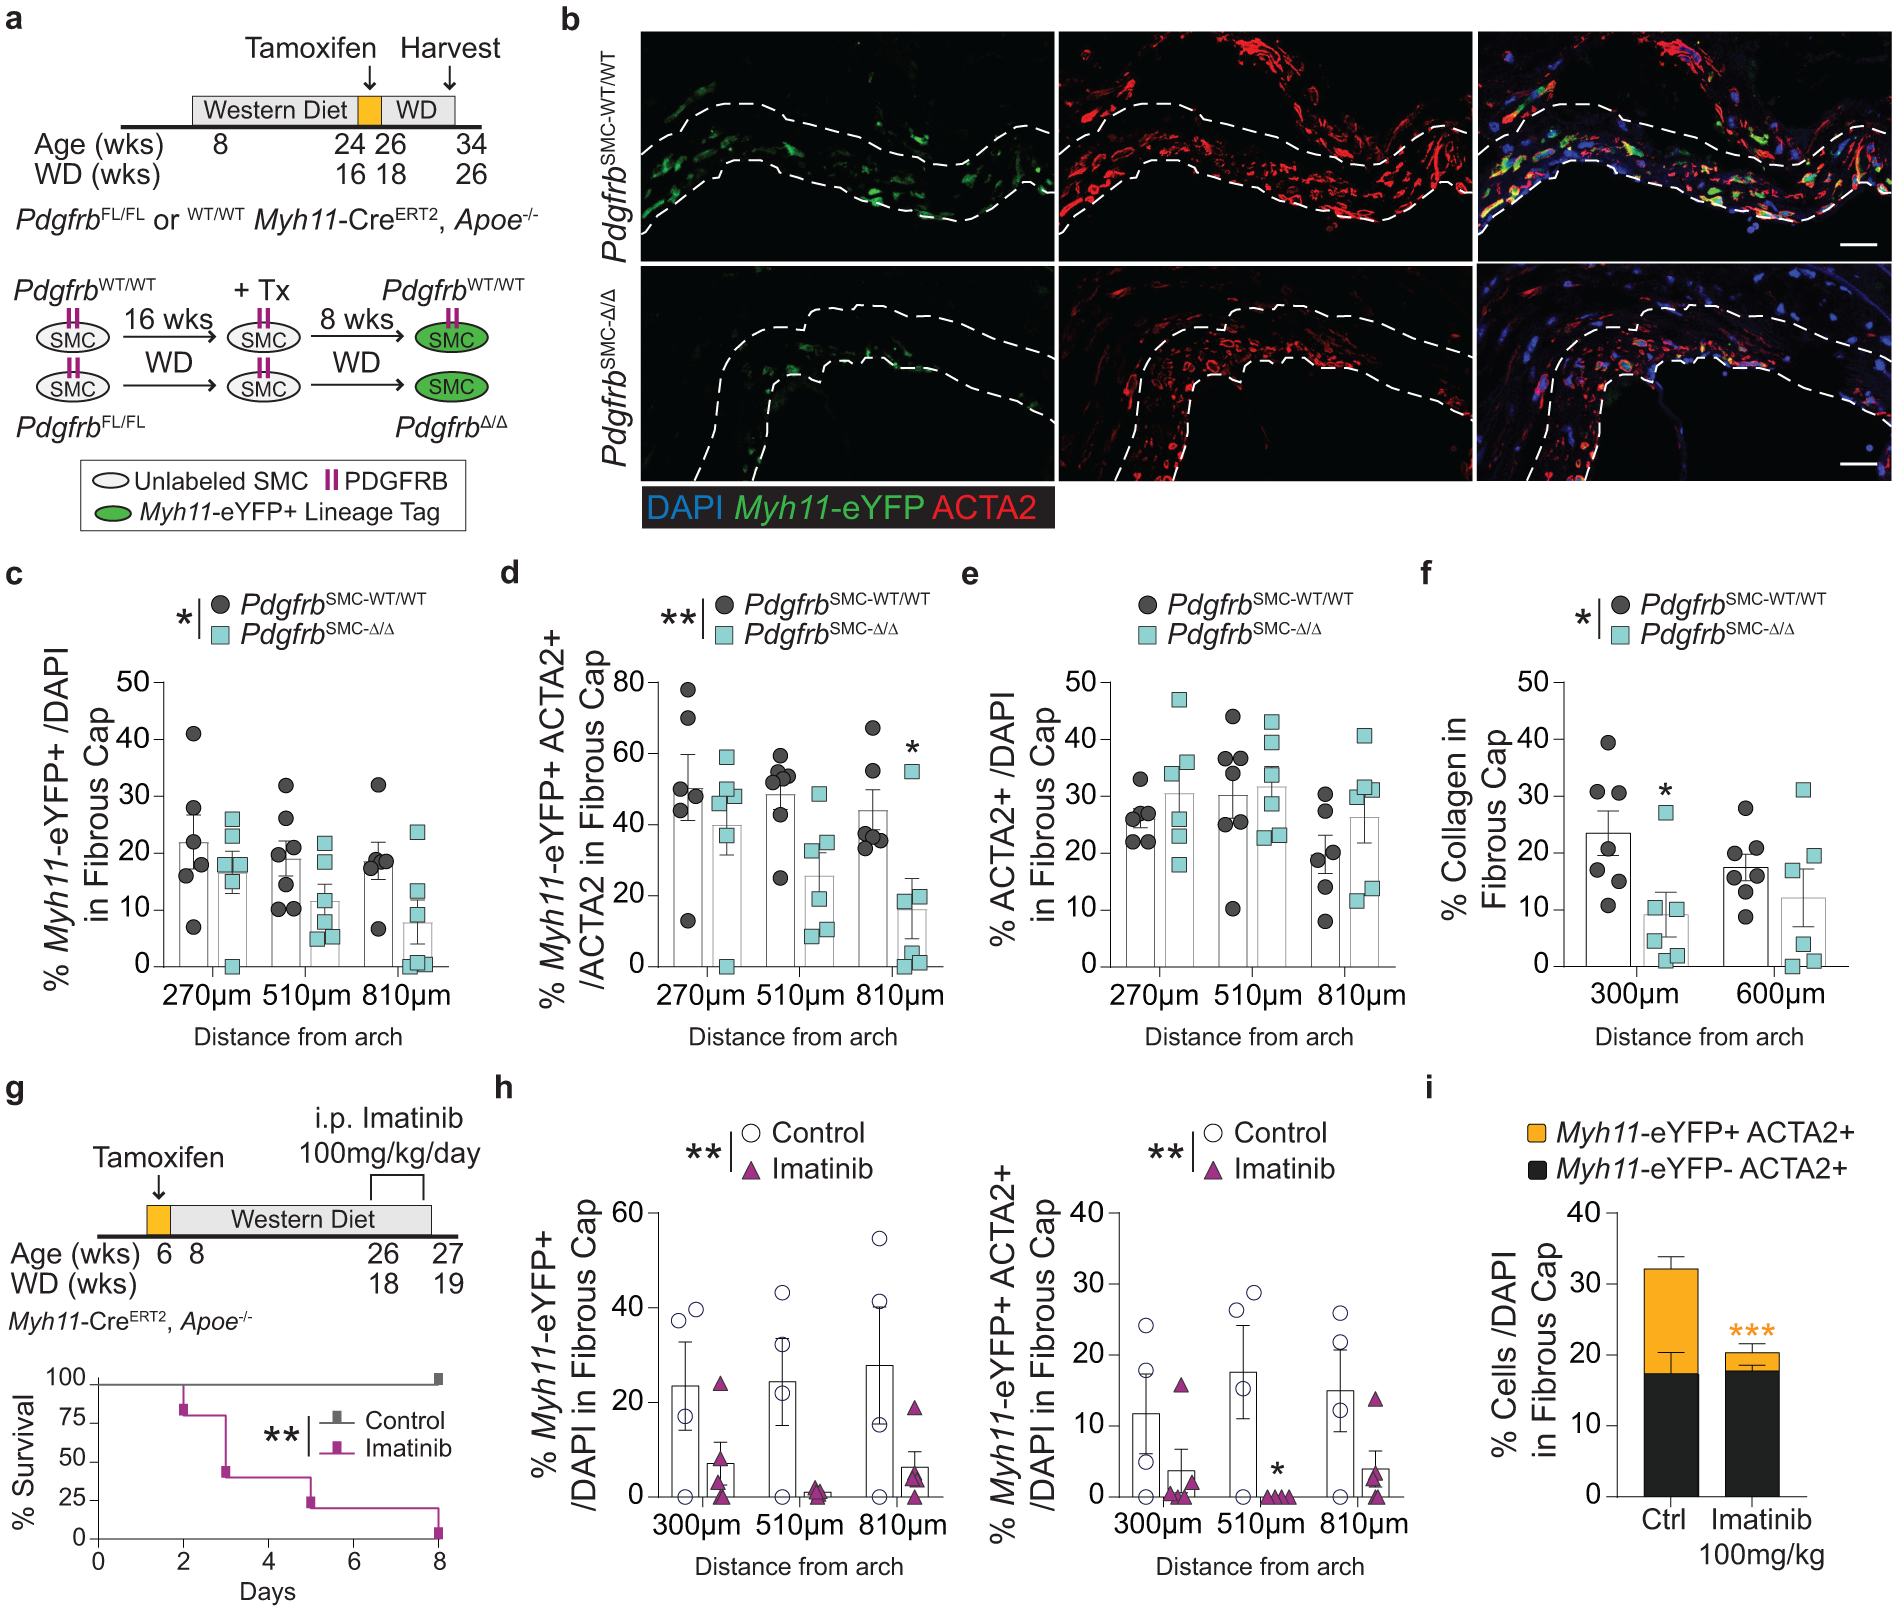
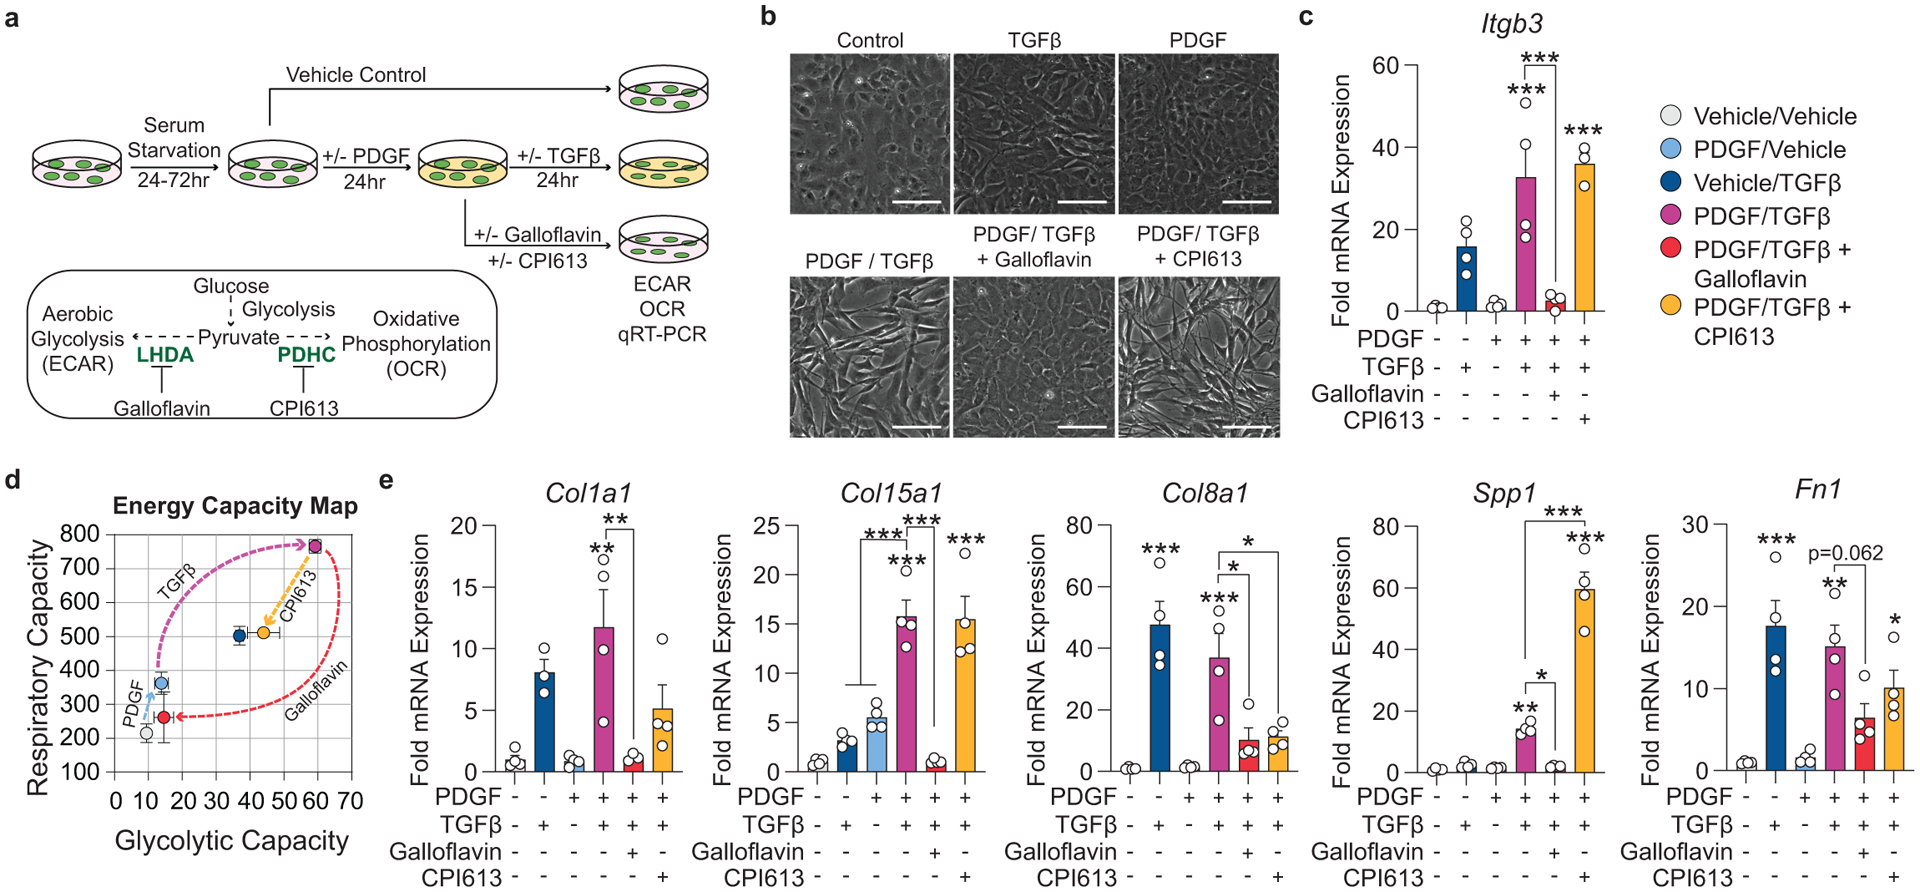
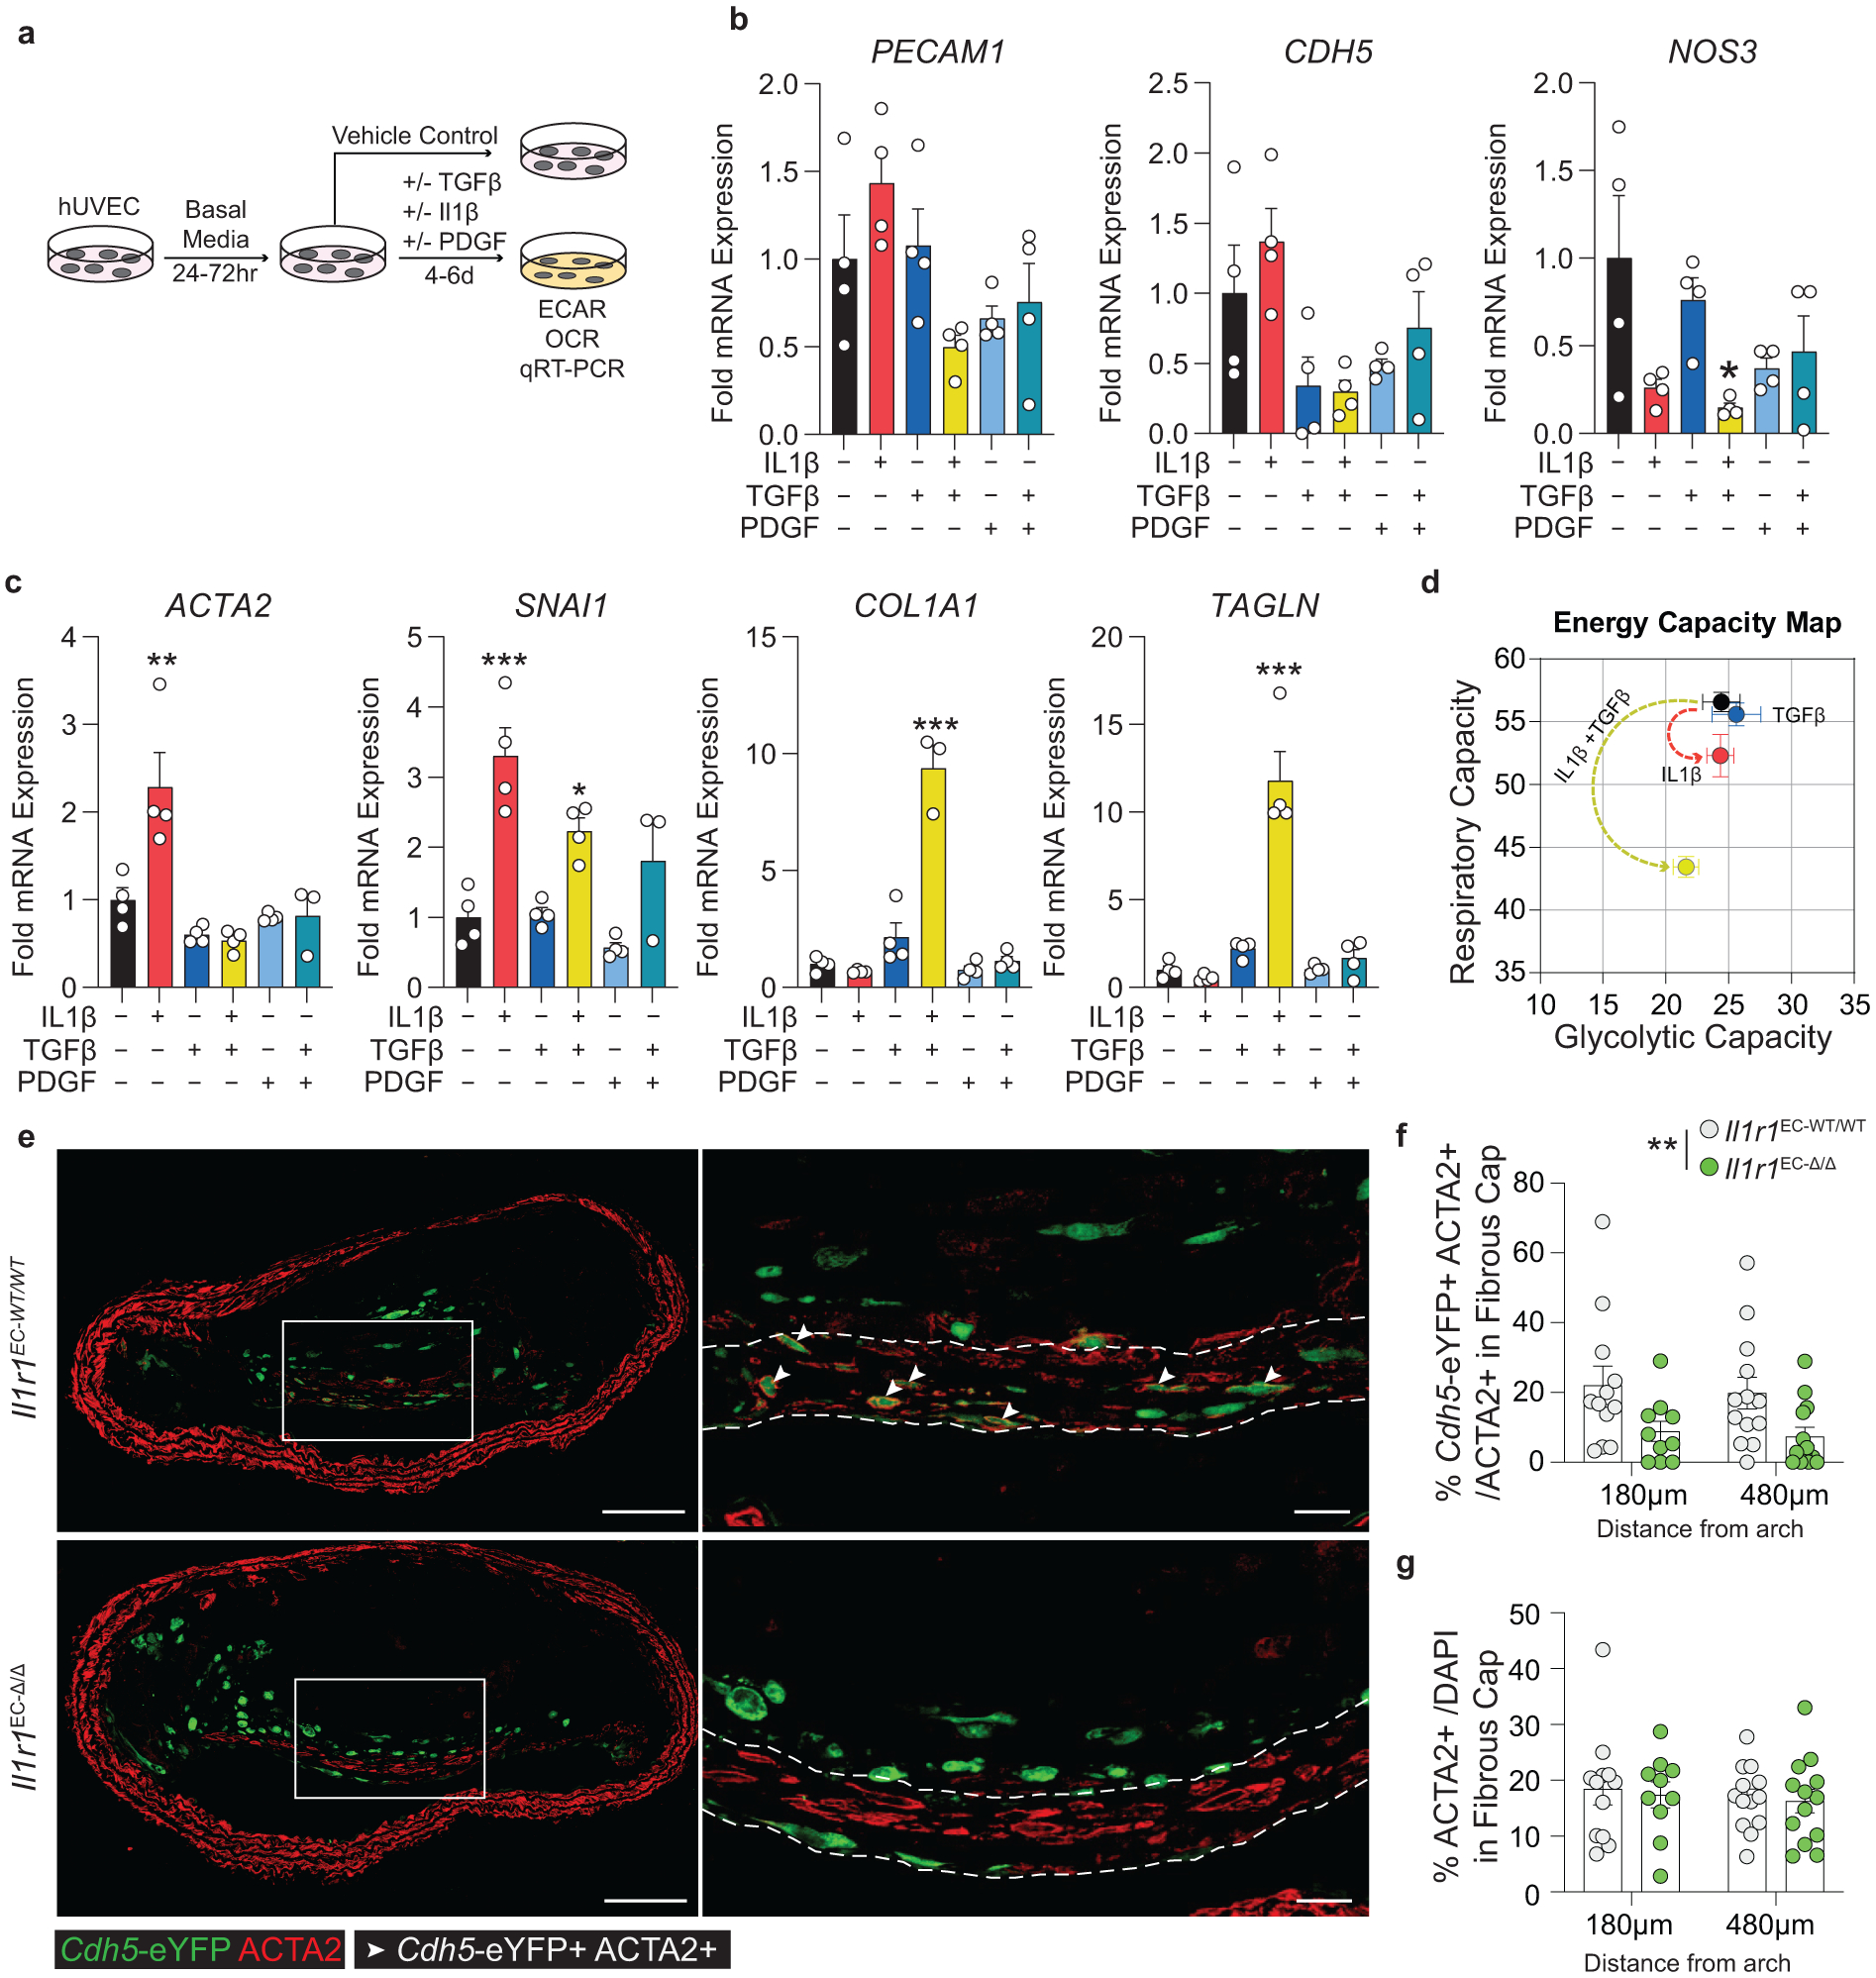
Stable atherosclerotic plaques are characterized by a thick, extracellular matrix-rich fibrous cap populated by protective ACTA2+ myofibroblast (MF)-like cells, assumed to be almost exclusively derived from smooth muscle cells (SMCs). Herein, we show that in murine and human lesions, 20% to 40% of ACTA2+ fibrous cap cells, respectively, are derived from non-SMC sources, including endothelial cells (ECs) or macrophages that have undergone an endothelial-to-mesenchymal transition (EndoMT) or a macrophage-to-mesenchymal transition (MMT). In addition, we show that SMC-specific knockout of the Pdgfrb gene, which encodes platelet-derived growth factor receptor beta (PDGFRβ), in Apoe-/- mice fed a Western diet for 18 weeks resulted in brachiocephalic artery lesions nearly devoid of SMCs but with no changes in lesion size, remodelling or indices of stability, including the percentage of ACTA2+ fibrous cap cells. However, prolonged Western diet feeding of SMC Pdgfrb-knockout mice resulted in reduced indices of stability, indicating that EndoMT- and MMT-derived MFs cannot compensate indefinitely for loss of SMC-derived MFs. Using single-cell and bulk RNA-sequencing analyses of the brachiocephalic artery region and in vitro models, we provide evidence that SMC-to-MF transitions are induced by PDGF and transforming growth factor-β and dependent on aerobic glycolysis, while EndoMT is induced by interleukin-1β and transforming growth factor-β. Together, we provide evidence that the ACTA2+ fibrous cap originates from a tapestry of cell types, which transition to an MF-like state through distinct signalling pathways that are either dependent on or associated with extensive metabolic reprogramming.


Conflict of interest statement

Competing Interest Statement:

AF declares one competing interest with Amgen Inc. All other authors declare no competing interests.

Figures

Extended Data Fig. 1.
Extended Data Fig. 1.. Generation and validation of SMC-specific conditional PDGFRB deletion in SMC lineage-tracing mice.
(A) Myh11-CreERT2/ROSA-STOPFL/FL/eYFP; Apoe−/− (Myh11-CreERT2) mice were crossed with a PdgfrbFL/FL mouse to generate PdgfrbSMC-FL/FL and −WT/WT animals. Heterozygote animals were bred (PdgfrbFL/WT; Myh11-CreERT2/ROSA STOPFL/FL/eYFP; Apoe−/−) to generate littermate FL/FL and WT/WT controls, which were used in all experiments. (B) Analyses were conducted on the BCA, at multiple locations past the aortic arch in order to assess patterns across the entire region, or within the aortic root. (C) Quantification of IF staining at 18 weeks of WD in the media of BCA lesions showed efficient KO of PDGFRB in >94% of SMC. ***p-value = 0.0006. (D) PDGFRB KO in SMC is not associated with decreases in the total number of DAPI+ or Myh11-eYFP+ cells (SMC) in the media, but there was a significant reduction in the total number of PDGFRB+ cells and Myh11-eYFP+ PDGFRB+ cells. ***p-values = 0.0006. (E) Validation of genetic deletion of Pdgfrb gene was confirmed for each experimental mouse. (F) Representative images showing PDGFRB loss within the SMC-rich media in PdgfrbSMC-Δ/Δ mice. Scale bar: 20μm. Graphs were analyzed using two-tailed Mann-Whitney U test, biologically independent animals are indicated as individual dots in (C, D), error bars represent mean ± SEM.
Extended Data Fig. 2
Extended Data Fig. 2. SMC investment is significantly impaired in the aortic root of PdgfrbSMC-Δ/Δ mice and SMC-PDGFRB KO did not show reduced dedifferentiation, proliferation, or apoptosis of medial SMC following 18 weeks of WD.
(A) Representative images of aortic root lesions from PdgfrbSMC-WT/WT and (B) PdgfrbSMC-Δ/Δ mice. (C) Quantification of Myh11-eYFP+ cells content in the fibrous caps of aortic root lesions from PdgfrbSMC-WT/WT and PdgfrbSMC-Δ/Δ mice, demonstrated a significant reduction in SMC-derived cells in aortic root lesions. ***p-value = 0.0002. (D) Representative image of the media from the BCA of PdgfrbSMC-WT/WT and PdgfrbSMC-Δ/Δ mice show ACTA2 downregulation in the innermost layer of the media. (E) Quantification of Myh11-eYFP+ACTA2+ cells in the media. (F) Representative image of Ki67 staining in Myh11-eYFP+ SMC in the media. (G) Quantification of Ki67 expression in the media, representing proliferation. Ki67+: **p-value = 0.0017, Myh11-eYFP+ Ki67+ *p-value = 0.0130, Myh11-eYFP Ki67+ *p-value = 0.0337. (H) Representative image of cleaved caspase 3 staining in Myh11-eYFP+ SMC in the media. Myh11-eYFP Casp3+ p-value = 0.0476. (I) Quantification of Casp3 expression in the media, representing apoptosis. *p-value = 0.0476. A: Adventitia, M: Media, L: Lesion. Scale bar: 100μm (whole lesion) or 20μm (zoom). Graphs were analyzed using Graphs were analyzed using two-way ANOVA with Sidak correction and multiple comparisons or two-tailed Mann-Whitney U test, biologically independent animals are indicated as individual dots in (C, H, I), n = 8 (WT and KO) in (G), error bars represent mean ± SEM.
Extended Data Fig. 3
Extended Data Fig. 3. PdgfrbSMC-Δ/Δ did not result in differences in BCA lesion size or remodeling indices after 18 weeks of WD and ACTA2+ cells co-localize with LGALS3 or CD31 in lesions lacking SMC investment.
(A) MOVAT representation of PdgfrbSMC-WT/WT and PdgfrbSMC-Δ/Δ mice after 18 weeks of WD. (B) Lesion, (C) External elastic lamina (EEL), (D) or lumen area were not significantly changed at three locations. (E) Necrotic core area was also unchanged. ACTA2 staining co-localizes with LGALS3 (F) or CD31 (G) in the fibrous cap of PdgfrbSMC-Δ/Δ mice. In PdgfrbSMC-WT/WT mice, ACTA2+ eYFP+ cells co-stain with LGALS3 (white) or CD31 (yellow). Scale bar: 100μm (A) and 20μm (F, G). X-axis values represent distance past the aortic arch. Graphs were analyzed using two-way ANOVA with Sidak correction and multiple comparisons, biologically independent animals are indicated as individual dots in (B, C, D, E), error bars represent mean ± SEM.
Extended Data Fig. 4
Extended Data Fig. 4. UMAP presentation of scRNA-seq data showing gene expression of the eYFP transgene, Pdgfrb, and Col15a1 in PdgfrbSMC-WT/WT and PdgfrbSMC-Δ/Δ mice.
A)UMAP representations of each scRNA-seq library from cells isolated from BCAs from PdgfrbSMC-WT/WT and PdgfrbSMC-Δ/Δ mice fed 18 weeks of WD. (B) Percentage of cells in each cluster from each respective group described in A, unsorted media and underlying adventitia cells (left), unsorted lesion cells (middle), and eYFP+ sorted cells from media and underlying adventitia cells (right). (C-H) UMAP representations of expression levels of target genes from scRNA-seq analysis of cells isolated from BCAs of mice fed 18 weeks of WD (top). Violin plots showing expression of each target gene by cluster (bottom). (C) Demonstrates presence of eYFP transgene, identifying the SMC-derived cell populations. (D) Demonstrates loss of Pdgfrb gene expression in PdgfrbSMC-Δ/Δ mice only in SMC-derived cells. (E) Col15a1 gene expression is highly enriched and specific for cluster 6, which is reduced in the PdgfrbSMC-Δ/Δ mice. (F-H) Osteochondrogenic genes represented in SMC clusters.
Extended Data Fig. 5
Extended Data Fig. 5. Analysis of BCA lesions from gain of function mutant (m) PCSK9-AAV8 and Ldlr−/− models of murine atherosclerosis.
(A) Schematic of experimental design for experiments using Myh11-CreERT2/ROSA-STOPFL/FL-eYFP mice infected once with mPCSK9-AAV8 (Myh11-CreERT2 mPCSK9). Representative images depicting (B) EndoMT (eYFP ACTA2+ CD31+ /ACTA2+) and (C) MMT (eYFP ACTA2+ LGALS3+ /ACTA2+). (D) Quantification of Myh11-eYFP+ cells in the 30μm fibrous cap area. (E) Quantification of the percentage of ACTA2+ cells derived from SMC (Myh11-eYFP+ ACTA2+) and from non-SMC sources (Myh11-eYFPACTA2+) in Myh11-CreERT2 mPCSK9 mice. (F) Quantification of MMT and EndoMT from (B & C). (G) Schematic of Ldlr−/− Myh11-CreERT2/ROSA-STOPFL/FL-eYFP (Myh11-CreERT2 Ldlr−/−) experimental design. Representative images depicting (H) EndoMT (Myh11-eYFP ACTA2+ CD31+ /ACTA2+) and (I) MMT (Myh11-eYFP ACTA2+ LGALS3+ /ACTA2+). (J) Quantification of Myh11-eYFP+ cells in the 30μm fibrous cap area. (K) Quantification of the percentage of ACTA2+ cells derived from SMC (Myh11-eYFP+ ACTA2+) and from non-SMC sources (Myh11-eYFP ACTA2+) in Myh11-CreERT2 Ldlr−/− mice. (L) Quantification of MMT and EndoMT from (H) & (I). Scale bar: 100μm (B, C, H, I top) or 20μm (B, C, H, I bottom). Biologically independent animals are indicated as individual dots in (D, F, J, L), (E) n = 7, 6 (WT and KO: 330, 480μm), (K) n=5 (WT and KO), error bars represent mean ± SEM.
Extended Data Fig. 6
Extended Data Fig. 6. Generation and validation of EC-lineage tracing mice and EC-specific deletion of Il1r1.
(A) Cdh5-CreERT2/ROSA-STOPFL/FL-eYFP/Apoe−/− (Cdh5-CreERT2) mice were generated to lineage trace EC and their progeny within the BCA. Mice were then crossed to an Il1r1-Flox mouse to generate Il1r1EC-fl/fl and -WT/WT animals. Heterozygote animals were bred (Il1r1Fl/WT; Cdh5-CreERT2/ROSA-STOPFL/FL-eYFP/Apoe−/−) to generate littermate FL/FL and WT/WT controls, which were used in all experiments. (B) Image denoting the endothelial monolayer with Cdh5-eYFP+ staining only in this layer. (C) Validation of genetic deletion of Il1r1 in organs using isolated DNA. Lanes A, C, E contain the FL and WT genotyping reactions while lanes B, D, F contain the excision reaction. Representative images of Cdh5-eYFP+ staining in (D) Liver, (E) Lung, and (F) Aorta. (G) Gating strategy for isolation of Cdh5-eYFP+ endothelial cells. (H) Genotyping and recombination analysis of Cdh5-eYFP+ cells sorted from Il1r1EC-WT/WT (lanes A, B) and Il1r1EC-FL/FL (lanes C, D) mice. Lanes A, C contain FL and WT genotyping reaction while B, D contain the excision reaction. Scale bar: 100μm (D, E, F).
Extended Data Fig. 7
Extended Data Fig. 7. Lethal radiation and BMT significantly increases the percentage of EC in the lesion and fibrous cap.
((A) Representative images of BCA lesions in Cdh5-CreERT2 mice fed 18 weeks of WD with or without 1200cGy of radiation, which is known to ablate SMC accumulation within the lesion and fibrous cap. (B) Quantification of Cdh5-eYFP+ cells in the fibrous cap showed significantly increased EC-derived cells after radiation. ***p-values < 0.0001. (C) The increased percentage of EC-derived cells within the fibrous cap was not associated with changes in overall ACTA2+ cells within the fibrous cap. (D) Zoom in of highlighted area in (A) showing EC-derived cells express ACTA2. Single cell breakdown and quantification of Cdh5-eYFP+ ACTA2+ cells per total Cdh5-eYFP+ (E) or per total ACTA2+ cells, **p-value = 0.0023, (F) within the fibrous cap, ***p-values < 0.0001. (G) Representative image of bone marrow cells (BMC) expressing ACTA2 within the fibrous cap of Cdh5-CreERT2 mice after radiation. (H) Quantification and comparison of MMT by co-incident staining of ACTA2 and marker protein staining for LGALS3 or for the BMC lineage tag, tdTomato. Scale bar: 100μm (whole lesion) or 50μm (zoom). Graphs were analyzed using two-tailed Mann-Whitney U test, error bars represent mean ± SEM.
Extended Data Fig. 8
Extended Data Fig. 8. A subset of ACTA2+ cells in human coronary lesions are derived from a non-SMC source.
Representative images of stable human lesions of (A) ISH-PLA staining or (B) CD31 staining, showing the fibrous cap outlined using serially stained H&E and MOVAT slides. (C) Analysis following ISH-PLA, where PLA dots correspond to cells with H3K4me2 on the MYH11 promoter. (D) Graph representing the portion of ACTA2+ cells that are SMC (ACTA2+ PLA+) or non-SMC derived in human lesions (ACTA2+ PLA). (E) Analysis of the percent of ACTA2+ cells that are CD31+ within the fibrous cap of human coronary lesions. (F) Graph representing a portion of ACTA2+ cells that co-stain with CD31 within the fibrous cap. Data were obtained by assessing co-localization of DAPI, ACTA2, and PLA or DAPI, ACTA2, and CD31 (see Methods). (G) Total calculated efficiency of ISH-PLA positivity (ACTA2+ ISHPLA+) calculated based on total # of ACTA2+ cells within media, with the assumption that 100% of ACTA2+ cells in the media will be PLA+. Each Sample ID is a distinct patient and this total efficiency includes error introduced by the semi-automated quantification pipeline, calculated separately in (H-J). Comparison of single-cell counting by manual human input and the semi-automated pipeline of DAPI (H), PLA+ (I), and PLA+ ACTA2+ /ACTA2+ (J) using 6 distinct subsections of human coronary artery vessels, that were chosen to keep the manual counter blinded. Statistical analysis of Manual versus semi-auto detection comparison was performed with paired two-tailed t-tests. Individual patients are indicated as individual dots in (D, F-J). Scale bar: 1000μm (A, B) or 100μm (C, E). Graphs shown as mean ± SEM.
Extended Data Fig. 9
Extended Data Fig. 9. Bioenergetic and transcriptional changes of SMC in response to PDGF and inhibitors of pyruvate metabolism.
Murine SMC were serum starved for 24–72 hours and then treated with Vehicle, PDGF-BB or -DD (50ng/mL), and/or Galloflavin (10μM or 50μM) or CPI613 (20μM). (A) Glycolytic stress test (GST) measuring extracellular acidification rate (ECAR) of treated SMC, representing glycolytic ability. (B) ECAR was measured initially in the absence of glucose, after injection of 20mM D-glucose (basal glycolysis), 1μM oligomycin (glycolytic capacity), and 80mM 2-deoxy-D-glucose (non-glycolytic; used for normalization). Glycolytic reserve was determined by subtracting post-glucose ECAR from post-oligomycin ECAR. [Aerobic glycolysis p = 0.0206; Glycolytic capacity p = 0.0441 and p = 0.0234]. (C) Mitochondrial stress test (MST) measuring the oxygen consumption rate (OCR) of cells, representing mitochondrial respiratory ability. (D) OCR was measured initially (basal respiration), and after injection of 1μM oligomycin, 2μM BAM15 (respiratory capacity), and 10μM antimycin A & 1μM rotenone (non-mitochondrial; used for normalization). Spare respiratory capacity was determined by subtracting the initial OCR from the post-BAM15 OCR. [Respiratory capacity p = 0.0013 and p = 0.0248; Spare respiratory capacity p = 0.0007 and p = 0.0165]. (E) Energy capacity map representing the bioenergetic potential of SMC (x-axis, maximal ECAR; y-axis, maximal OCR). (F) mRNA expression of Col15a1, measured by qPCR in SMC treated for 24 hours. [Vehicle p < 0.0001, PDGF-BB p < 0.0001, PDGF-DD p = 0.0004, and Galloflavin 10μM p = 0.0007]. (G) mRNA expression of Col15a1, Mmp3, and Acta2, measured by qPCR in SMC treated with Vehicle, PDGF-BB, and/or Galloflavin 10μM for 24 hours [Col15a1 p <0.0001, p = 0.003, and p = 0.0457; Mmp3 p = 0.0354 and p = 0.0437; Acta2 p = 0.0685 and p = 0.0192]. (H) Energy capacity map representing the bioenergetic potential of SMC treated with Vehicle, PDGF-BB, and/or CPI613 for 24 hours. (I) mRNA expression of Col15a1, and Mmp3, measured by qPCR. [Col15a1 p = 0.0226 and p = 0.0007; Mmp3 p = 0.0002 and p < 0.0001]. Graphs were analyzed using one-way ANOVA with Tukey’s correction for post-hoc analysis, error bars represent mean ± SEM.
Extended Data Fig. 10
Extended Data Fig. 10. Cultured SMC stimulated to myofibroblast-like state with PDGF and TGFβ, require aerobic glycolysis to maintain myofibroblast-associated gene expression.
A) Murine aortic SMC were serum starved for 24–72 hours. After serum starvation, SMCs were treated with vehicle control or PDGF-DD (10ng/mL) and TGFβ1 (10ng/mL), Galloflavin (10μM), and/or CPI613 (20μM) for 24 hours. Next, cells were treated a second time, with PDGF-DD (10ng/mL) and TGFβ1 (10ng/mL), this time in combination with Galloflavin (10μM) or CPI613 (20μM) for another 24 hours. (B) Pyruvate metabolism pathway map, highlighting lactate dehydrogenase (LDH) as the target of Galloflavin and pyruvate dehydrogenase (PDH) as the target of CPI613. (C) Mitochondrial stress test (MST) measuring the oxygen consumption rate (OCR). OCR was measured initially (basal respiration), and after injection of 1μM oligomycin, 2μM BAM15 (respiratory capacity), and 10μM antimycin A & 1μM rotenone (non-mitochondrial; used for normalization). Spare respiratory capacity was determined by subtracting the initial OCR from the post-BAM15 OCR. [Basal respiration p = 0.0003, p = 0.009, and p = 0.0026; Respiratory Capacity p < 0.0001, p < 0.0001, and p = 0.0008] (D) Glycolytic stress test (GST) measuring extracellular acidification rate (ECAR). ECAR was measured initially in the absence of glucose, after injection of 20mM D-glucose (basal glycolysis), 1μM oligomycin (glycolytic capacity), and 80mM 2-deoxy-D-glucose (non-glycolytic; used for normalization). [Glycolysis p < 0.0001, p = 0.0002, and p < 0.0001; Glycolytic Capacity p = 0.0006, p = 0.0052, and p = 0.0006]. (E) Energy capacity map representing the bioenergetic potential of SMC (x-axis, maximal ECAR; y-axis, maximal OCR). (F) mRNA expression of ECM and ECM-interacting genes as measured by qPCR. [Col1a1 p = 0.0009, p = 0.0310, p = 0.0647; Col15a1 p = 0.0049 and p = 0.0003; Acta2 p = 0.0009 and p = 0.0003; Spp1 p = 0.0004, p = 0.0008, and p = 0.0006]. Graphs were analyzed using one-way ANOVA with Tukey’s correction for post-hoc analysis with n≥ 3, error bars represent mean ± SEM.
Figure 1:
Figure 1:. SMC-PDGFRB KO resulted in a dramatic reduction in SMC investment but no effect on indices of stability in BCA lesions including the number of ACTA2+ cells in the fibrous cap following 18 weeks of WD feeding.
(A) BCA lesions of PDGFRB WT and KO littermate mice fed WD for 18 weeks were harvested and analyzed for SMC content. (B top) PdgfrbSMC-WT/WT mice exhibited robust SMC accumulation within the lesion and fibrous cap, outlined by dashed lines. (B bottom) PdgfrbSMC-Δ/Δ mice showed greatly reduced numbers of SMC within the lesion and fibrous cap. (C) Quantification of single cell counting of eYFP/DAPI within the lesion and fibrous cap at three locations. ***p-values < 0.0001. (D) Representative images of PicroSirius Red staining representing collagen deposition. (E) No significant changes were observed for collagen deposition within the lesion and fibrous cap. (F) Representative images of Ter119 staining for intraplaque hemorrhage. (G) There were no significant differences in Ter119 staining at three locations past the aortic arch. (H) Despite loss of SMC, the total percentage of ACTA2+ cells was unchanged in the fibrous cap. (I) Schematic for RNA-seq analysis on the entire carotid, BCA, aortic arch region showing the top upregulated pathways in the PdgfrbSMC-Δ/Δ vs. PdgfrbSMC-WT/WT mice. Scale bar: 100μm (B, D, F) or 20μm (B zoom). X-axis values represent distance past the aortic arch. Graphs were analyzed using two-way ANOVA with Sidak correction and multiple comparisons (C, E, G, H), biologically independent animals are indicated as individual dots (C, E, H), intraplaque hemorrhage was analyzed as either positive or negative staining and n = 12, 13, 11 (WT: 240, 540, 840 μm) or n = 10, 12, 9 (KO) (G), error bars represent mean ± SEM, p-values displayed refer to two-way ANOVA between genotype unless otherwise indicated.
Figure 2:
Figure 2:. scRNA-seq analysis of advanced BCA lesions in PdgfrbSMC-WT/WT and PdgfrbSMC-Δ/Δ identified 19 distinct cell clusters, including a primarily SMC-derived ECM cluster that is Pdgfrb-dependent.
A) Schematic of experimental design showing that cells were harvested for scRNA-seq from micro dissected advanced BCA lesions from PdgfrbSMC-WT/WT and PdgfrbSMC-Δ/Δ mice fed 18 weeks of WD. Three libraries were generated per genotype: 1. unsorted medial and underlying adventitial cells (top right); 2. unsorted lesion cells (middle right); and 3. Myh11-eYFP+ sorted cells from the medial and underlying adventitial cells (lower right). These data are the results of 6 Chromium 10X libraries made from 7 mice. (B) UMAP results shows 19 different clusters and (C) UMAP analysis shows cells from PdgfrbSMC-WT/WT (right) and from PdgfrbSMC-Δ/Δ (left), colored by origin/library. (D) Dot plot showing gene expression of traditional markers used for cell identity, as well as markers related to unique clusters. Clusters 1–3 correspond to mature SMC with the expression of Myh11+, Acta2+, Cnn1+. Cluster 4 appears to be a transition state with low expression of traditional markers and with cells activating Ly6a. Cluster 5 is an ECM/osteo-chondrocyte-like phenotype. Cluster 6 has lowered but still present expression of SMC markers including Myh11+ and Acta2+, but high expression of Col15a1. Cluster 7 appears as an intermediate SMC-associated. Cluster 8 has high levels of Ly6a and ECM genes, likely representing a fibroblast population. Cluster 9 is characterized by endothelial markers. Clusters 10–15 are different macrophage cell types. Cluster 16 is composed of cells that are in the process of replicating, indicated by Mki67 expression. Cluster 17 represents B cells. Clusters 18 and 19 represent T-cells. (E) Pathway analysis shows the top up-regulated (red) and down-regulated (blue) pathways in PdgfrbSMC-Δ/Δ compared to PdgfrbSMC-WT/WT in (top) Unsorted media and adventitia cells, (middle) Unsorted lesion cells, and (bottom) Sorted media and adventitia cells. Importantly, Oxidative Phosphorylation is notably upregulated in the PdgfrbSMC-Δ/Δ mice consistent with our observations in the bulk RNA-seq.
Figure 3:
Figure 3:. EndoMT and MMT are markedly upregulated in lesions lacking SMC investment.
Loss of Pdgfrb signaling significantly increased the proportion of non-SMC derived ACTA2+ fibrous cap following 18 weeks of WD feeding. ***p-value < 0.0001.(A) SMC account for only about 60% of the ACTA2+ fibrous cap cells in PdgfrbSMC-WT/WT mice. Representative images of MMT (B) and EndoMT. (C). (D) Marker protein staining and single-cell counting indicates that up to 40% of ACTA2+ cells were derived from EndoMT, ***p-value = 0.0006, or MMT, **p-value = 0.0059, in PdgfrbSMC-WT/WT lesions, with these contributions increasing dramatically in PdgfrbSMC-Δ/Δ mice. (E) EC-lineage-tracing mice (Cdh5-eYFP) were fed a WD for 18 weeks and analyzed for EC-derived cells within the fibrous cap. (F) Representative image of a lesion from the Cdh5-eYFP mice. (G) Quantification shows about 20% of ACTA2+ cells within the fibrous cap were derived from EC. (H) Cdh5-eYFP mice underwent lethal irradiation and BMT with tdTomato+ bone marrow prior to WD feeding to ablate SMC accumulation within BCA lesions. (I) Representative image showing loss of SMC within Myh11-eYFP lesions (left) and accumulation of EC within Cdh5-eYFP lesions (right) after lethal radiation. (J) Cdh5-eYFP+ cells account for nearly 70% of the ACTA2+ fibrous cap cells following radiation-induced loss of SMC accumulation. BM-tracing shows nearly 16% of ACTA2+ fibrous cap cells are tdTomato+ and thus of bone marrow origin. Scale bar: 100μm (B, C, F, I) or 20μm (F, I; zoom). Graphs were analyzed using two-tailed Mann-Whitney U test (D) or two-way ANOVA with Sidak correction and multiple comparisons (A) biologically independent animals are indicated as individual dots in (D) and n = 8, 9, 6 (WT: 300, 450, 750 μm) or n = 8, 8, 7 (KO) in (A), n= 12, 13 for each location (G), n= 12 (J), error bars represent mean ± SEM, p-values displayed refer to two-way ANOVA between genotype unless otherwise indicated.
Figure 4:
Figure 4:. After 26 weeks of WD feeding, PdgfrbSMC-Δ/Δ mouse lesions lack SMC investment and have reduced indices of lesion stability.
(A) After 26 weeks of WD, (B) PdgfrbSMC-WT/WT mice exhibited robust SMC accumulation within the fibrous cap, which was reduced by more than 90% in PdgfrbSMC-Δ/Δ mice. ***p-value < 0.0001. (C) Representative PSR images and (D) quantification of collagen in the lesion, **p-value = 0.001, and fibrous cap, *p-value < 0.0368, demonstrated significantly reduced collagen content. (E) Representative Ter119 staining and (F) quantification of intraplaque hemorrhage in the lesion showed significantly increased Ter119 staining over three locations. ***p-value of interaction < 0.0001. (G) Despite loss of SMC, there were no changes in the percentage of total ACTA2+ cells within the fibrous cap at 26 weeks of WD, likely due to compensatory increases in EndoMT, **p-value = 0.0006, and MMT, p-value = 0.0876, as assessed by marker protein staining (H). X-axis values represent distance past the aortic arch. Scale bar: 100μm. Graphs were analyzed using two-tailed Mann-Whitney U test (H) or two-way ANOVA with Sidak correction and multiple comparisons (B, D, F, G), biologically independent animals are indicated as individual dots in (B, D, G, H), intraplaque hemorrhage was analyzed as either positive or negative staining and n = 6, 8, 8 (WT: 270, 570, 870 μm) or n = 9 (KO) in (G), error bars represent mean ± SEM, p-values displayed refer to two-way ANOVA between genotype unless otherwise indicated.
Figure 5:
Figure 5:. Persistent PDGFRB signaling in Myh11+ cells within advanced lesions is required for maintenance of ACTA2+ cell number and collagen content within the fibrous cap.
(A)Schematic of tamoxifen administration in mice with advanced lesions, which results in delayed-Pdgfrb deletion and Myh11-eYFP labelling in the subset of cells expressing Myh11-CreERT2 (located mainly within the media and fibrous cap). Lesions were harvested eight weeks after the final tamoxifen injection. (B) Representative images of the fibrous cap of PdgfrbSMC-WT/WT and PdgfrbSMC-Δ/Δ mice, outlined with dashed lines. Single cell counting of the fibrous cap shows KO of Pdgfrb in Myh11-CreERT2 -expressing cells resulted in (C) a reduction in total Myh11-eYFP+ cells, *p-value = 0.0126, and (D) decreased Myh11-eYFP+ ACTA2+ cells per total ACTA2+ cells in the fibrous cap, **p-value = 0.0016, despite (E) no change in the percentage of total ACTA2+ cells. (F) PdgfrbSMC-Δ/Δ resulted in decreased collagen deposition within the fibrous cap. *p-value = 0.0366. (G) To test global antagonism of PDGFRB, Myh11-eYFP mice were put on WD for 18 weeks prior to receiving daily injections of Imatinib or saline. (H) 100mg/kg/day of Imatinib resulted in 100% morbidity within 8 days as well as significant reductions in Myh11-eYFP+ cells, **p-value = 0.0017 (left) and SMC-derived ACTA2+ cells, **p-value = 0.0025 (right), in the fibrous cap. This resulted in a significant decrease in the overall number of ACTA2+ cells ***p-value of treatment = 0.009 (I) within the fibrous cap. X-axis values represent distance past the aortic arch. Scale bar: 20μm. Graphs were analyzed using two-way ANOVA with Sidak correction and multiple comparisons (C-F, H, I), or Kaplan-Meier curve with Log-rank test (G), n = 4 (WT) and n = 5 (KO) for each location in (I), error bars represent mean ± SEM, p-values displayed refer to two-way ANOVA between genotype unless otherwise indicated.
Figure 6:
Figure 6:. Aerobic glycolysis is necessary for the PDGF/TGFB-driven transition of cultured SMC to an ECM producing myofibroblast-like state.
(A) Schematic showing the experimental design. Briefly, isolated flow-sorted murine aortic SMC were plated, serum starved, and treated with recombinant PDGF-DD for 24hr followed by recombinant TGFβ1 with or without LDH-inhibitor Galloflavin or PDHC-inhibitor CPI613 for 24 hours. (B) Representative phase contrast images and (C) gene expression showing PDGF and TGFβ induced Itgb3, representative of a myofibroblast-like state. [Itgb3 p = 0.0001, p = 0.0002, and p = 0.0001]. Blocking LDH or PDHC resulted in a change in myofibroblast gene expression. (D) Energy capacity map representing the bioenergetic potential of SMC using glycolytic capacity (x-axis, maximal ECAR) and respiratory capacity (y-axis, maximal OCR). (E) mRNA expression of ECM-associated genes. [Col1a1 p = 0.0024 and p = 0.0056; Col15a1 p = 0.0001, p < 0.0001, p < 0.0001, and p < 0.0001; Col8a1 p < 0.0001, p = 0.0006, p = 0.0106, and p = 0.0147; Spp1 p = 0.0082, p = 0.0158, p < 0.0001, and p < 0.0001; Fn1 p = 0.0002, p = 0.0012, p = 0.0622, and p = 0.0481]. Scale bar: 100μm. Graphs were analyzed using one-way ANOVA with Tukey’s correction for post-hoc analysis, error bars represent mean ± SEM, p-values displayed refer to two-way ANOVA between genotype unless otherwise indicated.
Figure 7:
Figure 7:. EC expression of ACTA2 and ECM components is interleukin-1 dependent.
(A) Schematic showing experimental design. Briefly, human umbilical vein endothelial cells (HUVEC) were plated at confluence and incubated in basal media for 24–72 hours. Cells were treated with Vehicle, IL1β (10ng/mL), TGFβ2 (10ng/mL), and PDGF-DD (10ng/mL) for 4–6 days. (B) mRNA expression of endothelial marker genes including PECAM, CDH5, and NOS3, measured by qPCR. [NOS3 p = 0.0311]. (C) mRNA expression of EndoMT genes including ACTA2, SNAI1, TAGLN, and COL1A1. [ACTA2 p = 0.0022; SNAI1 p = 0.0002 and p = 0.0472; COL1A1 p < 0.0001; TAGLN p < 0.0001]. (D) Energy capacity map representing the bioenergetic potential of EC using glycolytic capacity (x-axis, maximal ECAR) and respiratory capacity (y-axis, maximal OCR). (E) Representative images of BCA lesions from Il1r1EC-WT/WT and Il1r1EC-Δ/Δ mice fed 18 weeks of WD that were harvested and analyzed for EC content. EC-specific deletion of IL1R1 significantly reduced the contribution of EC to the ACTA2+ fibrous cap population, **p-value = 0.0034, (F), but had no effect on the overall percent of ACTA2+ cells within the fibrous cap (G). Arrows indicate Cdh5-eYFP+ ACTA2+ cells. Scale bar: 100μm (whole lesion) or 20μm (zoom). Graphs were analyzed using two-way ANOVA with with Sidak correction and multiple comparisons (F-G) or one-way ANOVA with Tukey’s correction for post-hoc analysis (B, C), error bars represent mean ± SEM, p-values displayed refer to two-way ANOVA between genotype unless otherwise indicated.

References

    1. Virmani Renu, Kolodgie Frank D., Burke Allen P., Farb Andrew & Schwartz Stephen M. Lessons From Sudden Coronary Death. Arteriosclerosis, Thrombosis, and Vascular Biology 20, 1262–1275 (2000). - PubMed
    1. Davies MJ, Richardson PD, Woolf N, Katz DR & Mann J Risk of thrombosis in human atherosclerotic plaques: role of extracellular lipid, macrophage, and smooth muscle cell content. Heart 69, 377–381 (1993). - PMC - PubMed
    1. Libby P, Ridker PM & Hansson GK Progress and challenges in translating the biology of atherosclerosis. Nature 473, 317–325 (2011). - PubMed
    1. Feil S et al. Transdifferentiation of vascular smooth muscle cells to macrophage-like cells during atherogenesis. Circ. Res 115, 662–667 (2014). - PubMed
    1. Shankman LS et al. KLF4-dependent phenotypic modulation of smooth muscle cells has a key role in atherosclerotic plaque pathogenesis. Nature Medicine 21, 628–637 (2015). - PMC - PubMed

Publication types

MeSH terms

LinkOut - more resources