. 2021 Mar;24(3):331-342.
doi: 10.1038/s41593-021-00802-y. Epub 2021 Feb 22.

Long-term maturation of human cortical organoids matches key early postnatal transitions

Affiliations

Long-term maturation of human cortical organoids matches key early postnatal transitions

Aaron Gordon et al. Nat Neurosci. 2021 Mar.

Abstract

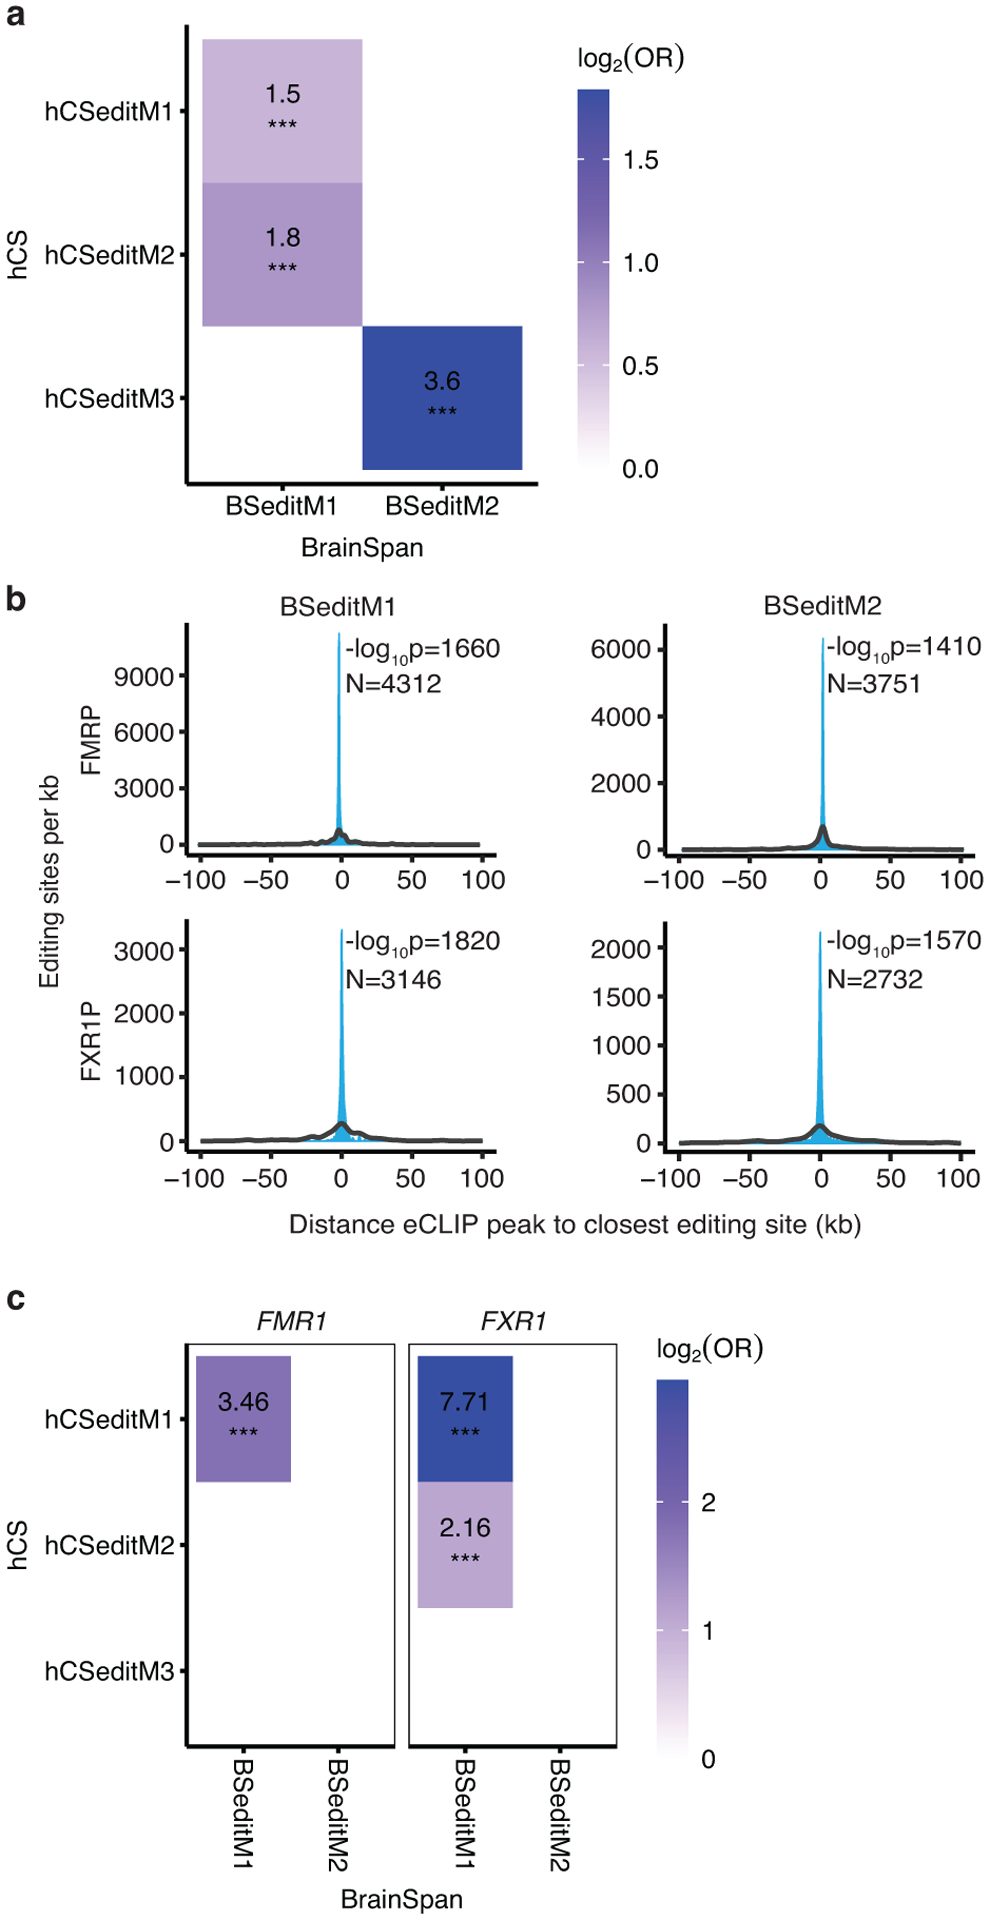
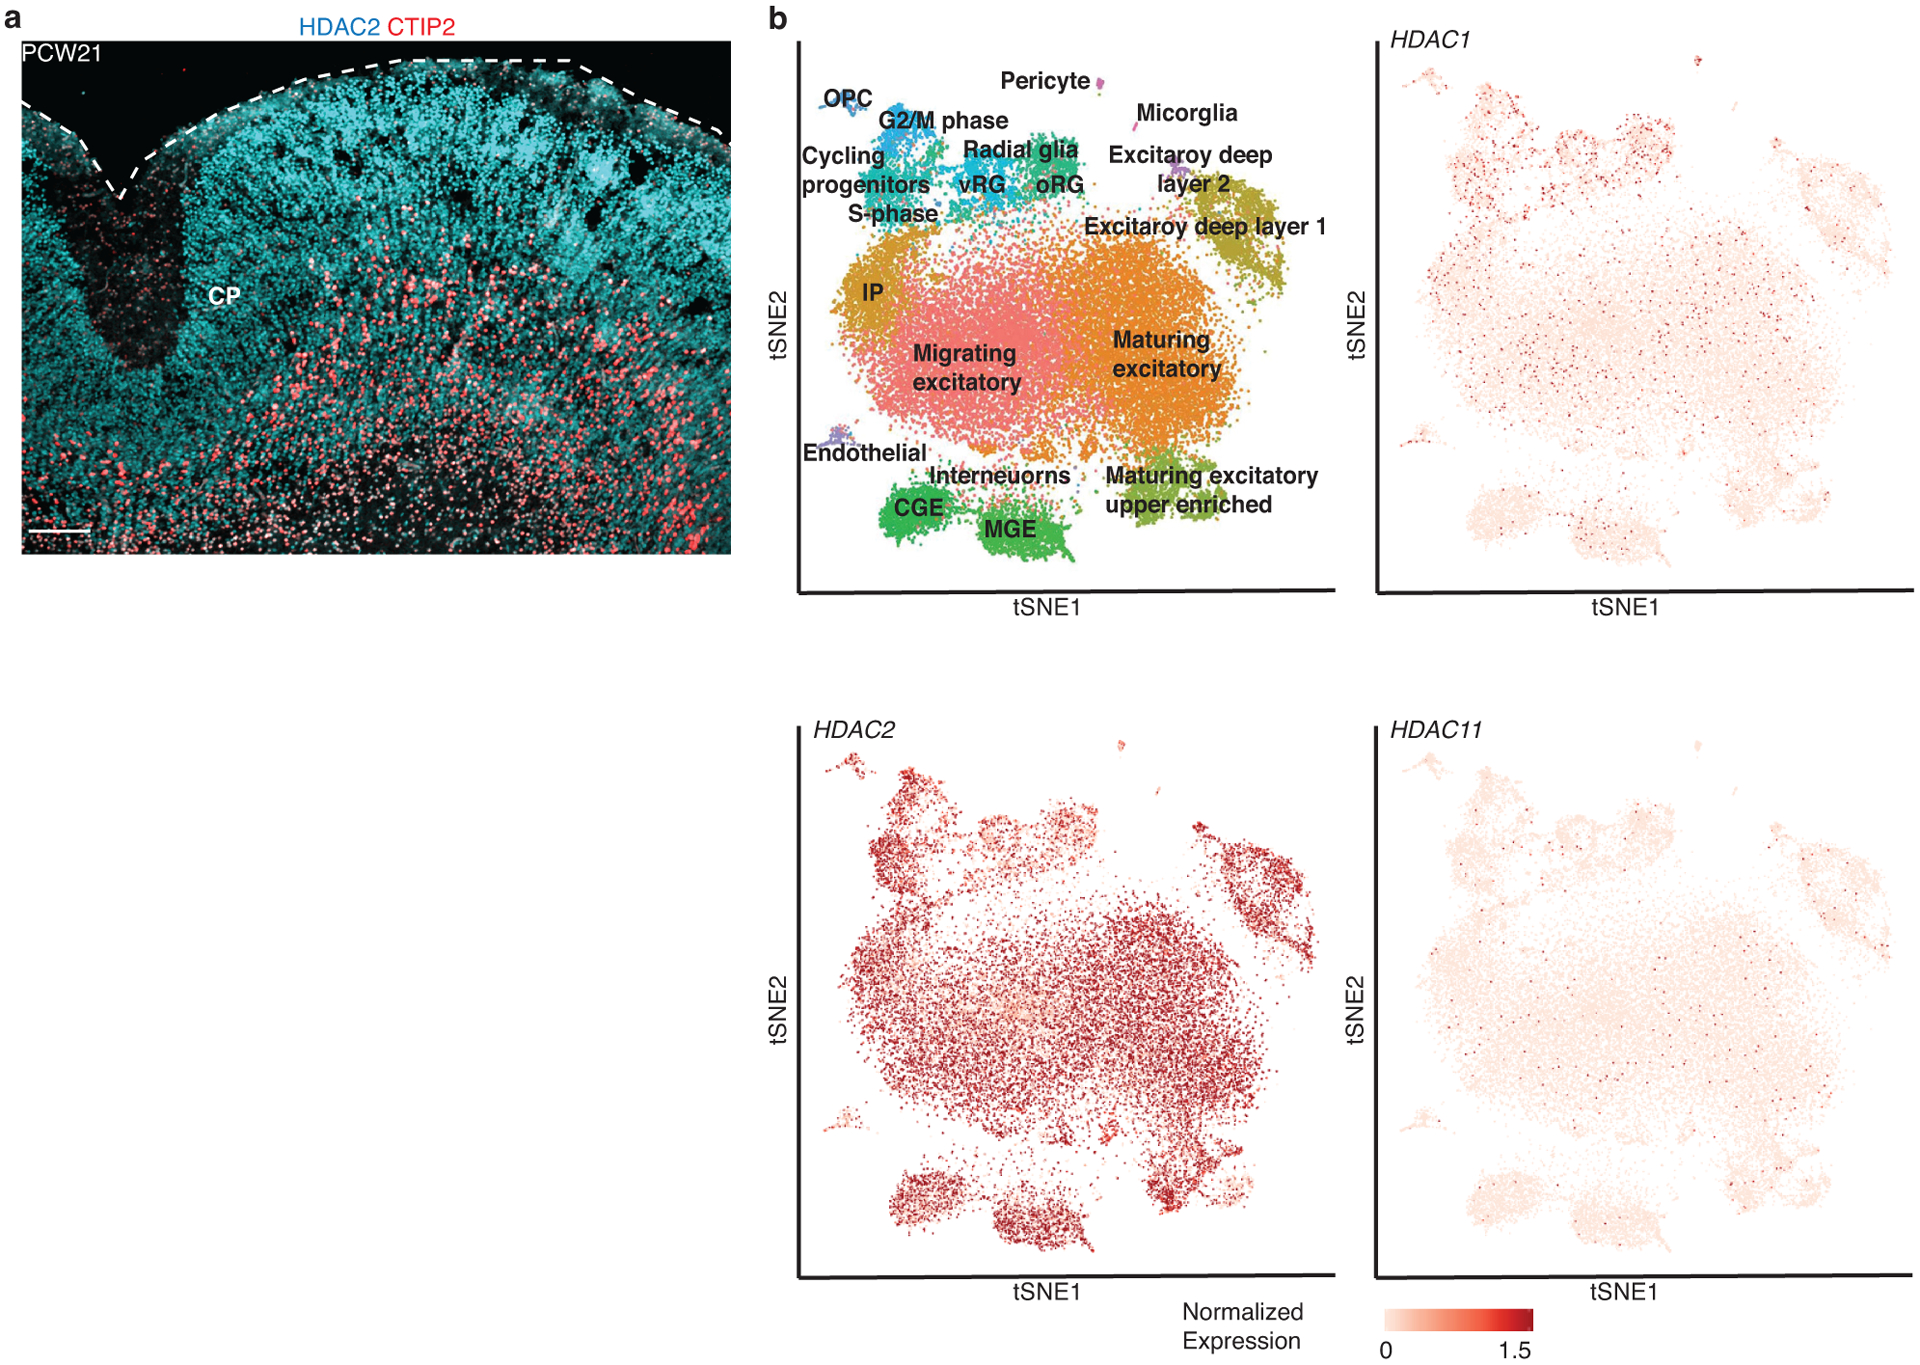
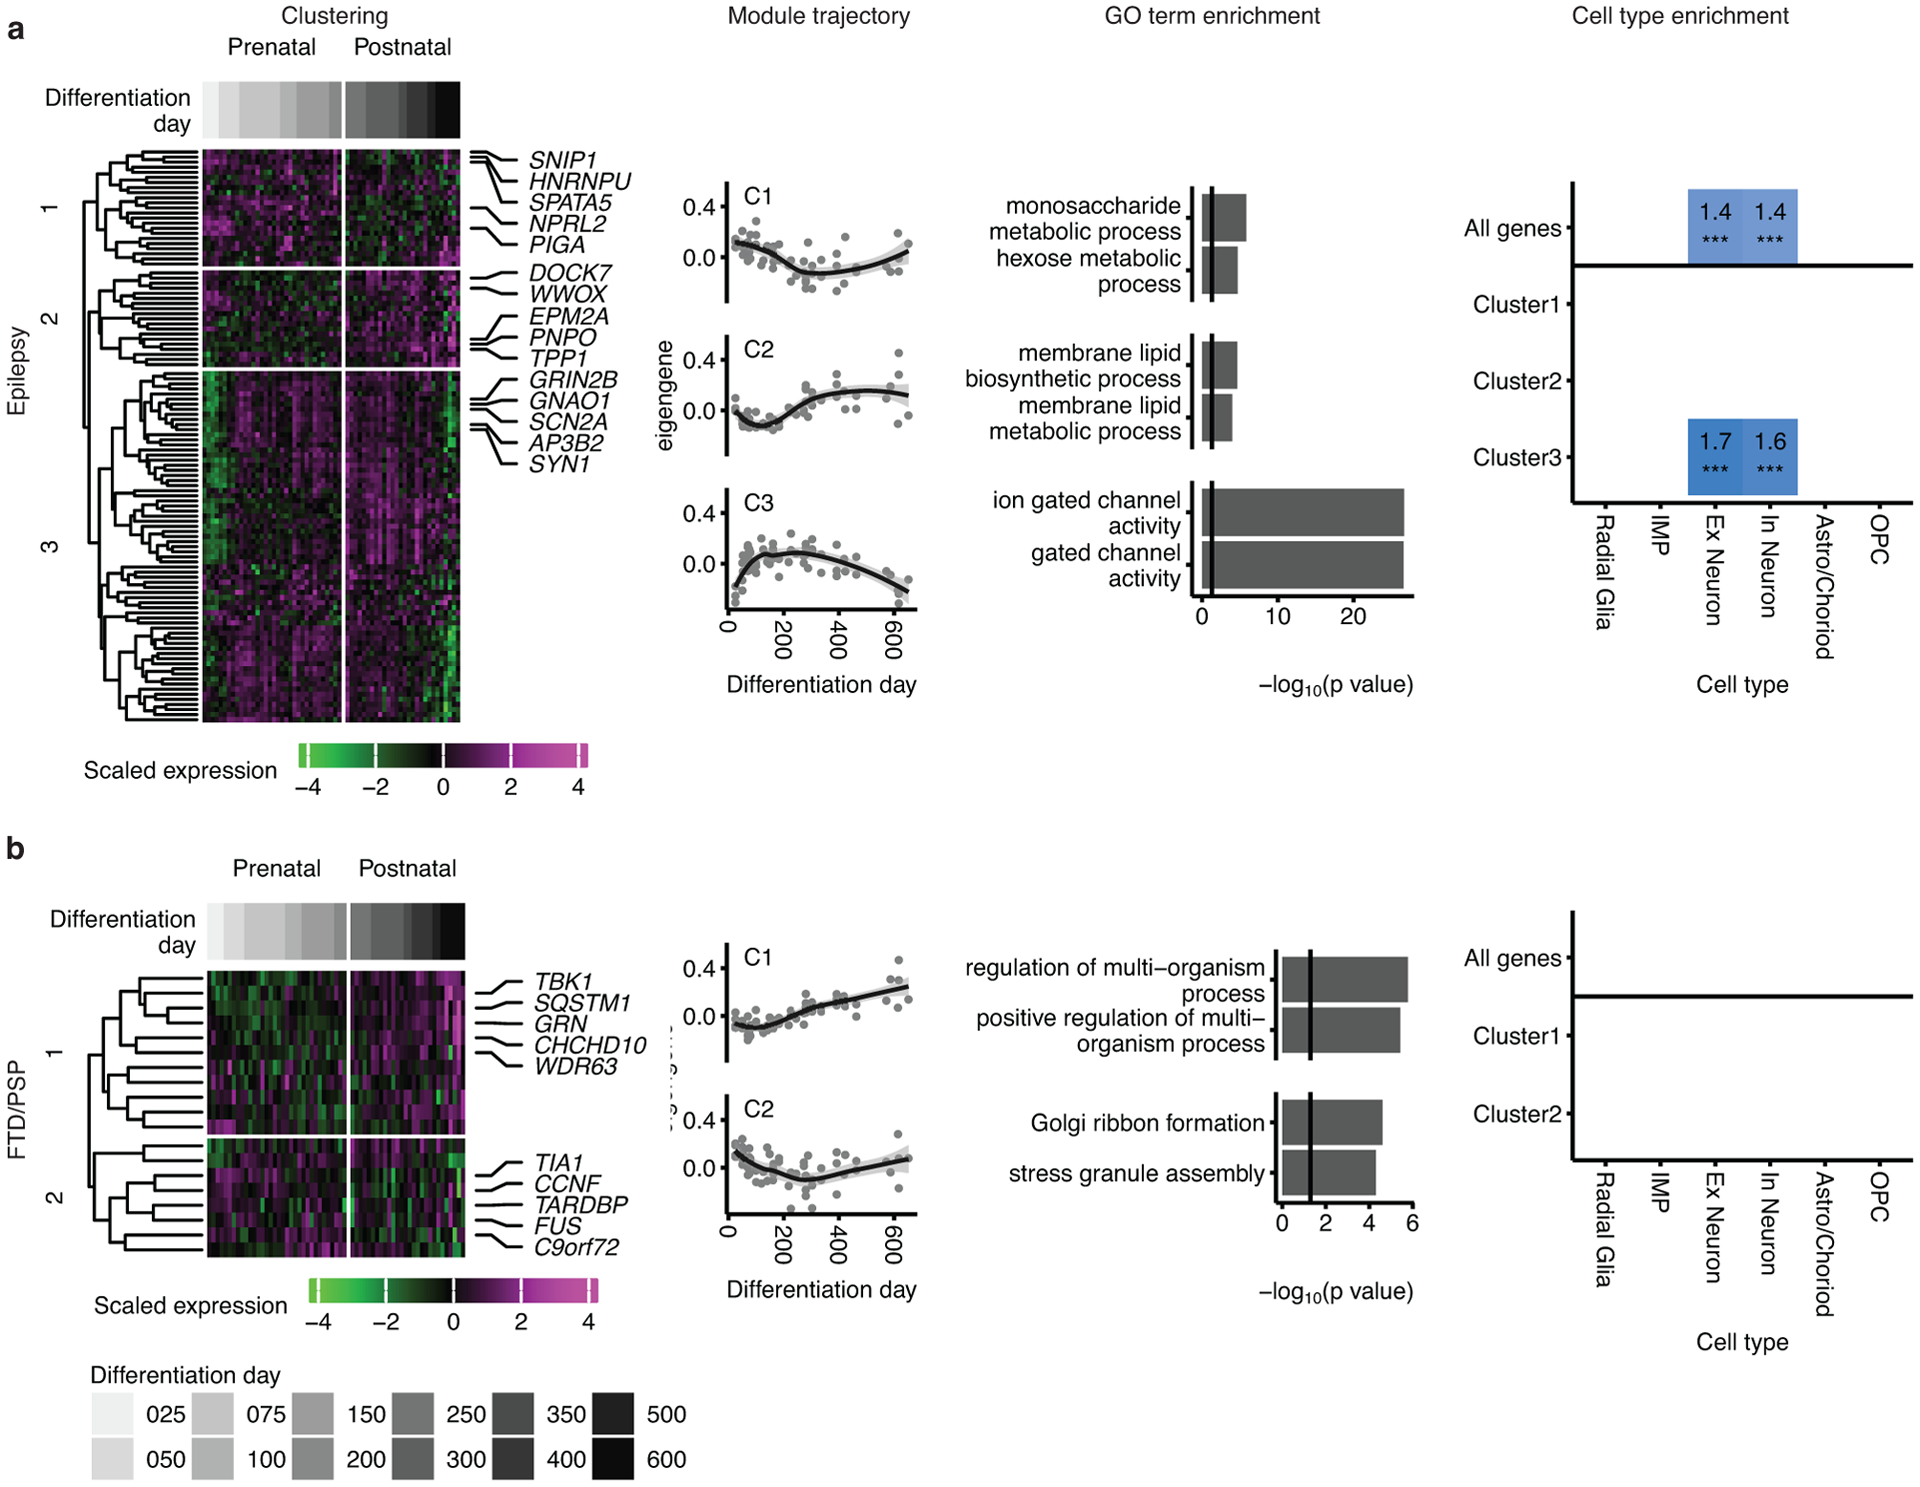
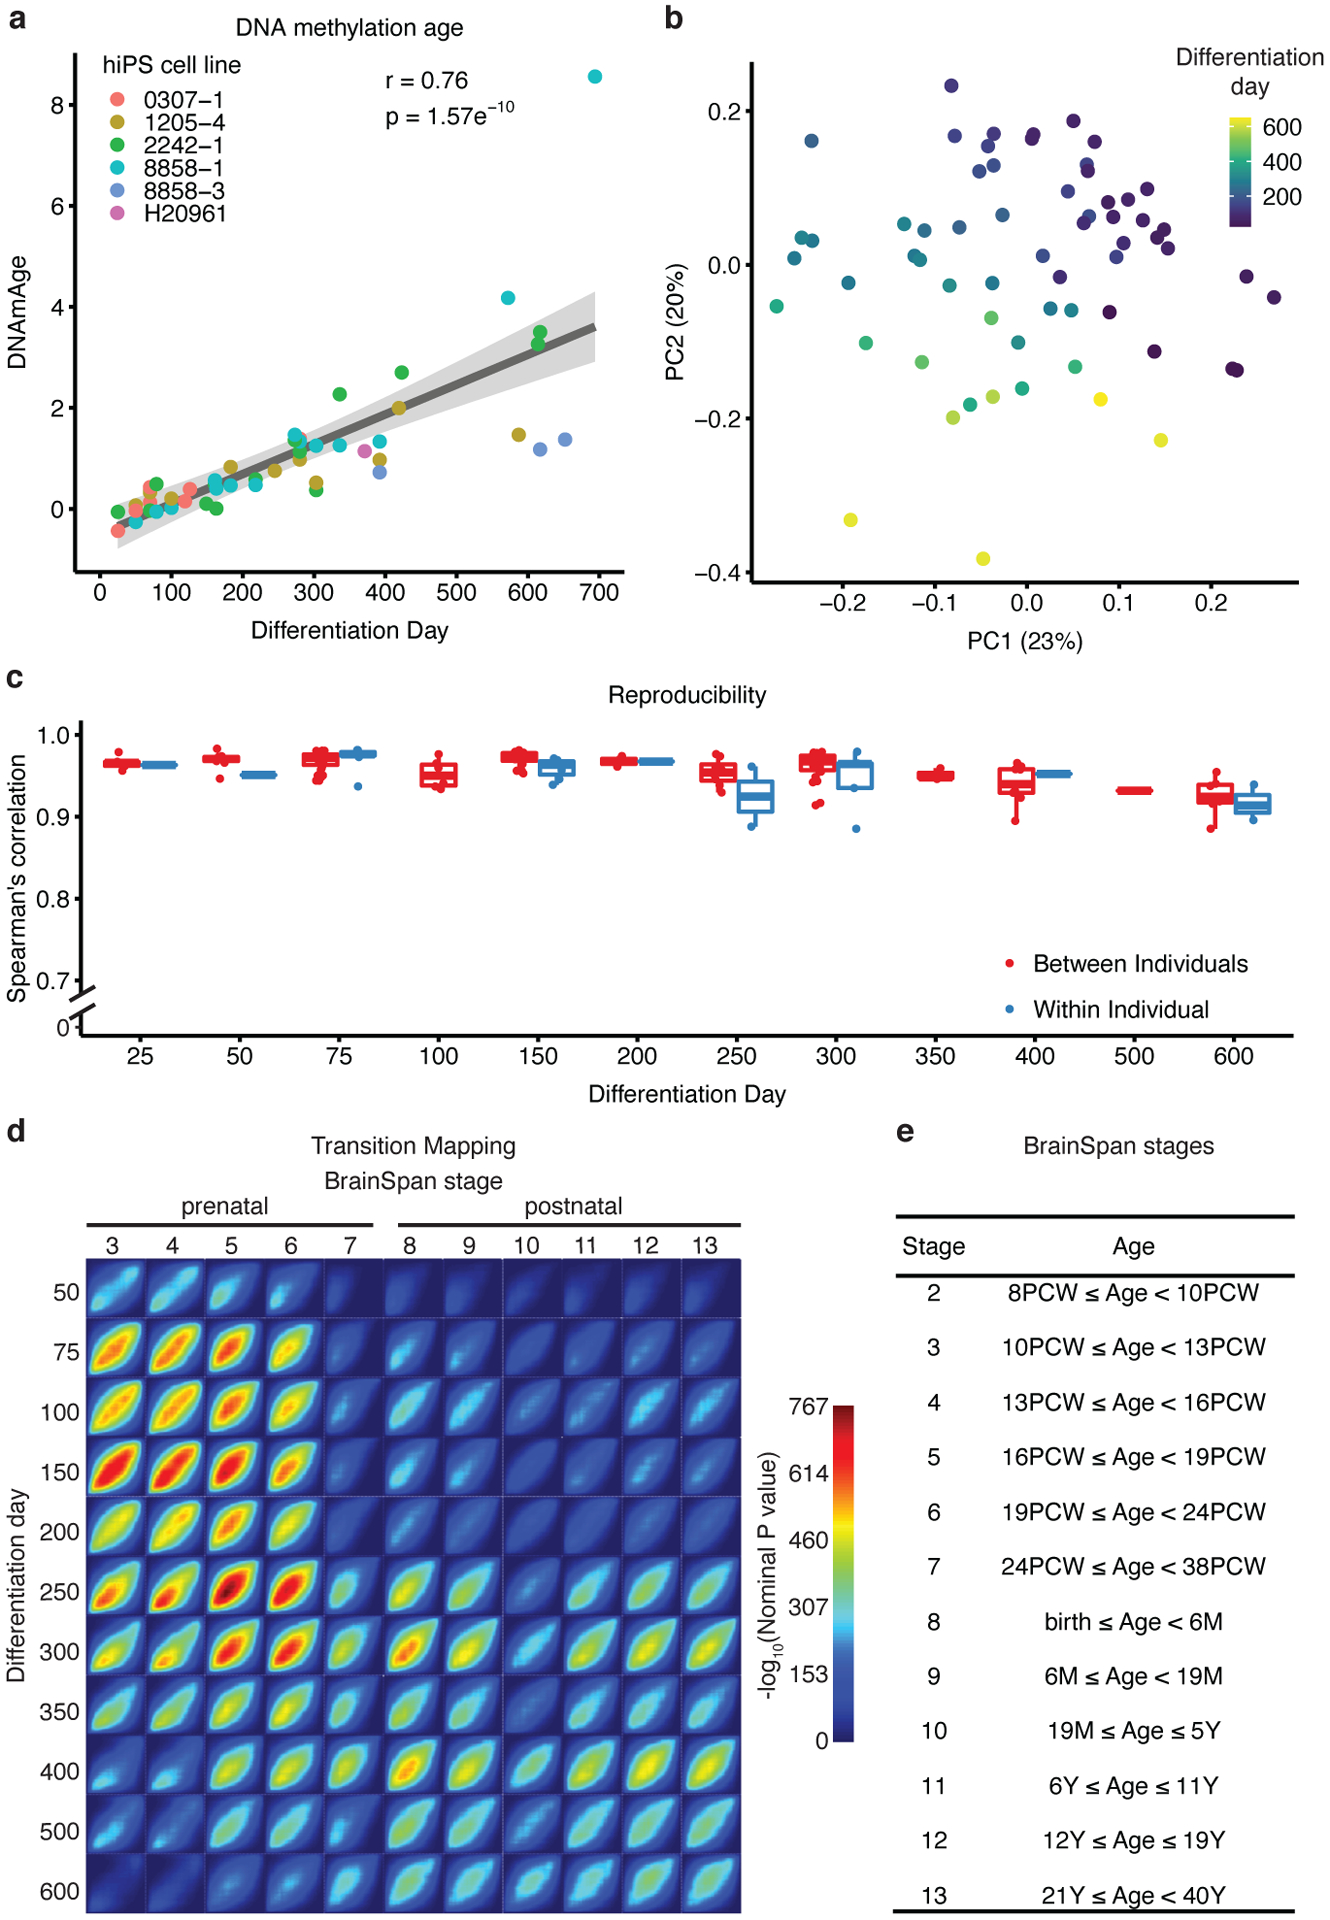
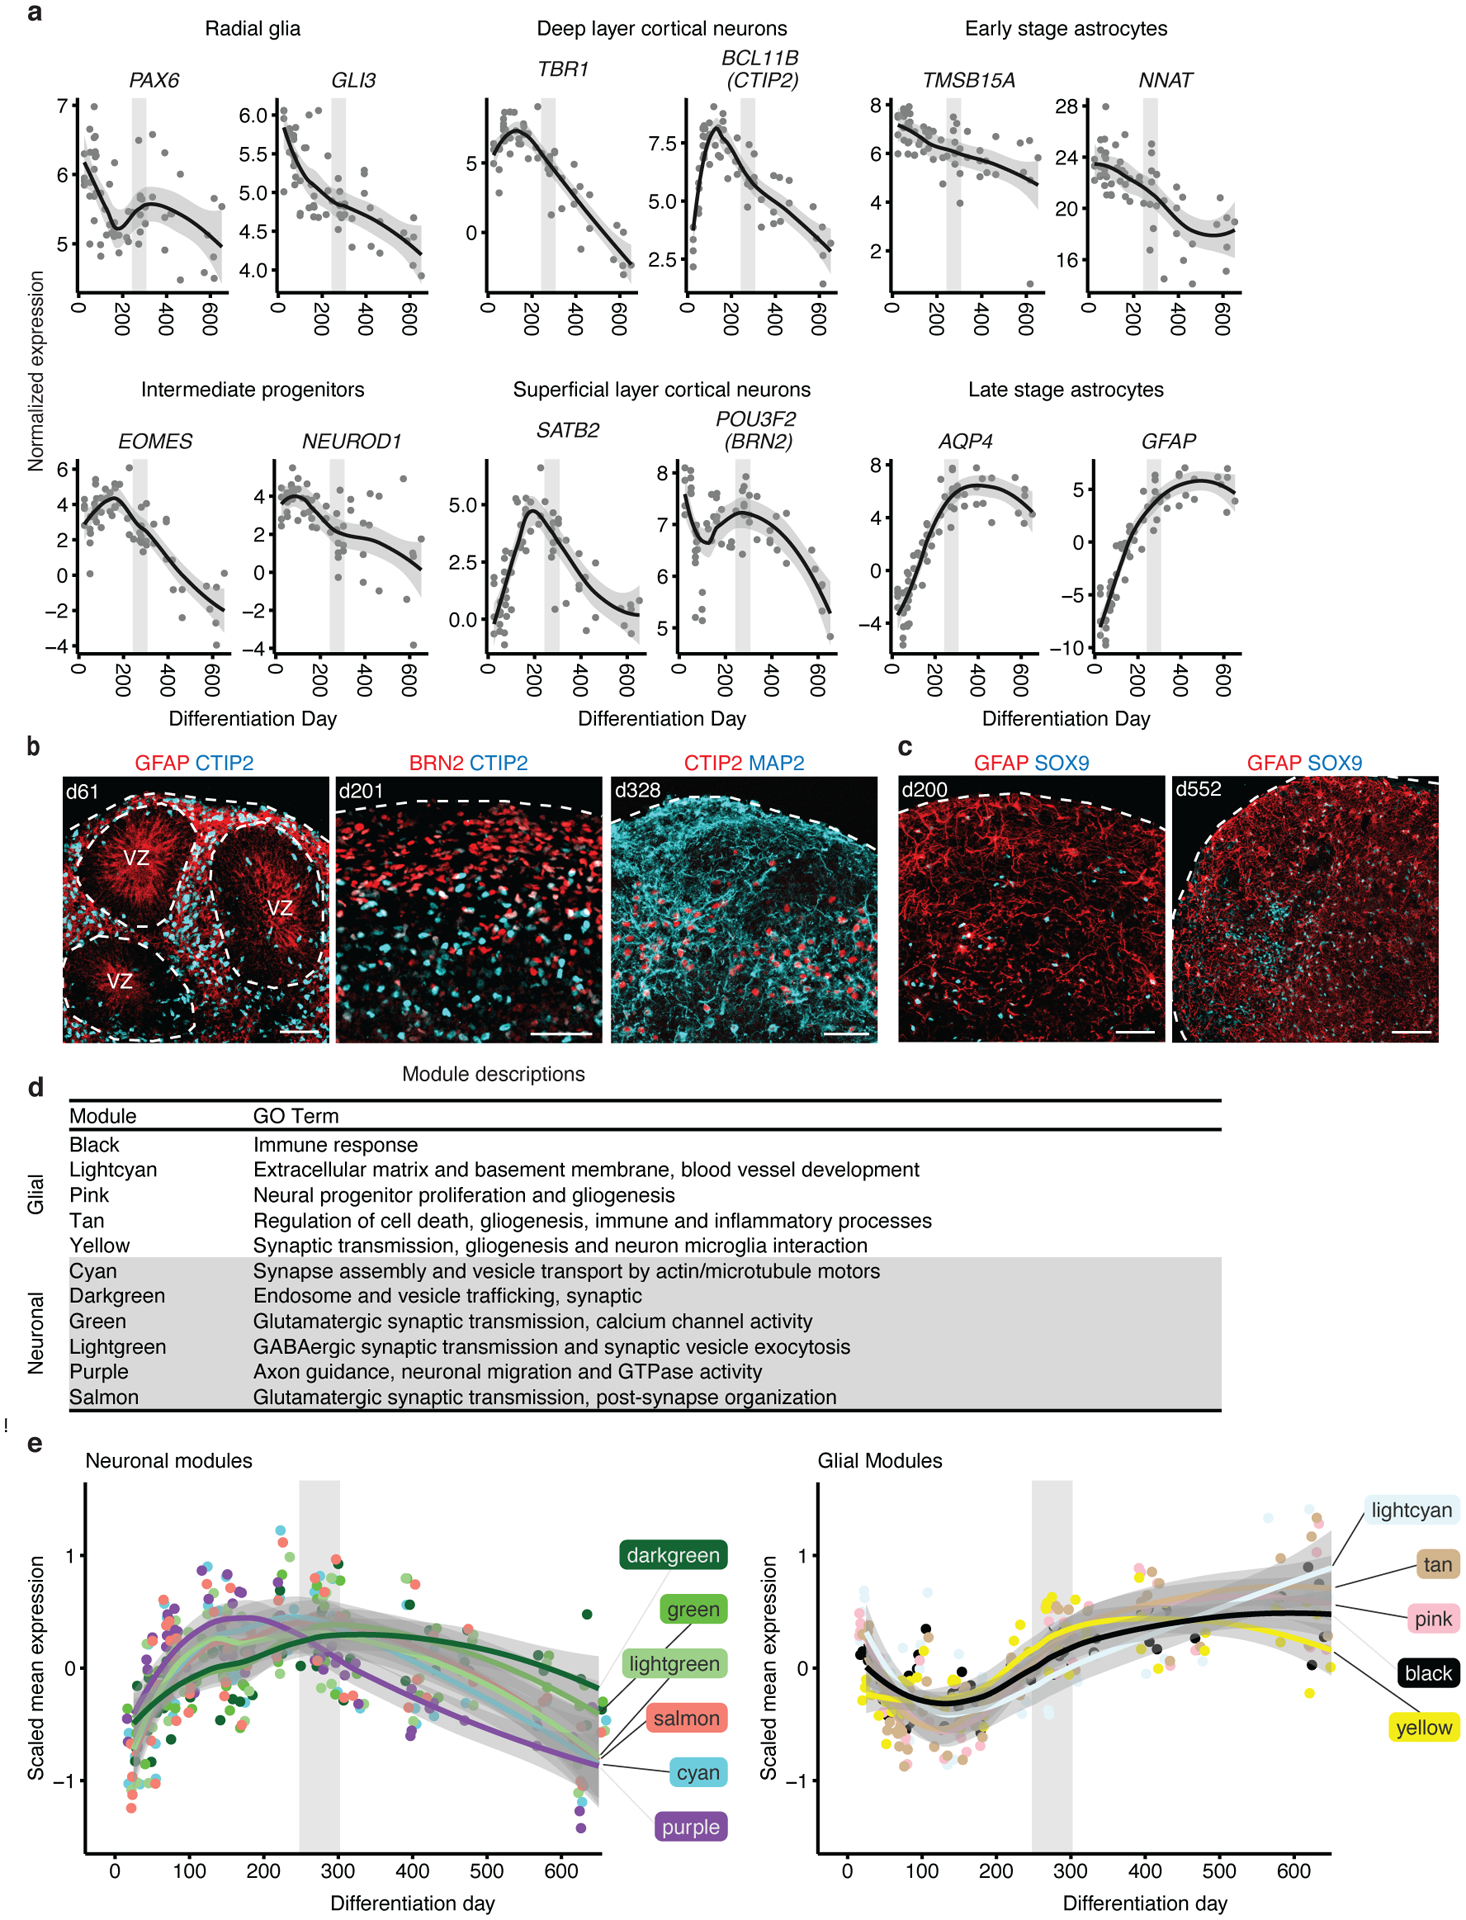
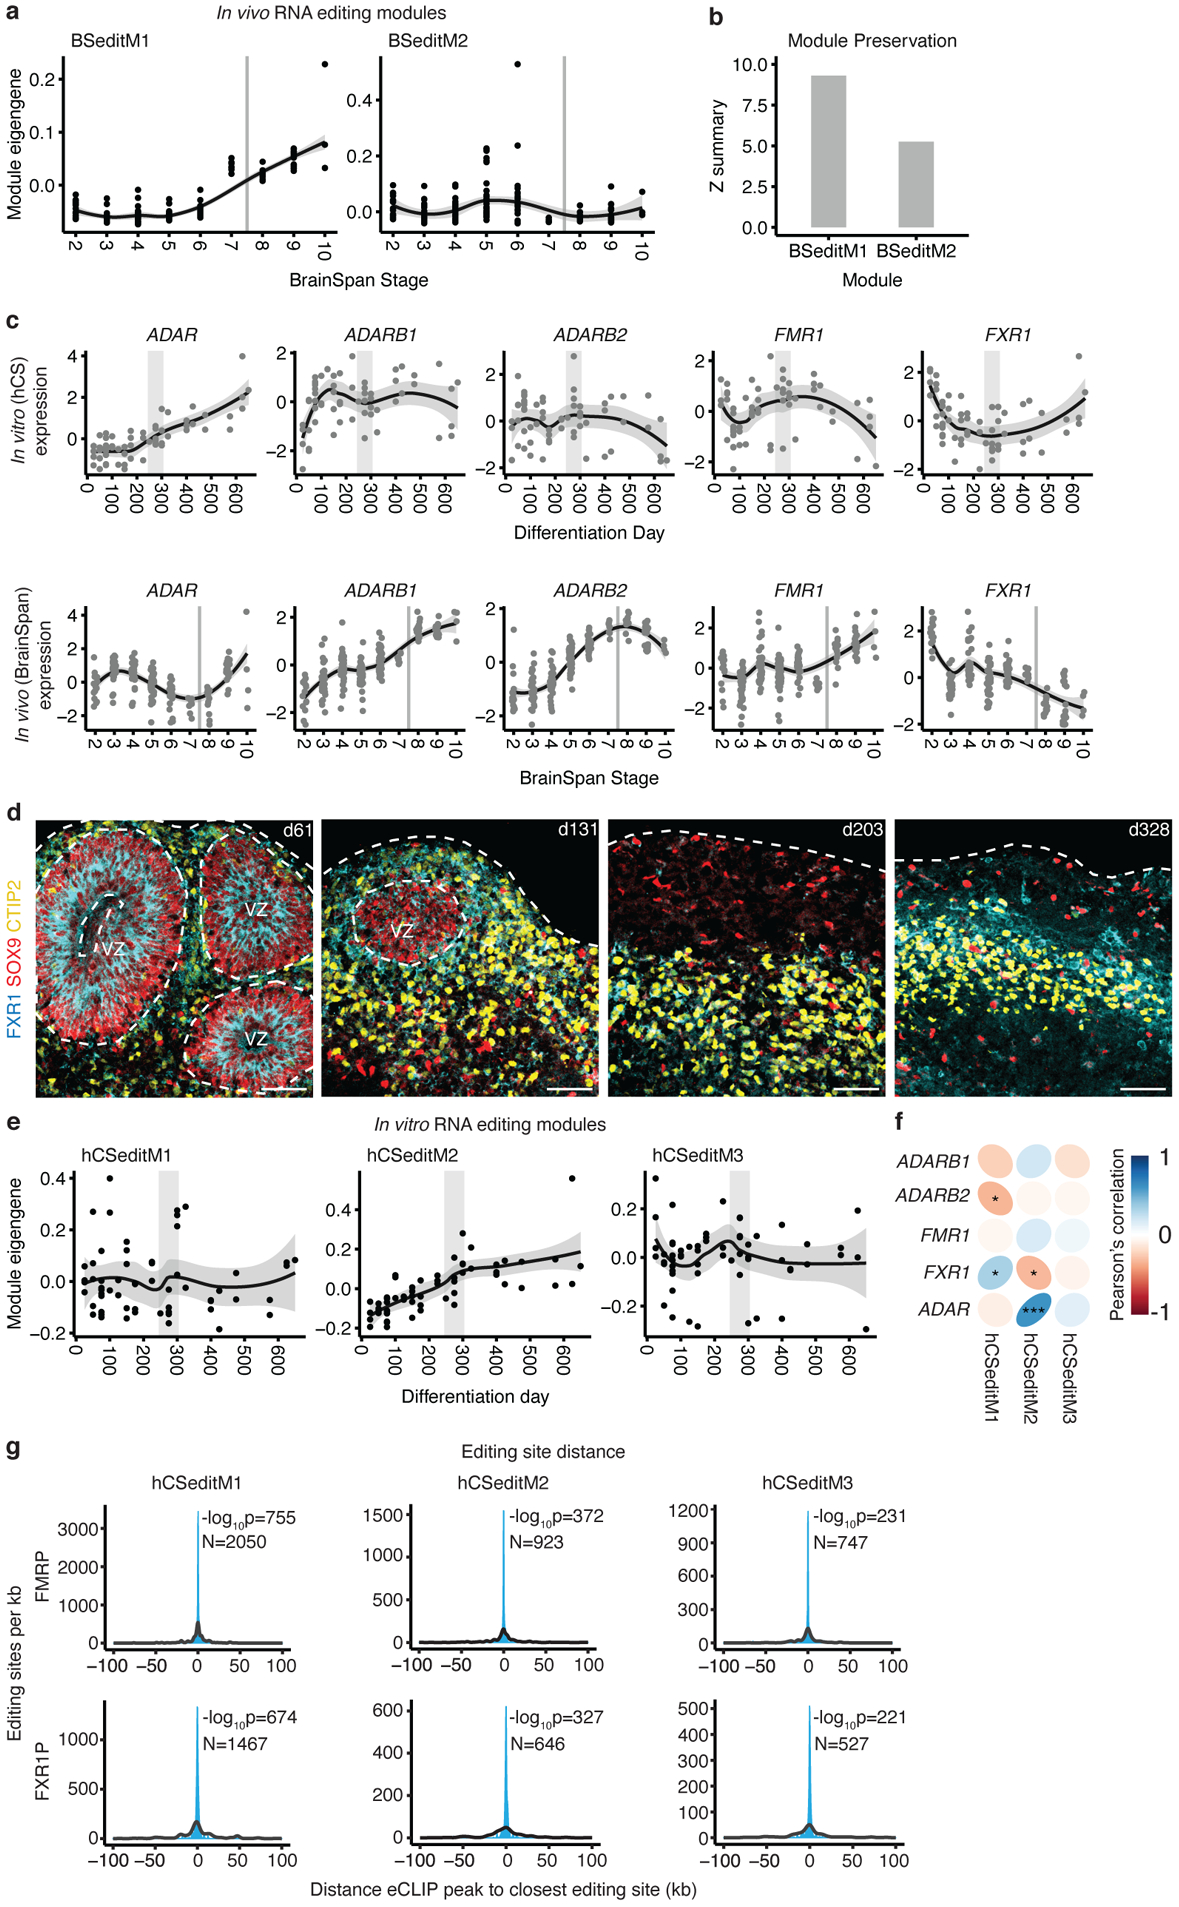
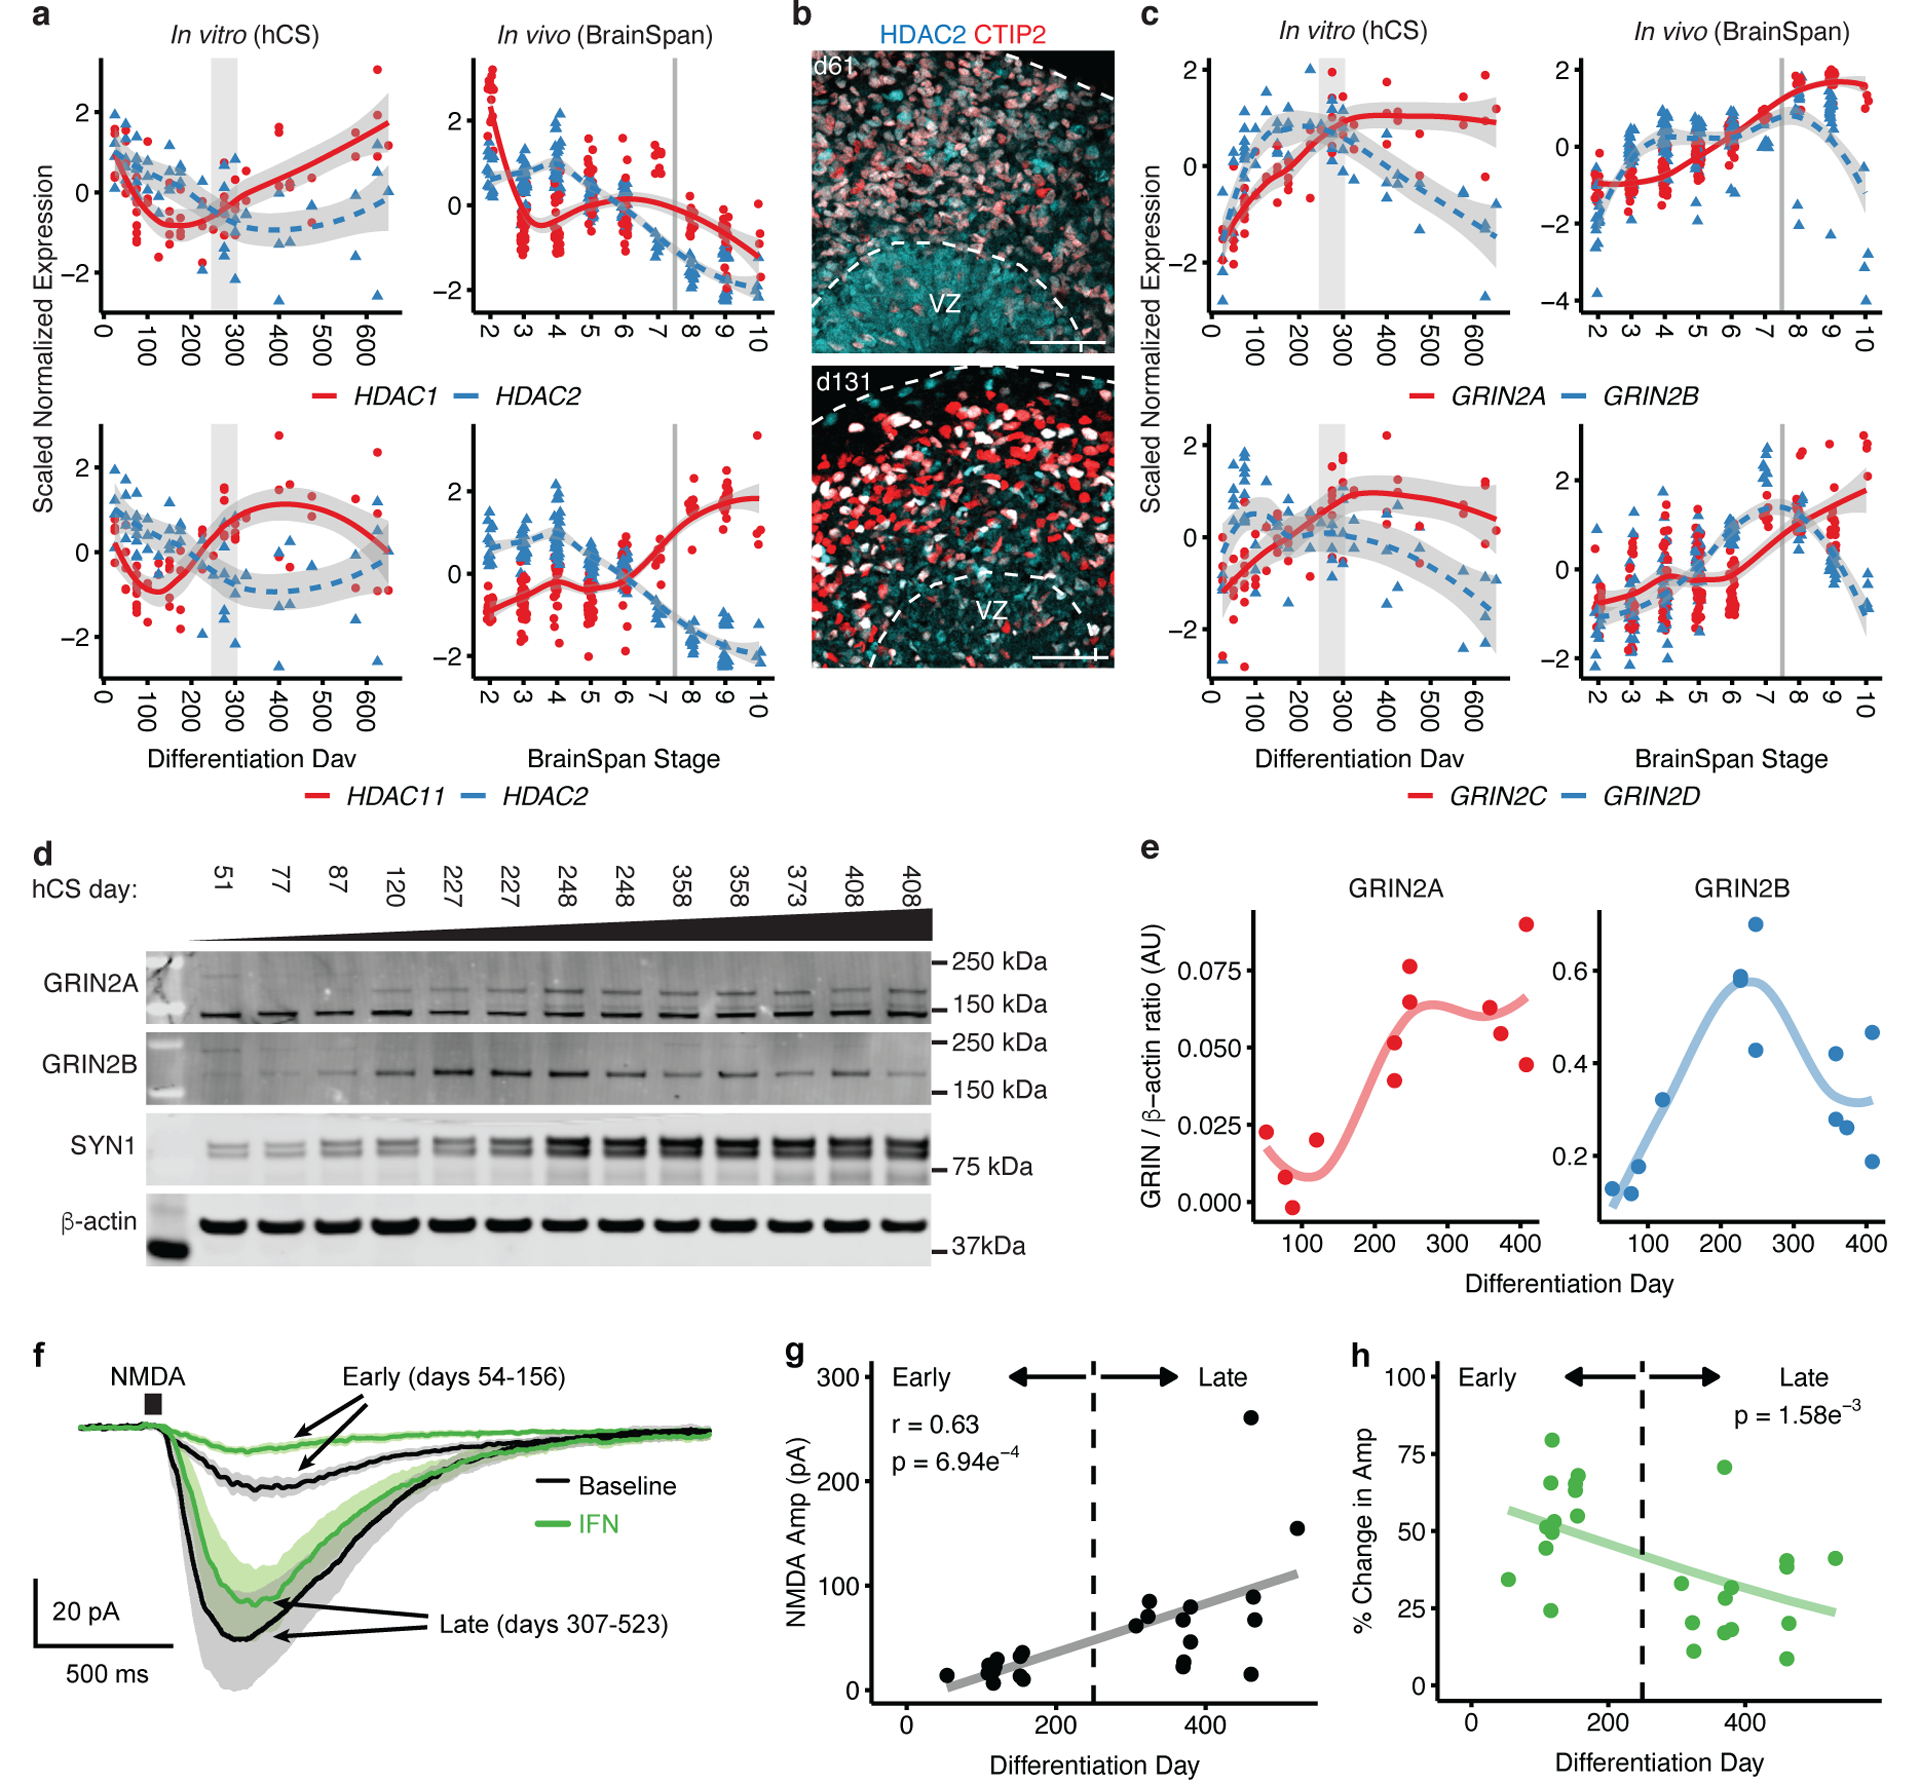
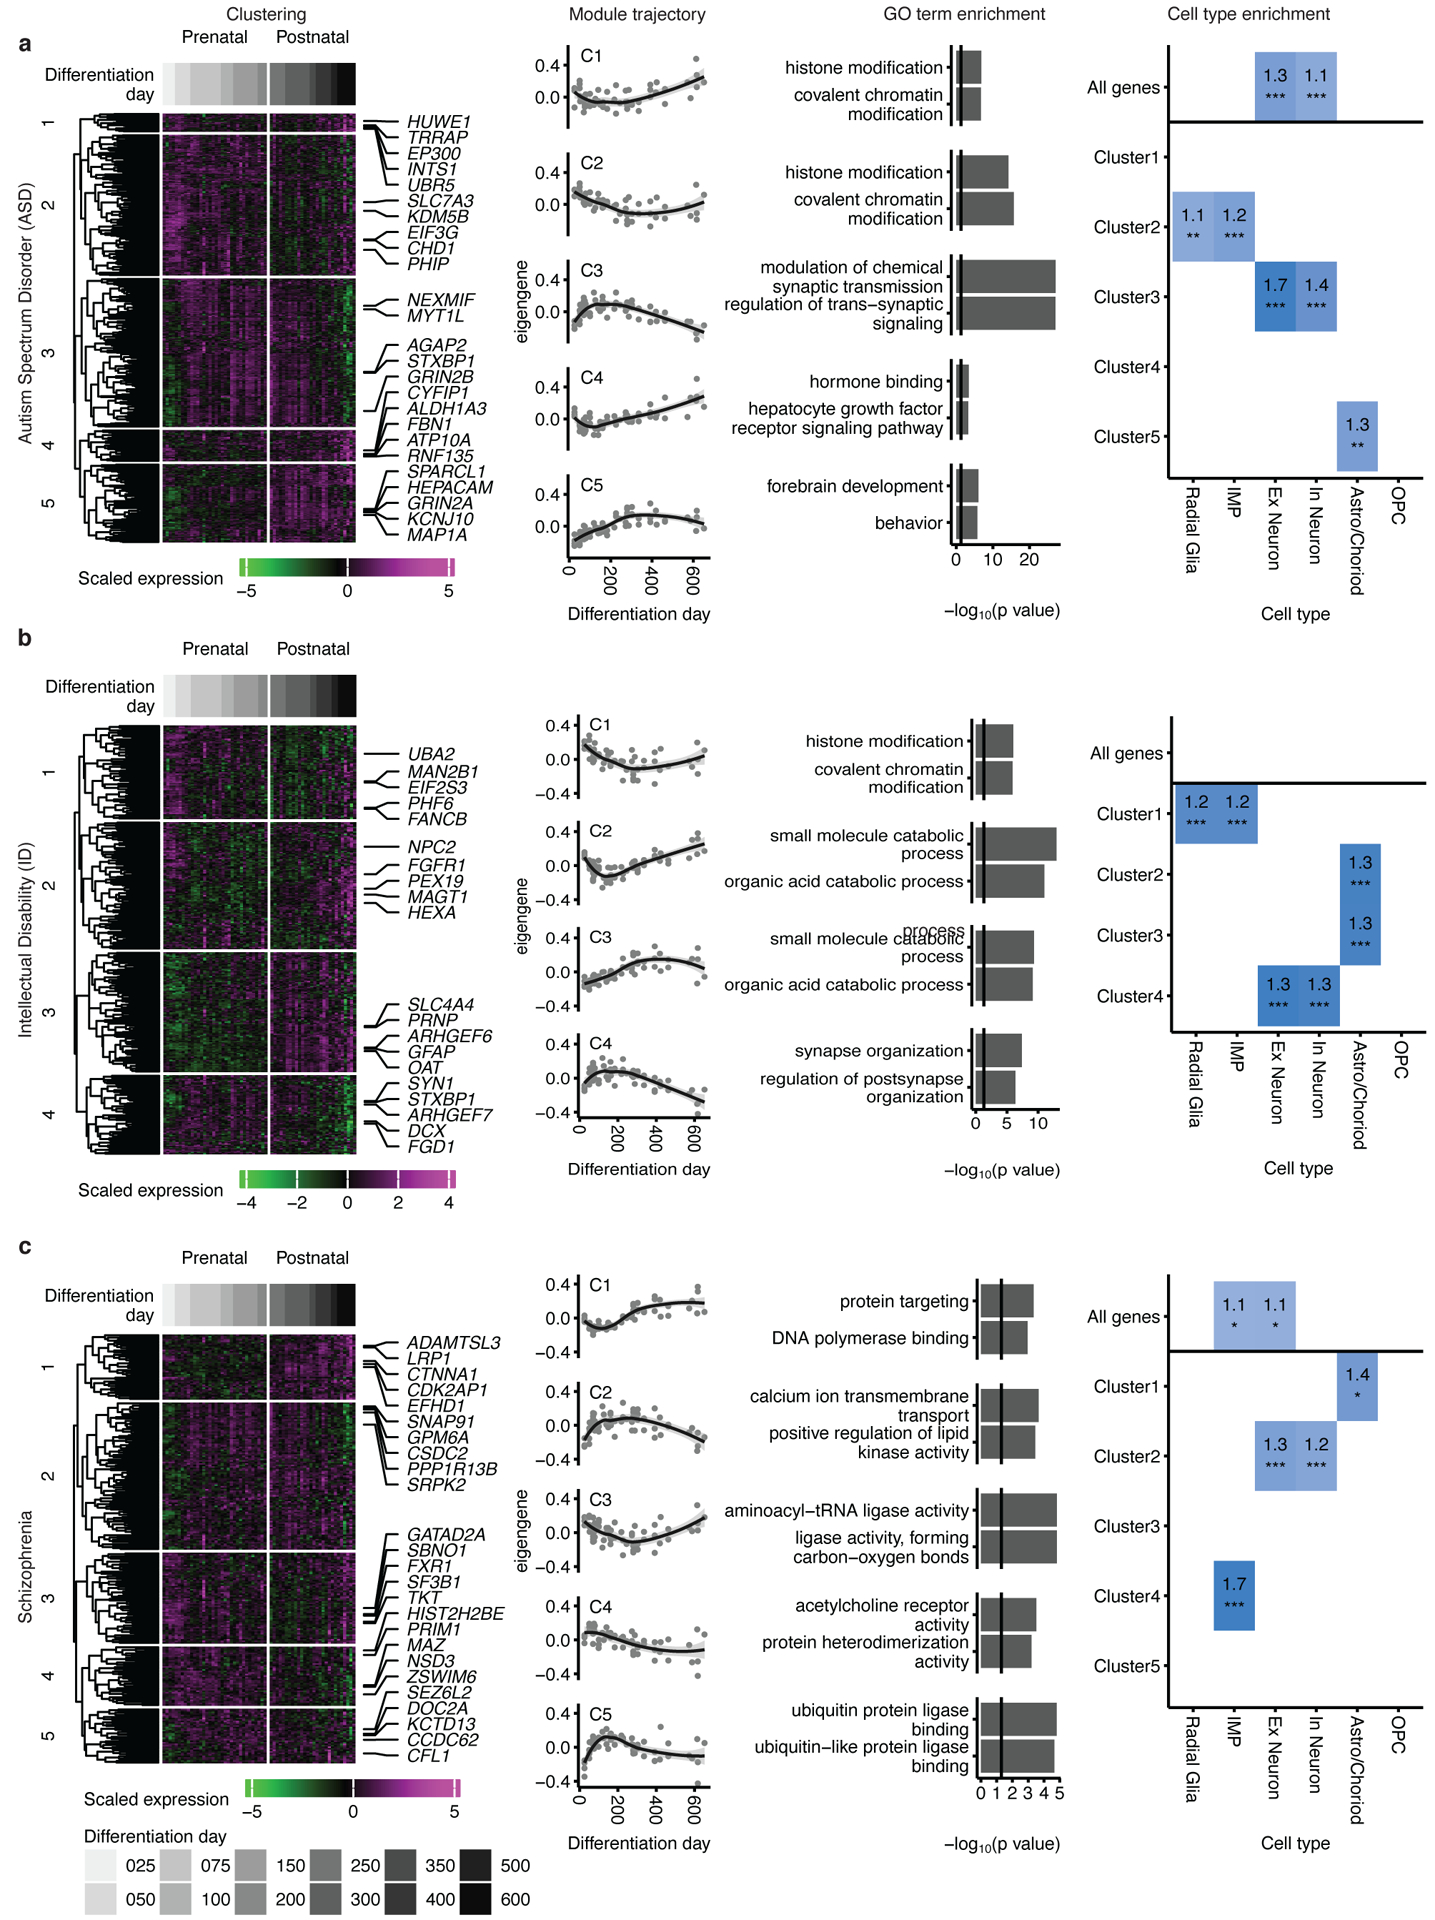
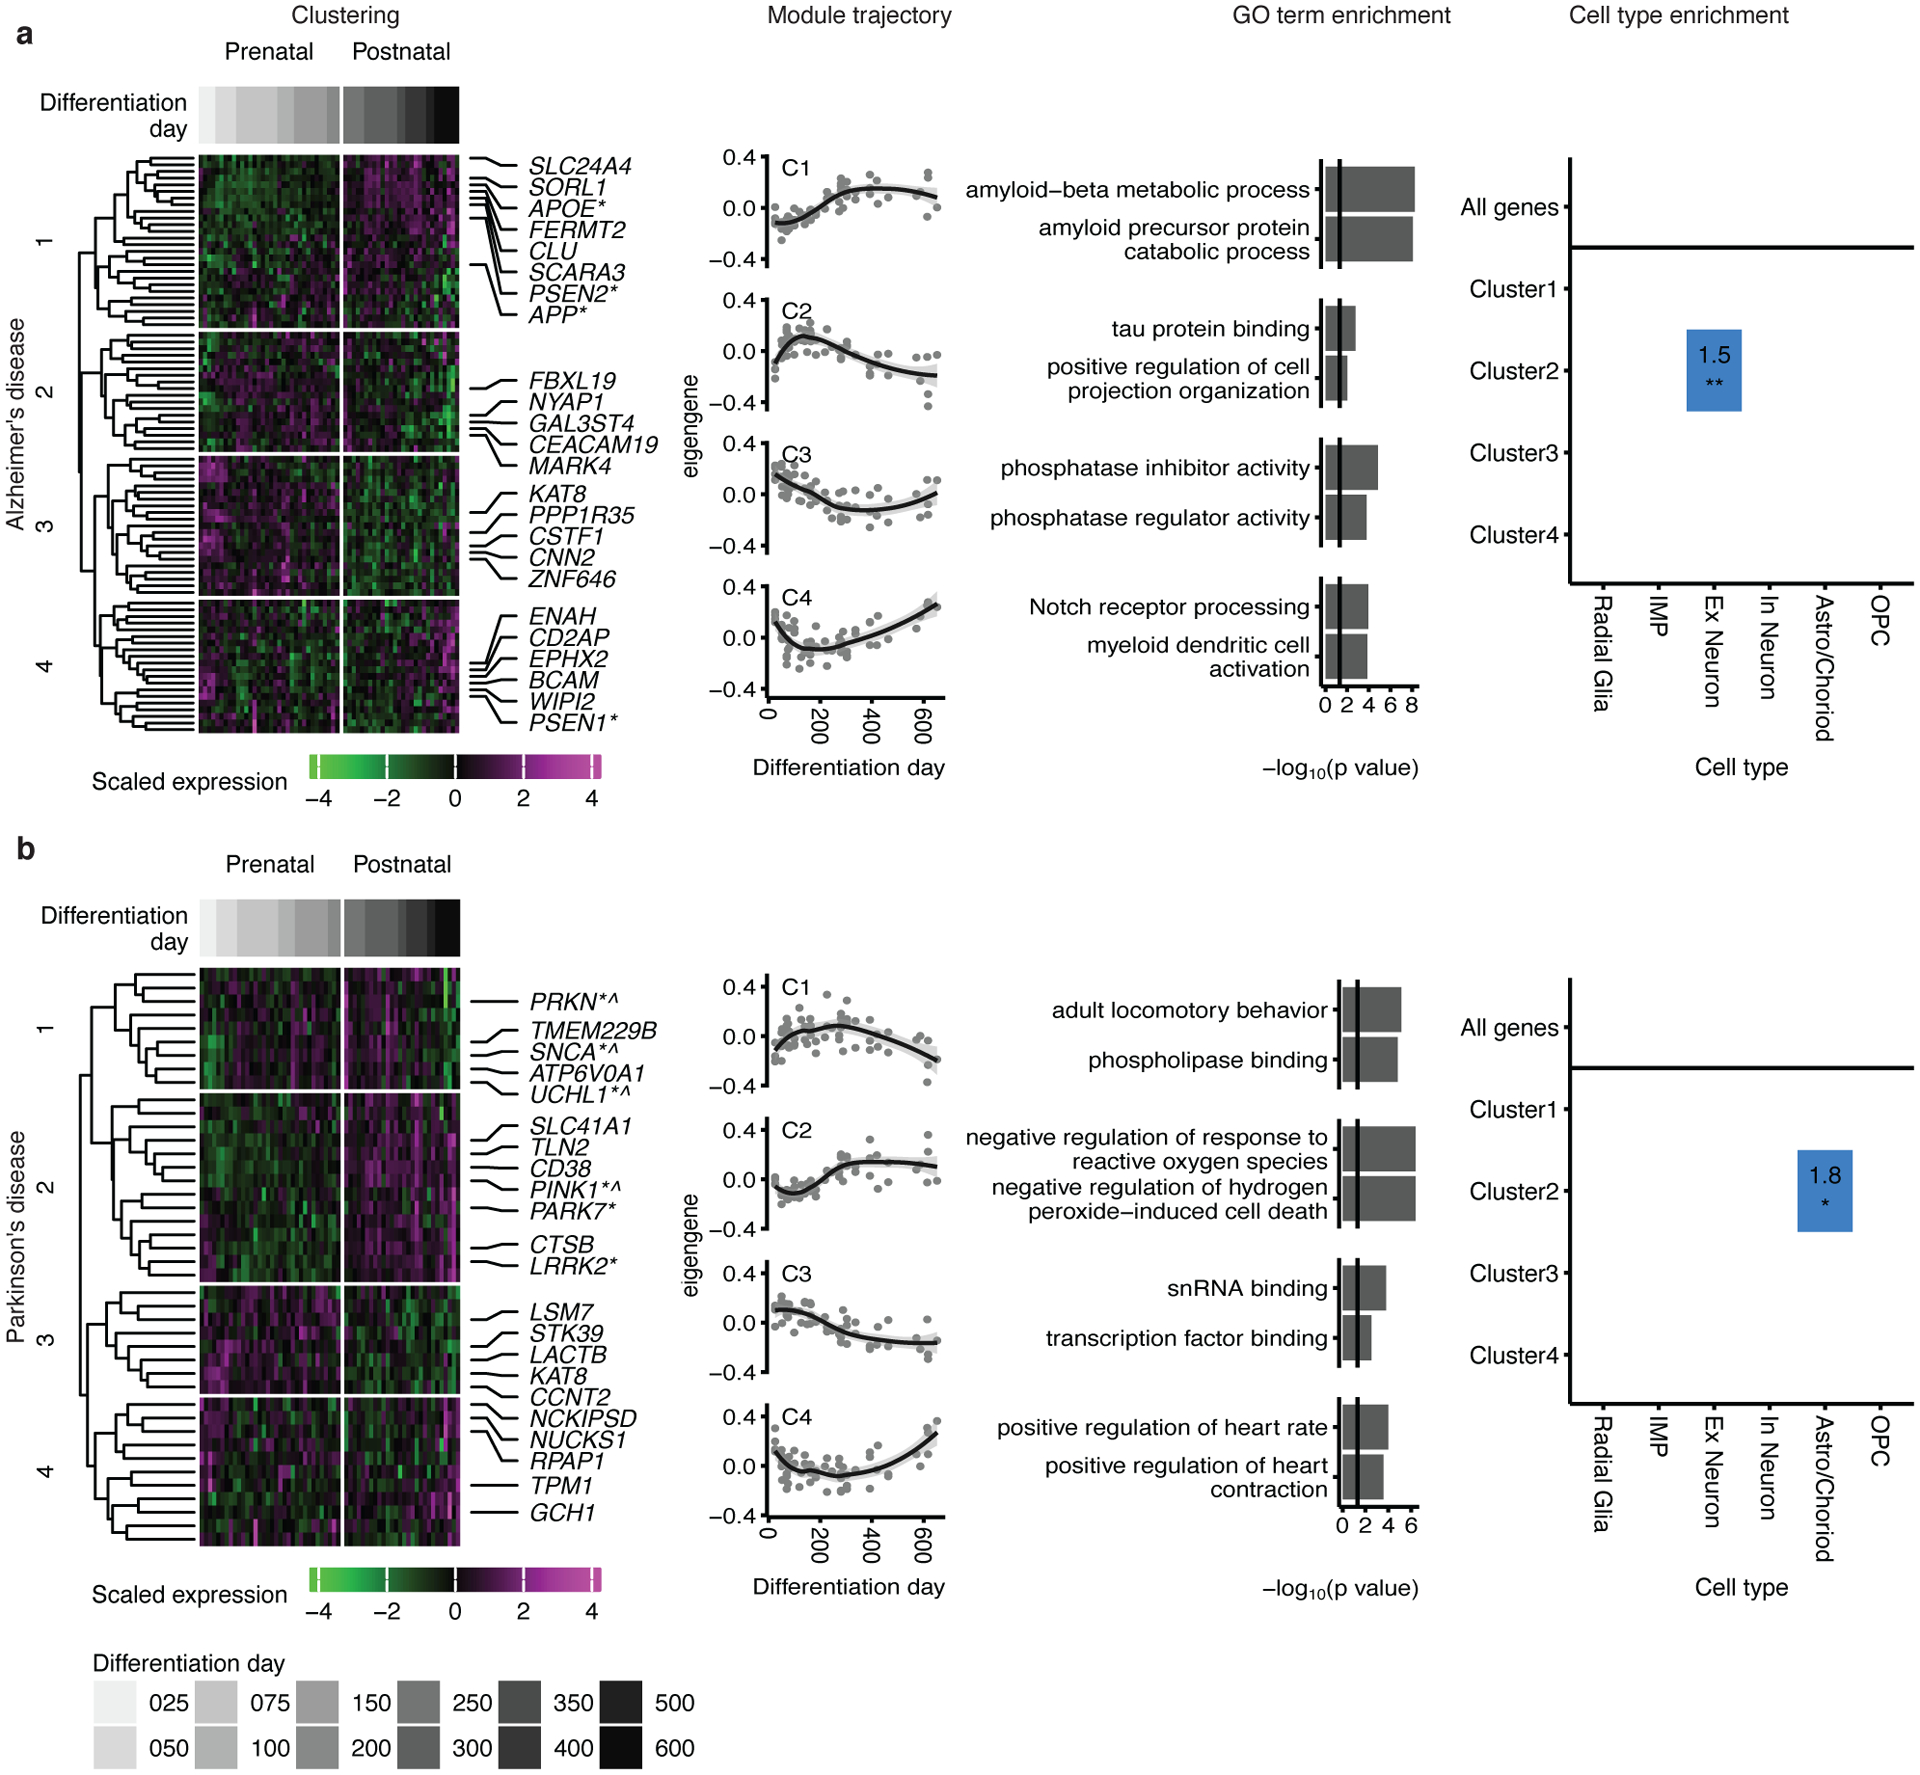
Human stem-cell-derived models provide the promise of accelerating our understanding of brain disorders, but not knowing whether they possess the ability to mature beyond mid- to late-fetal stages potentially limits their utility. We leveraged a directed differentiation protocol to comprehensively assess maturation in vitro. Based on genome-wide analysis of the epigenetic clock and transcriptomics, as well as RNA editing, we observe that three-dimensional human cortical organoids reach postnatal stages between 250 and 300 days, a timeline paralleling in vivo development. We demonstrate the presence of several known developmental milestones, including switches in the histone deacetylase complex and NMDA receptor subunits, which we confirm at the protein and physiological levels. These results suggest that important components of an intrinsic in vivo developmental program persist in vitro. We further map neurodevelopmental and neurodegenerative disease risk genes onto in vitro gene expression trajectories to provide a resource and webtool (Gene Expression in Cortical Organoids, GECO) to guide disease modeling.


Conflict of interest statement

Competing Interests Statement

S.P.P. is listed on a patent held by Stanford University that covers the generation of region-specific brain organoids (U.S. patent 62/477,858). All other authors declare no competing interests.

Figures

Extended Data Fig. 1
Extended Data Fig. 1. Data description and quality.
(a) Time points and hiPSC line information for the 62 samples used for RNA sequencing (left). Samples were differentiated from 5 cell lines derived from 4 individuals. Time points and hiPSC information for the 50 samples used for DNA methylation (right). Samples were differentiated from 6 cell lines derived from 5 individuals (see Supplementary Tables 1 and 2). Two samples (blue) were hybridized in replicate for quality control purposes and their values were averaged. Each point represents one sample from a specific cell line (y-axis) and differentiation day (x-axis). Full circles represent sample coming from males and rings represent samples coming from females. Grey and white background shading show aggregation of differentiation days into stages. (b) Principal component analysis (PCA) of the expression data. The values represent the adjusted r squared of the PC with the covariates indicated. The numbers in brackets on axis titles are the percent of variance explained by the PC. The first 5 PCs, which explain 57.1% of the total variance, show high association with differentiation day. (c) Dendrogram of hierarchical clustering of samples demonstrating that differentiation day but no other covariates (individual, Sex, batch) is driving the clustering of samples. (d) Violin plots of the variance explained by each of the covariates for each gene. Outlines represent the density of the percent of variance explained. The numbers are the median value of percent of explained variance for each variable. Boxplots in d show: center – median, lower hinge – 25% quantile, upper hinge – 75% quantile, lower whisker – smallest observation greater than or equal to lower hinge −1.5x interquartile range, upper whisker – largest observation less than or equal to upper hinge +1.5x interquartile range. n = 62 samples from 6 hiPSC lines derived from 5 individuals.
Extended Data Fig. 2
Extended Data Fig. 2. Cell stress in hCS.
(a) Trajectories of metabolic cell stress genes hCS (left) and in vivo (right). (b) In vitro and in vivo module eigen genes of glycolysis (organoid.Sloan.human.ME.paleturquoise) and ER stress (organoid.human.ME.darkred) previously suggested to be upregulated in vitro. Grey areas denote time of shift from prenatal to postnatal gene expression. In (a) and (b) shaded grey area around the trajectory represents the 95% confidence interval, vertical grey lines represent birth and vertical grey bars denote the shift from prenatal to postnatal gene expression based on matching to in vivo patterns. For in vitro data n = 62 samples from 6 hiPSC lines derived from 5 individuals and for in vivo data n = 196 from 24 individuals. (c) Scatterplot visualization of cells in in developing fetal cortex colored by major cell types. vRG, ventral radial glia; oRG, outer radial glia; CGE, caudal ganglionic eminence; MGE, medial ganglionic eminence; OPC, oligodendrocyte precursor cell; IP, intermediate progenitors.
Extended Data Fig. 3
Extended Data Fig. 3. Changes in biological processes between early and later stages of differentiation.
(a) Number of differentially expressed genes when comparing differentiation day 200 to differentiation day 25 (left) and differentiation day 400 to differentiation day 200 (right). Red bar represents up-regulated genes and the green bar represents down-regulated genes. (b) Top 3 up- and downregulated GO terms enriched in genes ranked by logFC using gene set enrichment analysis, (GSEA; FDR < 0.05). (c) Normalized expression of marker genes in vivo for neurons, intermediate progenitors, astrocytes, and radial glia as well as upper and deep layer cortical neurons. (d) Scaled expression of fetal and mature astroglial genes during differentiation. A shift between fetal and mature gene sets occurs at ~250 days of hCS differentiation. (e) Normalized expression of marker genes for inhibitory neurons and oligodendrocyte precursor cells (OPCs) that are not preserved in hCS. (f) Normalized expression of activity dependent genes that are not preserved in hCS. In (c), (e) and (f) shaded grey area around the trajectory represents the 95% confidence interval, vertical grey lines represent birth and vertical grey bars denote the shift from prenatal to postnatal gene expression based on matching to in vivo patterns. For in vitro data n = 62 samples from 6 hiPSC lines derived from 5 individuals and for in vivo data n = 196 from 24 individuals.
Extended Data Fig. 4
Extended Data Fig. 4. Overlap between hCS and in vivo WGCNA modules.
Overlap of genes in hCS and the BrainSpan in vivo modules. Significant ORs are presented. Modules were clustered using complete-linkage hierarchal clustering. Color represents the OR of each overlap. In vivo neuronal modules (green) and glial modules (purple) are marked.
Extended Data Fig. 5
Extended Data Fig. 5. Overlap between hCS and in vivo editing modules
(a) Overlap of editing sites in hCS and BrainSpan in vivo modules. Significant ORs are presented. (b) Distributions showing the closest distances between editing sites from BrainSpan editing modules and FMRP or FXR1P eCLIP peaks (blue). The median of 10,000 sets of control sites (black) is depicted for comparison. See Methods for details of P-value calculation. N, number of editing sites shown. (c) Overlap of editing sites within 1000bp of a CLIP site in hCS and BrainSpan in vivo modules. Significant ORs are presented. *** FDR < 0.005
Extended Data Fig. 6
Extended Data Fig. 6. Expression of select genes in the in-vivo fetal cortex.
(a) Immunohistochemistry of HDAC2 and the deep layer marker CTIP2 (BCL11B) at post conception week 21 (PCW21). CP, cortical plate. Scale bars, 100 μm. The Immunohistochemistry experiment was performed once. (b) Scatterplot visualization of cells in developing fetal human cerebral cortex colored by major cell types. vRG, ventral radial glia; oRG, outer radial glia; CGE, caudal ganglionic eminence; MGE, medial ganglionic eminence; OPC, oligodendrocyte precursor cell, IP, Intermediate progenitors.
Extended Data Fig. 7
Extended Data Fig. 7. Mapping neurodegenerative and epilepsy disorder genes onto hCS differentiation.
Mapping of genes associated with progressive supranuclear palsy (PSP) and frontotemporal dementia (FTD) (a), and epilepsy (b) onto hCS differentiation trajectories. The first column shows clustering of scaled normalized expression of genes associated with a disorder. Genes (in rows) are clustered using hierarchical clustering on the Euclidean distance between genes. Samples (columns) are ordered by differentiation day (represented by gray bars) with the earliest days on the left and latest time points on the right. The 5 most representative genes (highest correlation with the cluster eigengene) are shown. The second column shows the cluster eigengenes (first principal component) for the identified gene clusters. Shaded grey area around the trajectory line represents the 95% confidence interval. The third column shows the top GO terms enriched in the identified clusters. The fourth column shows cell types over expressed in either all the genes associated with a disorder (above line) or in the genes from the identified clusters. Number and color represent the fold change. Significance was tested using a one-sided permutation test with 100,000 permutations. P values were corrected for multiple testing using the Benjamini-Hochberg method. * FDR < 0.05, ** FDR < 0.01, *** FDR < 0.005. n = 62 samples from 6 hiPSC lines derived from 5 individuals.
Figure 1.
Figure 1.. Methylation and transcriptional maturation in long-term hCS
(a) The predicted methylation age (DNAmAge) of hCS is monotonically correlated with the in vitro differentiation day (r= +0.76, p = 1.57e−10, two-sided Pearson correlation test, n = 50 from 6 hiPSC lines derived from 5 individuals). Colors denote individual hiPSC lines. The shaded grey area represents the 95% confidence interval. (b) Scatter plot of the first two principal components (PC) of gene expression data. Color represents differentiation day and shape represents the hiPSC line. Numbers in brackets on axis titles are the percent of variance explained by the PC. (c) Spearman’s correlation of gene expression between samples from the same timepoint which were derived either from different individuals (red) or from the same individual (blue) (n = 62 samples from 6 hiPSC lines derived from 5 individuals).Boxplots show: center – median, lower hinge – 25% quantile, upper hinge – 75% quantile, lower whisker – smallest observation greater than or equal to lower hinge −1.5x interquartile range, upper whisker – largest observation less than or equal to upper hinge +1.5x interquartile range. (d) Transition mapping (TMAP) of gene expression of hCS (compared to differentiation day 25) and human primary tissue from the BrainSpan dataset (compared to stage 2). (e) BrainSpan stages and corresponding age. PCW – post conception weeks, M – months, Y – Years.
Figure 2.
Figure 2.. Biological processes and cell type marker changes in long-term hCS
(a) Normalized expression of marker genes for neurons, intermediate progenitors, astrocytes, and radial glia as well as upper and deep layer neurons. Neuronal and intermediate progenitor markers are initially expressed at high levels and decrease after day 250. Astrocyte markers increase in expression with time and peak after day 300. Radial glia markers decrease in expression as hCS advance in differentiation. (b) Immunohistochemistry of progenitors and neuronal markers at day 61 (d61; line 0524–1), day 201 (d201; line 8858–1) and day 328 (d328; line 2242–1) showing expression of GFAP in ventricular zone (VZ)–like regions and the deep and upper layer markers CTIP2 (also known as BCL11B) and BRN2 (also known as POU3F2). (c) Immunohistochemistry for the astrocyte markers GFAP and SOX9 at day 200 (d200; line 2242–1) and day 552 (d552; line 8858–1). Immunohistochemistry experiments were performed twice with similar results (1–3 hCS per line from at least 2 hiPSC lines were included). Scale bars, 50 μm (b-c) (d) Annotation of groups and GO term annotation of in vivo WGCNA modules performed by Stein et al. (e) Scaled mean expression of neuronal and glial module genes. The neuronal modules peaked at ~day 200; the glial modules decreased in expression until about differentiation day 150 and then increased in expression to peak around day 500. In (a) and (e) the shaded grey area around the trajectory line represents the 95% confidence interval and the vertical grey denotes the shift from prenatal to postnatal gene expression based on matching to in vivo patterns. In (a) and (e), n = 62 samples from 6 hiPSC lines derived from 5 individuals
Figure 3.
Figure 3.. RNA editing in hCS
(a) Trajectories of in vivo (BrainSpan) RNA editing modules. (b) Preservation scores (Z summary) of the in vivo RNA editing modules in hCS. (c) Trajectories of RNA editing enzymes in hCS (top) and in vivo from Brain Span (bottom). (d) Immunohistochemistry of the RNA editing regulator FXR1 with the glial and neuronal markers GFAP and CTIP2 (also known as BCL11B) at day 61 (d61; line 0524–1), at day 131 (d131; line 1205–4), at day 200 (d203; line1205–4), and at day 328 of differentiation (d328; line 2242–1). VZ - ventricular zone. Scale bars, 50 μm. Immunohistochemistry experiments were performed once for d61, twice for d131 and d203, and 3 times for d328 (1–3 hCS per line from at least 2 hiPSC lines were included) (e) Trajectories of the three hCS RNA editing modules. (f) Correlation of module eigenvalues with the expression of the major known RNA editing enzymes and regulators. (g) Distributions showing the closest distances between editing sites from hCS editing modules and FMRP or FXR1P eCLIP peaks (blue). The median of 10,000 sets of control sites (black) is depicted for comparison. See methods for details of permutation-based tow sided P-value calculation. N indicates the number of editing sites shown. *FDR, 0.05, ***FDR < 0.005. In (a), (c) and (e), the shaded grey area around the trajectory represents the 95% confidence interval, vertical grey lines represent birth and vertical grey bars denote the shift from prenatal to postnatal gene expression based on matching to in vivo patterns. In (c) top row and (e), n = 62 samples from 6 hiPSC lines derived from 5 individuals. In (a) and (c) bottom row, n = 196 from 24 individuals).
Figure 4.
Figure 4.. Developmental isoform switches in hCS
(a) Expression trajectories of histone deacetylase (HDAC) subunits. In vivo (right) and in vitro (left), HDAC2 expression decreases while the expression of both HDAC1 (top) and HDAC11 (bottom) increases. The shaded grey area around the trajectory line represents the 95% confidence interval. (b) Immunohistochemistry for HDAC2 and deep layer marker CTIP2 (also known as BCL11B) at day 61 (d61; line 0524–1) and day 131 (d131; line 1205–4). VZ, ventricular zone. Scale bars, 50 μm. Immunohistochemistry experiments were performed once for d61 or twice for d131 (1–3 hCS per line from at least 2 hiPSC lines were included). (c) Expression trajectories of NMDA receptor subunits. In vivo (right) and in vitro (left), GRIN2A (NR2A) and GRIN2B (NR2B) (top), as well as GRIN2C (NR2C) and GRIN2D (NR2D) (bottom). In (a) and (c), the shaded grey area around the trajectory represents the 95% confidence interval, vertical grey lines represent birth and vertical grey bars denote the shift from prenatal to postnatal gene expression based on matching to in vivo patterns. For in vitro data, n = 62 samples from 6 hiPSC lines derived from 5 individuals; for in vivo data, n = 196 from 24 individuals. (d) Western blots for GRIN2A, GRIN2B, Synpsin-1. β-actin was used as a loading control. The images shown were cropped (uncropped images are included in Source Data 1). Cell lines used are 1205–4 (samples 1, 2, 3, 4, 6, 8, 10, 11 and 13) and 0524–1 (samples 5, 7, 9 and 12). Western blot experiments were run 3 times with similar results. (e) Quantification of GRIN2A and GRIN2B protein levels from (d) (n = 13 from 2 hiPSC lines). (f) Average whole-cell voltage clamp recordings of NMDA responses (10 mM NMDA, 50 ms pulse) at early (red, days 54–156) and late (black, days 307–523) stages of hCS development. Standard error of the mean (SEM) are depicted by the grey and pink lines. Neurons were identified with a fluorescent reporter (Syn1::GFP). (g) Increased maximum NMDA response amplitudes over developmental time (r = 0.63, p = 6.94e−4). Black line represents the linear fit of the data. (h) Percent reduction of maximum NMDA responses by the NR2B-containing NMDA receptor blocker ifenprodil (IFN, 10 μM) is significantly reduced with time. Significance was measured using a beta regression with logit link function, B = −0.003, p = 1.58e−3. One cell was patched per hCS for a total of 25 cells from two hiPSC lines (8858–1, 1205–4).
Figure 5.
Figure 5.. Mapping neurodevelopmental and neuropsychiatric disorder genes onto hCS differentiation.
Mapping of genes associated with autism spectrum disorder (a), intellectual disability (b) and schizophrenia (c) onto hCS differentiation trajectories. The first column shows clustering of scaled normalized expression of genes associated with a disorder. Genes (in rows) are clustered using hierarchical clustering on the Euclidean distance between genes. Samples (columns) are ordered by differentiation day (represented by gray bars) with the earliest days on the left and latest time points on the right. The 5 most representative genes (highest correlation with the cluster eigengene) are shown. The second column shows the cluster eigengenes (first principal component) for the identified gene clusters. The shaded grey area around the trajectory line represents the 95% confidence interval. The third column shows the top GO-terms enriched in the identified clusters. The fourth column shows cell types over expressed in either all the genes associated with a disorder (above line) or in the genes from the identified clusters. Number and color represent the fold change. Significance was tested using a one-sided permutation test with 100,000 permutations. P values were corrected for multiple testing using the Benjamini-Hochberg method. * FDR < 0.05, ** FDR < 0.01, *** FDR < 0.005, n = 62 samples from 6 hiPSC lines derived from 5 individuals.
Figure 6.
Figure 6.. Mapping neurodegenerative disorder genes onto hCS differentiation.
Mapping of genes associated with Alzheimer’s disease (a) and Parkinson’s disease (b) onto hCS differentiation. The first column shows clustering of scaled normalized expression of genes associated with a disorder. Genes (in rows) are clustered using hierarchical clustering on the Euclidean distance between genes. Samples (columns) are ordered by differentiation day (represented by gray bars) with the earliest days on the left and latest time points on the right. The 5 most representative genes (highest correlation with the cluster eigengene) and genes associated with familial forms of the disease are shown. *, Familial gene; ^, Familial gene that is also a hub gene. The second column is the cluster eigengenes (first principal component) for the identified gene clusters. The shaded grey area around the trajectory line represents the 95% confidence interval. The third column is the top GO-terms enriched in the identified clusters. The fourth column is cell types over expressed in either all the genes associated with a disorder (above line) or in the genes from the identified clusters. Number and color represent the fold change. Significance was tested using a one-sided permutation test with 100,000 permutations. P values were corrected for multiple testing using the Benjamini-Hochberg method. * FDR < 0.05, ** FDR < 0.01, *** FDR < 0.005. n = 62 samples from 6 hiPSC lines derived from 5 individuals.

Similar articles

Cited by

References

    1. Pasca SP The rise of three-dimensional human brain cultures. Nature 553, 437–445 (2018). - PubMed
    1. Mertens J, Marchetto MC, Bardy C & Gage FH Evaluating cell reprogramming, differentiation and conversion technologies in neuroscience. Nat Rev Neurosci 17, 424–437 (2016). - PMC - PubMed
    1. Lancaster MA, et al. Cerebral organoids model human brain development and microcephaly. Nature 501, 373–379 (2013). - PMC - PubMed
    1. Qian X, et al. Brain-Region-Specific Organoids Using Mini-bioreactors for Modeling ZIKV Exposure. Cell 165, 1238–1254 (2016). - PMC - PubMed
    1. Pasca AM, et al. Functional cortical neurons and astrocytes from human pluripotent stem cells in 3D culture. Nat Methods 12, 671–678 (2015). - PMC - PubMed

Publication types

MeSH terms