[Preprint]. 2021 Feb 15:rs.3.rs-235272.
doi: 10.21203/rs.3.rs-235272/v1.

COVA1-18 neutralizing antibody protects against SARS-CoV-2 in three preclinical models

Affiliations

COVA1-18 neutralizing antibody protects against SARS-CoV-2 in three preclinical models

P Maisonnasse et al. Res Sq. .

Update in

  • COVA1-18 neutralizing antibody protects against SARS-CoV-2 in three preclinical models.
    Maisonnasse P, Aldon Y, Marc A, Marlin R, Dereuddre-Bosquet N, Kuzmina NA, Freyn AW, Snitselaar JL, Gonçalves A, Caniels TG, Burger JA, Poniman M, Bontjer I, Chesnais V, Diry S, Iershov A, Ronk AJ, Jangra S, Rathnasinghe R, Brouwer PJM, Bijl TPL, van Schooten J, Brinkkemper M, Liu H, Yuan M, Mire CE, van Breemen MJ, Contreras V, Naninck T, Lemaître J, Kahlaoui N, Relouzat F, Chapon C, Ho Tsong Fang R, McDanal C, Osei-Twum M, St-Amant N, Gagnon L, Montefiori DC, Wilson IA, Ginoux E, de Bree GJ, García-Sastre A, Schotsaert M, Coughlan L, Bukreyev A, van der Werf S, Guedj J, Sanders RW, van Gils MJ, Le Grand R. Maisonnasse P, et al. Nat Commun. 2021 Oct 20;12(1):6097. doi: 10.1038/s41467-021-26354-0. Nat Commun. 2021. PMID: 34671037 Free PMC article.

Abstract

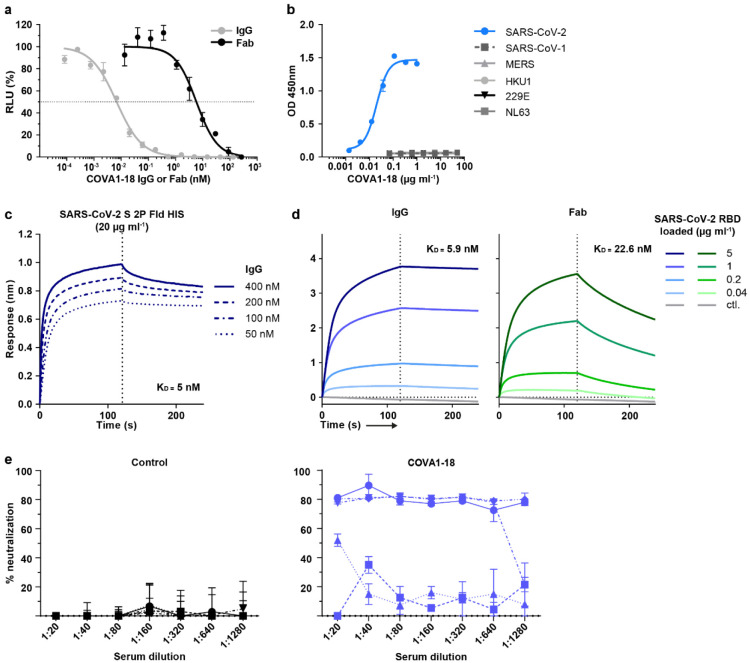
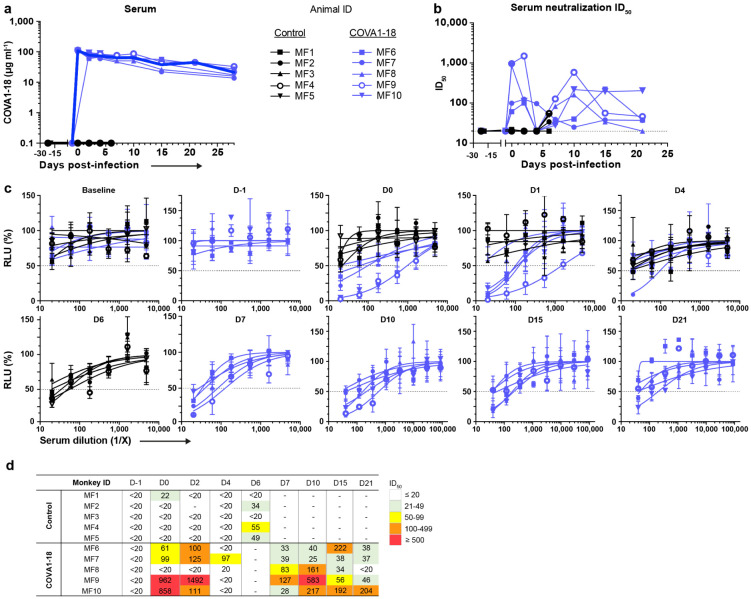
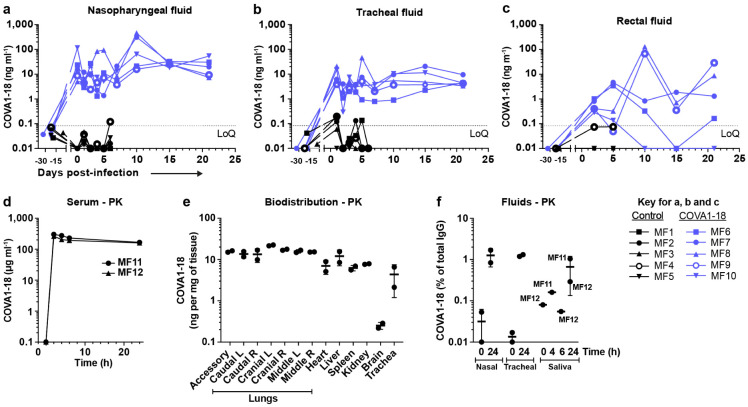
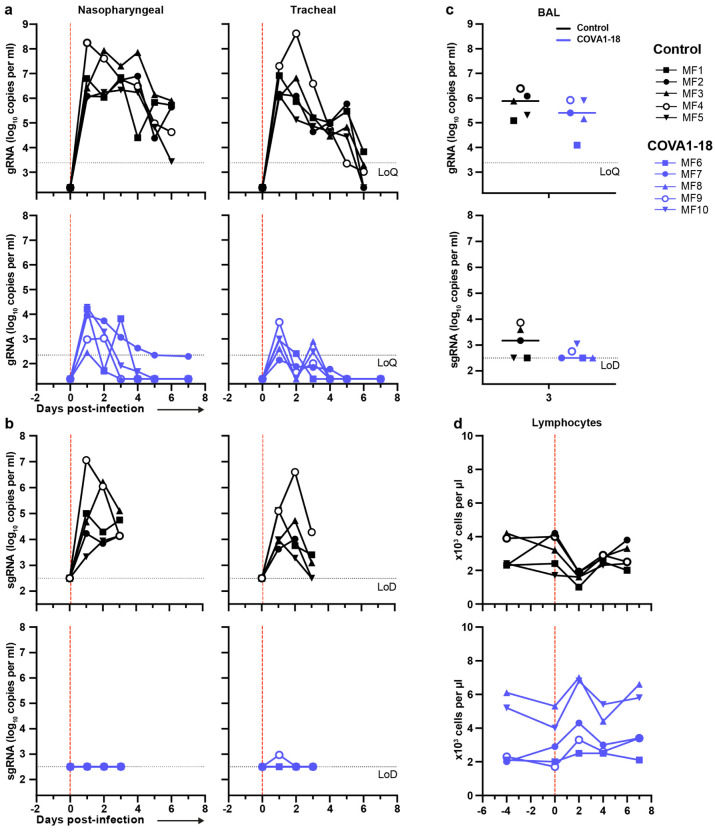
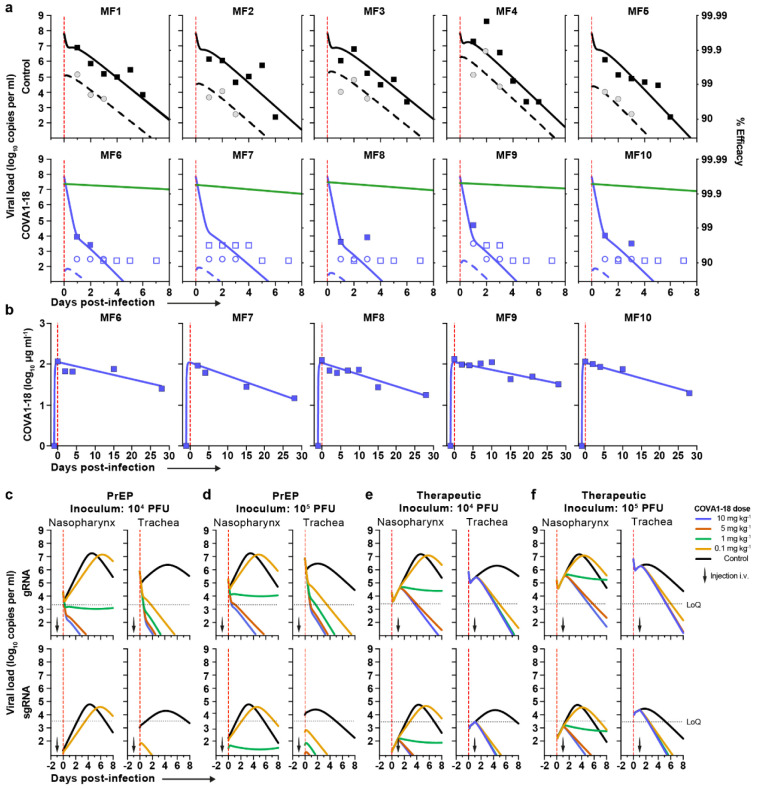
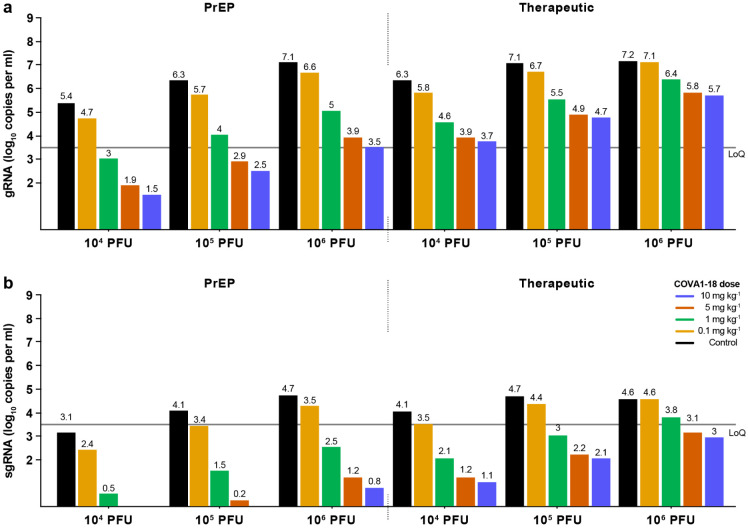
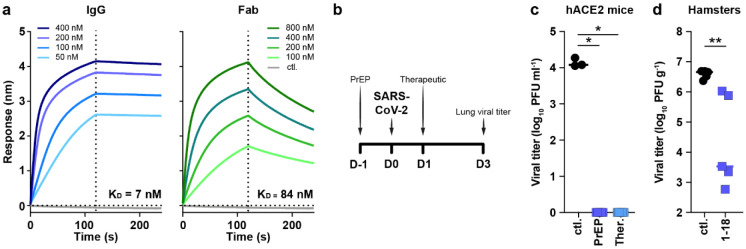
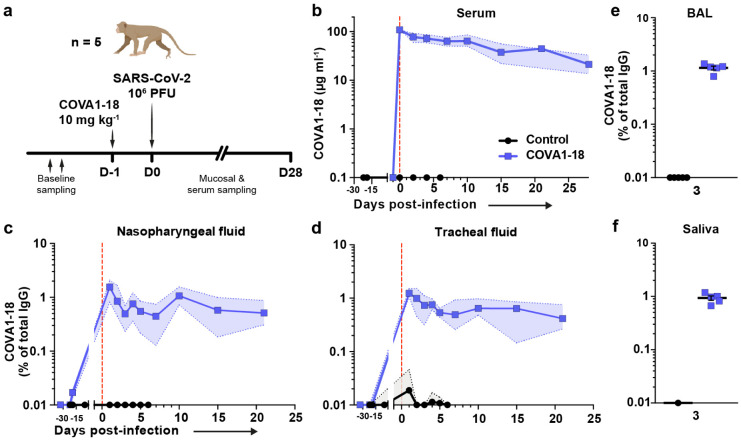
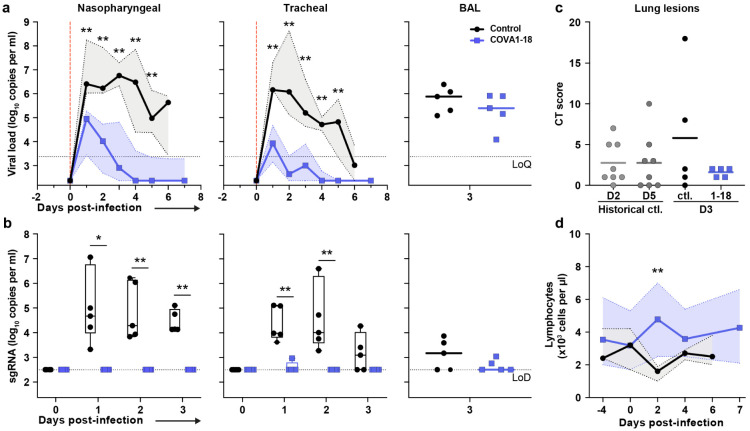
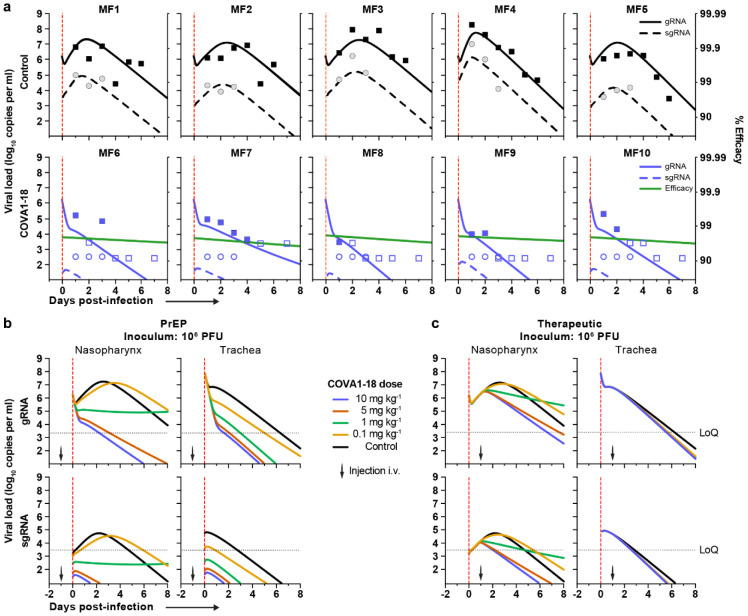
One year into the Coronavirus Disease 2019 (COVID-19) pandemic caused by Severe Acute Respiratory Syndrome coronavirus 2 (SARS-CoV-2), effective treatments are still needed 1-3 . Monoclonal antibodies, given alone or as part of a therapeutic cocktail, have shown promising results in patients, raising the hope that they could play an important role in preventing clinical deterioration in severely ill or in exposed, high risk individuals 4-6 . Here, we evaluated the prophylactic and therapeutic effect of COVA1-18 in vivo , a neutralizing antibody isolated from a convalescent patient 7 and highly potent against the B.1.1.7. isolate 8,9 . In both prophylactic and therapeutic settings, SARS-CoV-2 remained undetectable in the lungs of COVA1-18 treated hACE2 mice. Therapeutic treatment also caused a dramatic reduction in viral loads in the lungs of Syrian hamsters. When administered at 10 mg kg - 1 one day prior to a high dose SARS-CoV-2 challenge in cynomolgus macaques, COVA1-18 had a very strong antiviral activity in the upper respiratory compartments with an estimated reduction in viral infectivity of more than 95%, and prevented lymphopenia and extensive lung lesions. Modelling and experimental findings demonstrate that COVA1-18 has a strong antiviral activity in three different preclinical models and could be a valuable candidate for further clinical evaluation.


Figures

Extended Data Figure 1.
Extended Data Figure 1.. COVA1-18 IgG and Fab neutralization, cross-reactivity, binding kinetic and Syrian hamster serum neutralization.
(a) IgG (grey) and Fab (black) pseudotype particle neutralization curves for COVA1-18. Representative of n ≥ 4 independent experiments. (b) Antigen specificity of COVA1-18 was assessed by ELISA against the soluble S protein derived from different human coronaviruses. (c) BLI sensorgrams of COVA1-18 binding to immobilized soluble SARS-CoV-2 S protein. Representative of n ≥ 2 independent experiments. (d) BLI sensorgrams of COVA1-18 binding to SARS-CoV-2 RBD loaded onto the sensor chip at various concentrations (n = 1). (e) Serum neutralization potency at 3 d.p.i. in Syrian hamsters for the control group (left) and COVA1-18 treated group (n = 5 animals per group).
Extended Data Figure 2.
Extended Data Figure 2.. Serum and mucosal pharmacokinetics of COVA1-18 in treated macaques (1/2).
(a) Serum COVA1-18 concentration for each animal. The mean COVA-18 concentration for each group is indicated by a thick blue line (treated animals) and a thick black line (control). (b) Individual serum neutralization ID50. (c) Serum neutralization curve for each animal at the indicated day post-treatment. (d) Individual serum neutralization ID50 with titer range indicated as ID50 21-49 in green, 50-99 in yellow, 100-499 in orange, >500 red.
Extended Data Figure 3.
Extended Data Figure 3.. Serum and mucosal pharmacokinetics of COVA1-18 in treated macaques (2/2).
The COVA1-18 concentrations measured in nasopharyngeal (a), tracheal (b) and rectal (c) fluids by ELISA are reported for each animal in both groups. (d) Serum COVA1-18 concentration from two animals injected with 10 mg kg−1 of COVA1-18 and sampled at 0, 2, 4, 6 and 24 h for a pharmacokinetic (PK) study. (e) The two macaques were euthanized at 24 h post-treatment and organs analyzed to assess the biodistribution of COVA1-18. The concentration of COVA1-18 was normalized to the weight of each sample for every organ. (f) COVA1-18 was measured in fluid samples of the PK study animals and normalized to the total cynomolgus IgG content for each sample. LoQ, limit of quantification.
Extended Data Figure 4.
Extended Data Figure 4.. COVA1-18 pre-exposure prophylaxis protects cynomolgus monkeys against SARS-CoV-2 challenge and clinical symptoms.
(a) Genomic (g)RNA and (b) subgenomic (sg)RNA loads determined by PCR in nasopharyngeal fluids (left) and tracheal fluids (right) of control (top) and treated (bottom) animals. (c) gRNA (top) and sgRNA (bottom) in the bronchoalveolar lavages (BAL) at day 3 post-infection. (d) Absolute lymphocyte count in the blood of control (top) and treated (bottom) animals. LoD, limit of detection; LoQ, limit of quantification.
Extended Data Figure 5.
Extended Data Figure 5.. Sequences in treated and exposed NHP.
Viral population sequences in the nasopharyngeal swabs at day 3 were analyzed by Next Generation Sequencing. (a) Variants count detected in the N and ORF1ab genes for each individual (left) and cumulative variants count for each gene in the control and COVA1-18 treated groups (right). (b) Individual (left) and cumulative (right) synonymous and missense variants count for the control and treated groups. (c) Nucleotide substitution observed by type for both groups.
Extended Data Figure 6.
Extended Data Figure 6.. Modeling of viral dynamics and treatment efficacy (1/2).
(a) Individual prediction of the tracheal gRNA and sgRNA in control (top) and treated animals (bottom) with individual efficacy prediction indicated (green line). The dashed red line indicates the time of viral infection. gRNA (squares) and sgRNA (circles) data are indicated as plain (above LoQ) or open (below LoQ). (b) Individual prediction of the COVA1-18 plasma concentration. (c-d) Simulation of the predicted gRNA (top) and sgRNA (bottom) viral loads in the nasopharynx and trachea for a 104 and 105 PFU challenge dose according to the dose of COVA1-18 given 24 h prior challenge (arrow). (e-f) Simulation as in (c) with COVA1-18 given 24 h post-infection. Black dotted lines indicate the limit of quantification (LoQ). i.v., intravenous; PFU, plaque forming units. PrEP, Pre-Exposure Prophylaxis.
Extended Data Figure 7.
Extended Data Figure 7.. Modeling of viral dynamics and treatment efficacy (2/2).
Simulation of the predicted gRNA (top) and sgRNA (bottom) viral loads in the nasopharynx, according to the dose of COVA1-18 received and the dose of virus received. Left: Pre-Exposure Prophylaxis (PrEP) treatment at −1 d.p.i., viral load measured at 2 d.p.i.; Right: Therapeutic treatment at 1 d.p.i., viral load measured at 3 d.p.i. Black: control; yellow: 0.1 mg kg−1; green: 1 mg kg−1: orange: 5 mg kg−1; blue: 10 mg kg−1. LoQ, limit of quantification.
Figure 1.
Figure 1.. COVA1-18 avidity and SARS-CoV-2 protection in rodents.
(a) Biolayer interferometry sensorgrams comparing COVA1-18 IgG and Fab binding to RBD. KDs are indicated. Representative of 3 independent experiments. (b) Study design with n = 5 per group, except mouse control group (n = 3). Hamsters were infected with 105 PFU on day 0 and treated on day 1. Mice received COVA1-18 24 h prior to or after exposure to 104 PFU. Lung viral titers at 3 d.p.i. are shown for mice (c) and hamsters (d). Bars indicate medians. Mann-Whitney unpaired t-test, p values: *<0.05, **<0.01. Ctl., control group; PrEP, pre-exposure prophylaxis; Ther., therapeutic.
Figure 2.
Figure 2.. COVA1-18 serum and mucosal pharmacokinetic in infected cynomolgus macaques.
(a) Study design. Two groups of n = 5 were exposed to 106 PFU of SARS-CoV-2 (intranasal and intratracheal routes). Treated animals received 10 mg kg−1 of COVA1-18 1 day before challenge. (b) COVA1-18 serum concentration (mean with range). COVA1-18 concentration reported as percent of total cynomolgus IgG in heat-inactivated (c) nasopharyngeal fluid, (d) tracheal fluid (means with range), (e) bronchoalveolar lavage (BAL) and (f) saliva (means ± SEMs). The red dashed line indicates challenge day.
Figure 3.
Figure 3.. COVA1-18 pre-exposure prophylaxis protects cynomolgus monkeys against SARS-CoV-2 challenge and clinical symptoms.
(a) Genomic (g)RNA and (b) subgenomic (sg)RNA loads determined by PCR in nasopharyngeal fluids (left), tracheal fluids (middle) and bronchoalveolar lavages (BAL) (right). Medians with range are indicated for fluids and bars represent medians for BAL. (c) Chest CT scores were determined at 3 d.p.i. and at 2 or 5 d.p.i for historical controls. (d) Absolute lymphocyte count in the blood (mean with range). Mann-Whitney unpaired t-test, p values: * < 0.05, ** < 0.01. Ctl., control group; LoD, limit of detection; LoQ, limit of quantification.
Figure 4.
Figure 4.. Modeling of viral dynamics and treatment efficacy.
(a) Individual prediction of the nasopharyngeal gRNA and sgRNA in control (top) and treated animals (bottom) with individual efficacy prediction indicated (green line). The dashed red line indicates the time of infection. gRNA (squares) and sgRNA (circles) data are indicated as plain (above LoQ) or open (below LoQ). (b) Model predictions of gRNA and sgRNA dynamics with 4 doses of COVA1-18 given 24 h prior to challenge (arrow). (c) Simulation as in (b) with COVA1-18 given 24 h post-infection. Black dotted lines indicate LoQ (limit of quantification); i.v., intravenous; PFU, plaque forming units.

References

Main references

    1. Salama C. et al. Tocilizumab in Patients Hospitalized with Covid-19 Pneumonia. N. Engl. J. Med. (2020) doi:10.1056/nejmoa2030340 - DOI - PubMed
    1. Horby P. et al. Effect of Dexamethasone in Hospitalized Patients with COVID-19: Preliminary Report. N. Engl. J. Med. (2020) doi:10.1101/2020.06.22.20137273 - DOI
    1. Update to living WHO guideline on drugs for covid-19. BMJ (2020) doi:10.1136/bmj.m4475 - DOI - PubMed
    1. Weinreich D. M. et al. REGN-COV2, a Neutralizing Antibody Cocktail, in Outpatients with Covid-19. N. Engl. J. Med. 384, (2021). - PMC - PubMed
    1. Chen P. et al. SARS-CoV-2 Neutralizing Antibody LY-CoV555 in Outpatients with Covid-19. N. Engl. J. Med. 384, (2021). - PMC - PubMed

Methods references

    1. Liu H. et al. Cross-Neutralization of a SARS-CoV-2 Antibody to a Functionally Conserved Site Is Mediated by Avidity. Immunity 53, 1272–1280.e5 (2020). - PMC - PubMed
    1. Lescure F. X. et al. Clinical and virological data of the first cases of COVID-19 in Europe: a case series. Lancet Infect. Dis. 20, 697–706 (2020). - PMC - PubMed
    1. Corman V. M. et al. Detection of 2019 novel coronavirus (2019-nCoV) by real-time RT-PCR. Eurosurveillance 25, (2020). - PMC - PubMed
    1. Wölfel R. et al. Virological assessment of hospitalized patients with COVID-2019. Nature 581, 465–469 (2020). - PubMed
    1. Pan F. et al. Time course of lung changes at chest CT during recovery from Coronavirus disease 2019 (COVID-19). Radiology 295, 715–721 (2020). - PMC - PubMed

Publication types

LinkOut - more resources