[Preprint]. 2021 Jun 29:2021.02.18.431844.
doi: 10.1101/2021.02.18.431844.

Predicting the zoonotic capacity of mammals to transmit SARS-CoV-2

Affiliations

Predicting the zoonotic capacity of mammals to transmit SARS-CoV-2

Ilya R Fischhoff et al. bioRxiv. .

Update in

Abstract

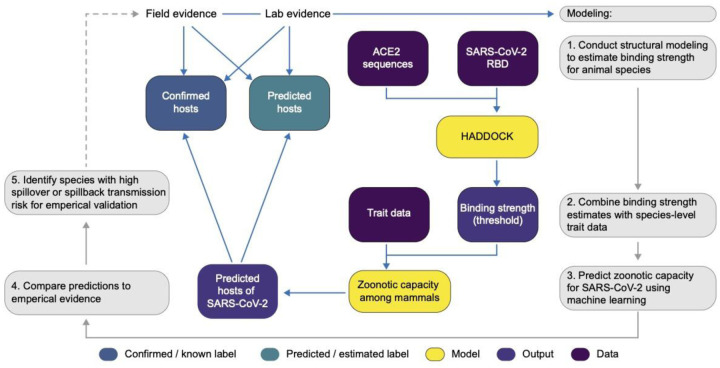
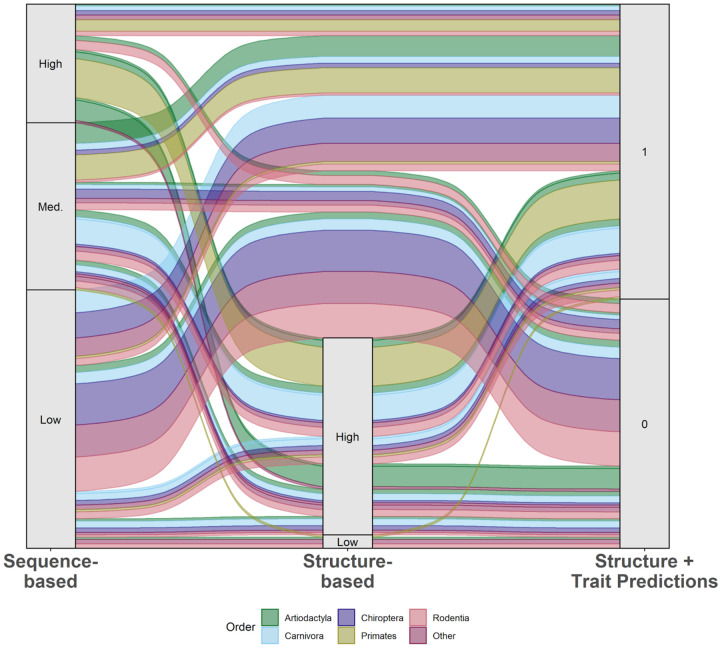
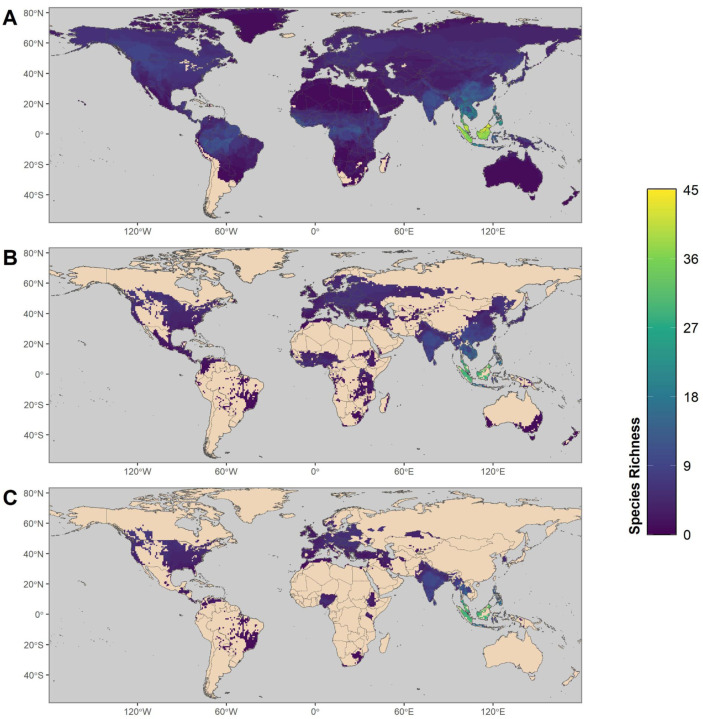
Back and forth transmission of SARS-CoV-2 between humans and animals may lead to wild reservoirs of virus that can endanger efforts toward long-term control of COVID-19 in people, and protecting vulnerable animal populations that are particularly susceptible to lethal disease. Predicting high risk host species is key to targeting field surveillance and lab experiments that validate host zoonotic potential. A major bottleneck to predicting animal hosts is the small number of species with available molecular information about the structure of ACE2, a key cellular receptor required for viral cell entry. We overcome this bottleneck by combining species' ecological and biological traits with 3D modeling of virus and host cell protein interactions using machine learning methods. This approach enables predictions about the zoonotic capacity of SARS-CoV-2 for over 5,000 mammals - an order of magnitude more species than previously possible. The high accuracy predictions achieved by this approach are strongly corroborated by in vivo empirical studies. We identify numerous common mammal species whose predicted zoonotic capacity and close proximity to humans may further enhance the risk of spillover and spillback transmission of SARS-CoV-2. Our results reveal high priority areas of geographic overlap between global COVID-19 hotspots and potential new mammal hosts of SARS-CoV-2. With molecular sequence data available for only a small fraction of potential host species, predictive modeling integrating data across multiple biological scales offers a conceptual advance that may expand our predictive capacity for zoonotic viruses with similarly unknown and potentially broad host ranges.

Keywords: ACE2; COVID-19; coronavirus; ecological traits; homology modelling; hosts; machine learning; reservoirs; spillback; spillover; susceptibility; zoonotic.


Conflict of interest statement

Competing interests The authors declare no competing interests.

Figures

Figure 1.
Figure 1.
A heatmap summarizing predicted susceptibility to SARS-CoV-2 for species with confirmed infection from in vivo experimental studies or from documented natural infections. Studies that make predictions about species susceptibility are shown on the x-axis, organized by method of prediction (those relying on ACE2 sequences, estimating binding strength using three dimensional structures, or laboratory experiments). Predictions about zoonotic capacity from this study are listed in the second to last column, with high and low categories determined by zoonotic capacity observed in Felis catus. Confirmed infections for species along the y-axis are summarized in and are depicted as a series of filled or unfilled circles. Bolded species have been experimentally confirmed to transmit SARS-CoV-2 to naive conspecifics. Species predictions range from warmer colors (yellow: low susceptibility or zoonotic capacity for SARS-CoV-2) to cooler colors (purple: high susceptibility or zoonotic capacity). See Supplementary Methods (https://doi.org/10.25390/caryinstitute.c.5293339) for detailed methods about study categorization.
Figure 2.
Figure 2.
A flowchart showing the progression of our workflow combining evidence from limited lab and field studies with additional data types to predict zoonotic capacity across mammals through multi-scale statistical modeling (gray boxes, steps 1–5). For all vertebrates with published ACE2 sequences, we modelled the interface of species’ ACE2 bound to the viral receptor binding domain using HADDOCK. We then combined the HADDOCK scores, which approximate binding strength, with species’ trait data and trained machine learning models for both mammals and vertebrates (yellow boxes). Mammal species predicted to have high zoonotic capacity were then compared to results of in vivo experiments and in silico studies that applied various computational approaches. Based on predictions from our model, we identified a subset of species with particularly high risk of spillback and secondary spillover potential to prioritize additional lab validation and field surveillance (dashed line).
Figure 3.
Figure 3.
Plots showing results from modeling species’ ACE2 interaction with SARS-CoV-2 RBD using HADDOCK to predict binding strength (measured as arbitrary units). HADDOCK scores that predict stronger binding are more negative. The mean and standard deviation of the HADDOCK score for vertebrate species (A) for which ACE2 orthologs are available. Binding strengths vary across vertebrate classes (B) and across the five most speciose mammalian orders (C). The “Other” category contains species across multiple orders for which ACE2 sequences were available, each with fewer than 10 representative species in the order. The shaded regions of all panels represent predicted binding that is as strong or stronger than (more negative values than) the domestic cat (Felis catus), which represents our conservative zoonotic capacity threshold based on currently available empirical evidence.
Figure 4.
Figure 4.
Ridgeline plots showing the distribution of predicted zoonotic capacity across mammals. Predicted probabilities for zoonotic capacity across the x-axis range from 0 (likely not susceptible) to 1 (zoonotic capacity predicted to be the same or greater than Felis catus), with the vertical line representing 0.5. The y-axis depicts all mammalian orders represented by our predictions. Density curves represent the distribution of the predictions, with those parts of the curve over 0.5 colored pink and lines representing distribution quartiles. The predicted values for each order are shown as points below the density curves. Points that were used to train the model are colored: orange represents species with weaker predicted binding, blue represents species with stronger predicted binding. Selected family-level distributions are shown in the Supplemental Figures 5–6 (https://doi.org/10.25390/caryinstitute.c.5293339).
Figure 5.
Figure 5.
An alluvial plot comparing predictions of species susceptibility from multiple methods. Existing studies (listed in Supplementary Methods) are categorized as either sequence-based or structure-based. Predictions from our zoonotic capacity model result from combining structure-based modeling of viral binding with organismal traits using machine learning to distinguish species with zoonotic capacity above (1) or below (0) a conservative threshold value set by domestic cats (Felis catus). Colors represent unique mammalian orders, and the width of colored bands represent the relative number of species with that combination of predictions across methods. See Supplementary Methods (https://doi.org/10.25390/caryinstitute.c.5293339) for details on how species across multiple studies were assigned to categories (high, medium, low).
Figure 6:
Figure 6:
Maps showing the global distribution of species with predicted capacity to transmit SARS-CoV-2. (A) depicts global species richness of the top 10 percent of model-predicted zoonotic capacity. Geographic ranges of this subset of species were filtered to those associated with human-dominated or human-altered habitats (B), and further filtered to show the subset of species that overlaps with areas of high human SARS-CoV-2 positive case counts (over 100,000 cumulative cases as of 17 May 2021) (C). For a full list of model-predicted zoonotic capacity of species by country, see Supplementary File 2 (https://doi.org/10.25390/caryinstitute.c.5293339).

Similar articles

References

    1. Dong E., Du H. & Gardner L. An interactive web-based dashboard to track COVID-19 in real time. Lancet Infect. Dis. 20, 533–534 (2020). - PMC - PubMed
    1. WHO. WHO coronavirus disease (COVID-19) dashboard. (2021).
    1. Keele B. F. et al. Chimpanzee reservoirs of pandemic and nonpandemic HIV-1. Science 313, 523–526 (2006). - PMC - PubMed
    1. Gage K. L. & Kosoy M. Y. Natural history of plague: perspectives from more than a century of research. Annu. Rev. Entomol. 50, 505–528 (2005). - PubMed
    1. Taubenberger J. K. et al. Characterization of the 1918 influenza virus polymerase genes. Nature 437, 889 (2005). - PubMed

Publication types

LinkOut - more resources