[Preprint]. 2021 Feb 20:2021.02.20.431155.
doi: 10.1101/2021.02.20.431155.

Impaired local intrinsic immunity to SARS-CoV-2 infection in severe COVID-19

Affiliations

Impaired local intrinsic immunity to SARS-CoV-2 infection in severe COVID-19

Carly G K Ziegler et al. bioRxiv. .

Update in

  • Impaired local intrinsic immunity to SARS-CoV-2 infection in severe COVID-19.
    Ziegler CGK, Miao VN, Owings AH, Navia AW, Tang Y, Bromley JD, Lotfy P, Sloan M, Laird H, Williams HB, George M, Drake RS, Christian T, Parker A, Sindel CB, Burger MW, Pride Y, Hasan M, Abraham GE 3rd, Senitko M, Robinson TO, Shalek AK, Glover SC, Horwitz BH, Ordovas-Montanes J. Ziegler CGK, et al. Cell. 2021 Sep 2;184(18):4713-4733.e22. doi: 10.1016/j.cell.2021.07.023. Epub 2021 Jul 23. Cell. 2021. PMID: 34352228 Free PMC article.

Abstract

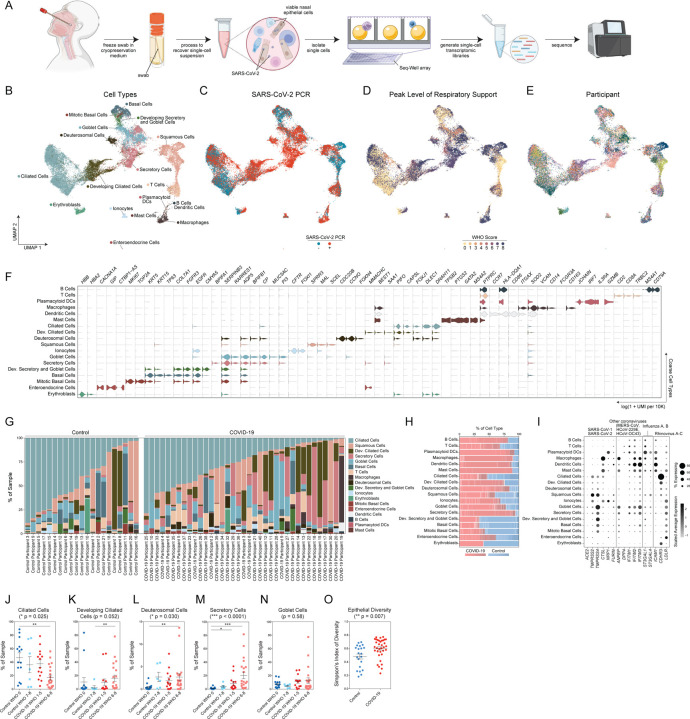
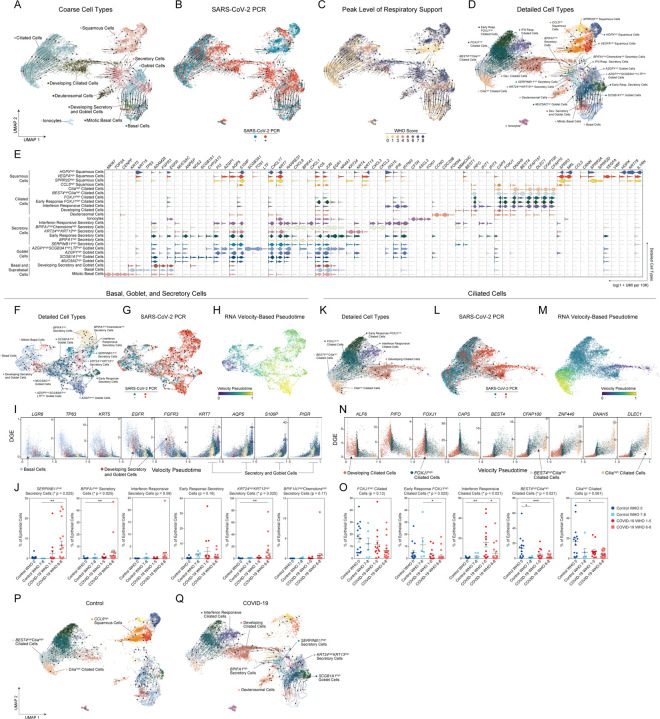
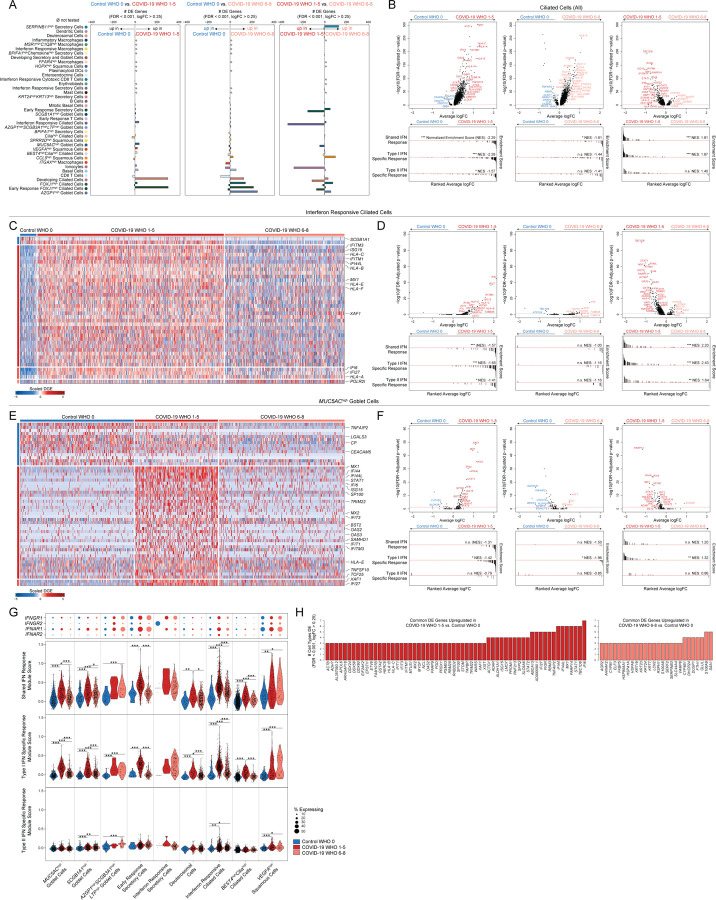
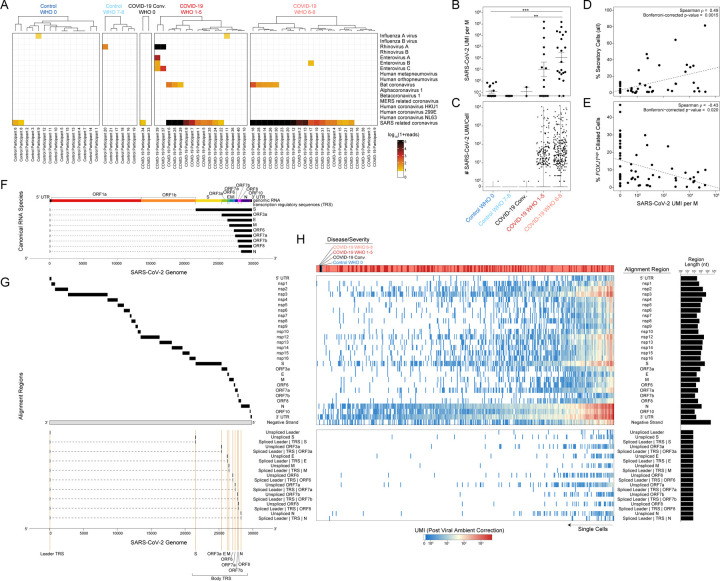
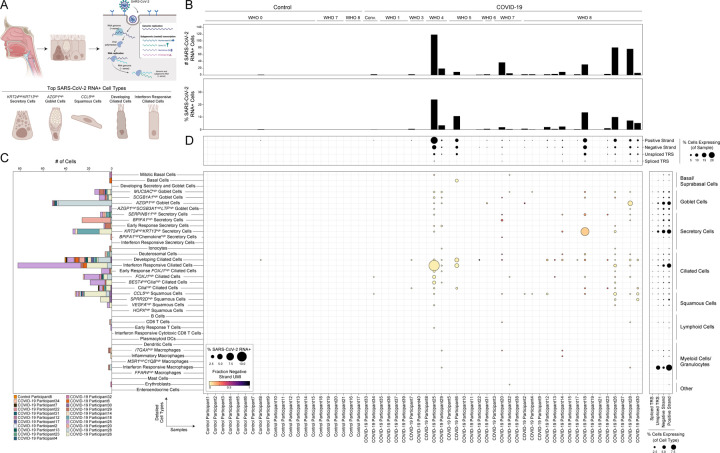
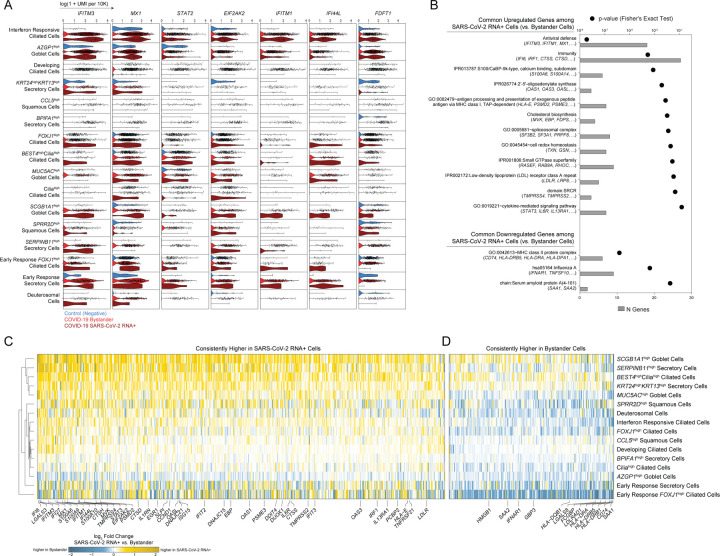
Infection with SARS-CoV-2, the virus that causes COVID-19, can lead to severe lower respiratory illness including pneumonia and acute respiratory distress syndrome, which can result in profound morbidity and mortality. However, many infected individuals are either asymptomatic or have isolated upper respiratory symptoms, which suggests that the upper airways represent the initial site of viral infection, and that some individuals are able to largely constrain viral pathology to the nasal and oropharyngeal tissues. Which cell types in the human nasopharynx are the primary targets of SARS-CoV-2 infection, and how infection influences the cellular organization of the respiratory epithelium remains incompletely understood. Here, we present nasopharyngeal samples from a cohort of 35 individuals with COVID-19, representing a wide spectrum of disease states from ambulatory to critically ill, as well as 23 healthy and intubated patients without COVID-19. Using standard nasopharyngeal swabs, we collected viable cells and performed single-cell RNA-sequencing (scRNA-seq), simultaneously profiling both host and viral RNA. We find that following infection with SARS-CoV-2, the upper respiratory epithelium undergoes massive reorganization: secretory cells diversify and expand, and mature epithelial cells are preferentially lost. Further, we observe evidence for deuterosomal cell and immature ciliated cell expansion, potentially representing active repopulation of lost ciliated cells through coupled secretory cell differentiation. Epithelial cells from participants with mild/moderate COVID-19 show extensive induction of genes associated with anti-viral and type I interferon responses. In contrast, cells from participants with severe lower respiratory symptoms appear globally muted in their anti-viral capacity, despite substantially higher local inflammatory myeloid populations and equivalent nasal viral loads. This suggests an essential role for intrinsic, local epithelial immunity in curbing and constraining viral-induced pathology. Using a custom computational pipeline, we characterized cell-associated SARS-CoV-2 RNA and identified rare cells with RNA intermediates strongly suggestive of active replication. Both within and across individuals, we find remarkable diversity and heterogeneity among SARS-CoV-2 RNA+ host cells, including developing/immature and interferon-responsive ciliated cells, KRT13+ "hillock"-like cells, and unique subsets of secretory, goblet, and squamous cells. Finally, SARS-CoV-2 RNA+ cells, as compared to uninfected bystanders, are enriched for genes involved in susceptibility (e.g., CTSL, TMPRSS2) or response (e.g., MX1, IFITM3, EIF2AK2) to infection. Together, this work defines both protective and detrimental host responses to SARS-CoV-2, determines the direct viral targets of infection, and suggests that failed anti-viral epithelial immunity in the nasal mucosa may underlie the progression to severe COVID-19.


Conflict of interest statement

DECLARATION OF INTERESTS A.K.S. reports compensation for consulting and/or SAB membership from Merck, Honeycomb Biotechnologies, Cellarity, Repertoire Immune Medicines, Hovione, Ochre Bio, and Dahlia Biosciences. J.O.M. reports compensation for consulting services with Cellarity and Hovione.

Figures

Figure 1.
Figure 1.. Cellular Composition of Human Nasopharyngeal Mucosa
A. Schematic of method for viable cryopreservation of nasopharyngeal swabs, cellular isolation, and scRNA-seq using Seq-Well S3 (created with BioRender). B. UMAP of 32,588 single-cell transcriptomes from all participants, colored by cell type (following iterative Louvain clustering). C. UMAP as in B, colored by SARS-CoV-2 diagnostic PCR status. D. UMAP as in B, colored by peak level of respiratory support (WHO COVID-19 severity scale). E. UMAP as in B, colored by participant. F. Violin plots (log(1+normalized UMI per 10k)) of cluster marker genes (FDR < 0.01) for coarse cell type annotations (as in B). G. Proportional abundance of coarse cell types by participant (ordered within each group by increasing ciliated cell abundance). H. Proportional abundance of participants by coarse cell types. Shades of red: COVID-19. Shades of blue: Control. I. Expression of entry factors for SARS-CoV-2 and other common upper respiratory viruses. Dot size represents fraction of cell type (rows) expressing a given gene (columns). Dot hue represents scaled average expression by gene column. J. Proportion of ciliated cells by sample. Statistical test above graph represents Kruskal-Wallis test results across all groups (following FDR correction across cell types). Statistical significance asterisks within box represent results from Dunn’s post-hoc testing. * p < 0.05, ** p < 0.01, *** p < 0.001. K. Proportion of developing ciliated cells by sample. L. Proportion of deuterosomal cells by sample. M. Proportion of secretory cells by sample. N. Proportion of goblet cells by sample. O. Simpson’s Diversity index (plotted as 1-D, where increasing values represent higher diversity) across epithelial cell types in COVID-19 vs. Control. Significance by student’s t-test. Lines represent mean and S.E.M. See also Figure S1, Table S1
Figure 2.
Figure 2.. Altered Epithelial Cell Composition in the Nasopharynx During COVID-19
A. UMAP of 28,948 epithelial cell types following re-clustering, colored by coarse cell types. Arrows represent smoothed estimate of cellular differentiation trajectories B. UMAP as in A, colored by SARS-CoV-2 diagnostic PCR status. C. UMAP as in A, colored by peak level of respiratory support (WHO illness severity scale). D. UMAP as in A, colored by detailed cell types resolved by iterative re-clustering. E. Violin plots (log(1+normalized UMI per 10k)) of marker genes (FDR < 0.01) for detailed epithelial cell type annotations (as in D). F. UMAP of 9,209 basal, goblet, and secretory cells, following sub-clustering and resolution of detailed cell annotations. G. UMAP of only basal, goblet, and secretory cells as in F, colored by SARS-CoV-2 diagnostic PCR status. H. UMAP of only basal, goblet, and secretory cells as in F, colored by inferred velocity pseudotime (darker blue shades: precursor cells, intense yellow shades: more terminally differentiated cell types) I. Plot of gene expression by basal, goblet, and secretory cell velocity pseudotime for select genes (all significantly correlated with velocity expression). Points colored by detailed cell type annotations. J. Proportion of secretory cell subtypes (detailed annotation) by sample, normalized to all epithelial cells. Statistical test above graph represents Kruskal-Wallis test results across all groups (following FDR correction). Statistical significance asterisks within box represent results from Dunn’s post-hoc testing. * p < 0.05, ** p < 0.01, *** p < 0.001. Lines represent mean and S.E.M. K. UMAP of 13,913 ciliated cells, following sub-clustering and resolution of detailed cell annotations. L. UMAP of ciliated cells as in K, colored by SARS-CoV-2 PCR status at time of swab. M. UMAP of ciliated cells as in K, colored by inferred velocity pseudotime (darker blue shades: precursor cells, intense yellow shades: more terminally differentiated cell types). N. Plot of gene expression by ciliated cell velocity pseudotime for select genes (all significantly correlated with velocity expression). Points colored by detailed cell type annotations. O. Proportion of ciliated cell subtypes (detailed annotation) by sample, normalized to all epithelial cells. P. UMAP of 13,210 epithelial cells (using UMAP embedding from A) from SARS-CoV-2 PCR negative participants (Control). Arrows represent smoothed estimate of cellular differentiation trajectories (via RNA velocity) calculated using only cells from Control participants. Q. UMAP of 15,738 epithelial cells (using UMAP embedding from A) from SARS-CoV-2 PCR positive participants (COVID-19). Arrows represent smoothed estimate of cellular differentiation trajectories (via RNA velocity) calculated using only cells from COVID-19 participants. Named cell types highlight those significantly altered between disease groups. See also Figure S2, Table S1
Figure 3.
Figure 3.. Cell-Type Specific and Shared Transcriptional Responses During COVID-19
A. Abundance of significantly differentially expressed (DE) genes by detailed cell types between Control WHO 0 vs. COVID-19 WHO 1–5 samples (left), Control WHO 0 and COVID-19 WHO 6–8 samples (middle), COVID-19 WHO 1–5 and COVID-19 WHO 6–8 samples (right). Restricted to genes with FDR-corrected p < 0.001, log2 fold change > 0.25 (likelihood ratio test assuming an underlying negative binomial distribution). ∅ = comparison not tested, too few cells (< 10). B. Top: Volcano plots of average log fold change (FC) vs. −log10(FDR-adjusted p-value) for ciliated cells (all, coarse annotation). Left: Control WHO 0 vs. COVID-19 WHO 1–5 (mild/moderate). Middle: Control WHO 0 vs. COVID-19 WHO 6–8 (severe). Right: COVID-19 WHO 1–5 (mild/moderate) vs. COVID-19 WHO 6–8 (severe). Horizontal red dashed line: FDR-adjusted p-value = 0.05. Bottom: gene set enrichment analysis plots across shared, type I interferon specific, and type II interferon specific stimulated genes. Genes ranked by their average log FC between each comparison. Black lines represent the ranked location of genes belonging to the annotated gene set. Bar height represents running enrichment score (NES: Normalized Enrichment Score). P-values following Bonferroni-correction: * p < 0.05, ** p < 0.01, *** p < 0.001. C. Heatmap of significantly DE genes between interferon responsive ciliated cells from different disease groups. Values represent row(gene)-scaled digital gene expression (DGE) following log(1+UMI per 10K) normalization. D. Top: Volcano plots related to C. Average log FC vs. −log10(FDR-adjusted p-value) for interferon responsive ciliated cells. Horizontal red dashed line: FDR-adjusted p-value = 0.05. Bottom: gene set enrichment analysis across shared, type I, and type II interferon stimulated genes. E. Heatmap of significantly DE genes between MUC5AChigh goblet cells from different disease groups. Values represent row(gene)-scaled digital gene expression (DGE) following log(1+UMI per 10K) normalization. F. Top: Volcano plots related to E. Average log FC vs. −log10(FDR-adjusted p-value) for MUC5AChigh goblet cells. Horizontal red dashed line: FDR-adjusted p-value = 0.05. Bottom: gene set enrichment analysis across shared, type I, and type II interferon stimulated genes. G. Top: Dot plot of IFNGR1, IFNGR2, IFNAR1, and IFNAR2 gene expression among subset of detailed epithelial subtypes. Bottom: Violin plots of module scores, split by Control WHO 0 (blue), COVID-19 WHO 1–5 (red), and COVID-19 WHO 6–8 (pink). Gene modules represent transcriptional responses of human basal cells from the nasal epithelium following in vitro treatment with IFNα or IFNγ. Significance by Wilcoxon signed-rank test. P-values following Bonferroni-correction: * p< 0.05, ** p < 0.01, *** p < 0.001. H. Common DE genes across detailed cell types. Left (red): genes upregulated in multiple cell types when comparing COVID-19 WHO 1–5 vs. Control WHO 0. Right (pink): genes upregulated in multiple cell types when comparing COVID-19 WHO 6–8 vs. Control WHO 0. See also Figures S3, S4, Tables S2–S4
Figure 4.
Figure 4.. Co-Detection of Human and SARS-CoV-2 RNA
A. Metatranscriptomic classification of all scRNA-seq reads using Kraken2 (Methods). Results shown from selected respiratory viruses. Only results with > 5 reads are shown. B. Normalized abundance of SARS-CoV-2 aligning UMI from all scRNA-seq reads (including those derived from ambient cell barcodes). P < 0.0001 by Kruskal-Wallis test. Pairwise comparisons using Dunn’s post-hoc testing. ** p < 0.01, *** p < 0.001. C. SARS-CoV-2 UMI per high-complexity single-cell transcriptome. Results following correction for ambient viral reads. D. Proportional abundance of secretory cells (all, coarse annotation) vs. total SARS-CoV-2 UMI (normalized to M total UMI). E. Proportional abundance of FOXJ1high ciliated cells vs. total SARS-CoV-2 UMI (normalized to M total UMI). F. Schematic for SARS-CoV-2 genome and subgenomic RNA species. G. Schematic for SARS-CoV-2 genomic features annotated in the custom reference genome. H. Heatmap of SARS-CoV-2 gene expression among SARS-CoV-2 RNA+ single cells (following correction for ambient viral reads). Top color bar indicates disease group (red: COVID-19 WHO 1–5, pink: COVID-19 WHO 6–8, black: COVID-19 Convalescent, blue: Control WHO 0). Middle heatmap: SARS-CoV-2 genes and regions organized from 5′ to 3′. Bottom heatmap: alignment to 70-mer regions directly surrounding viral transcription regulatory sequence (TRS) sites, suggestive of spliced RNA species (joining of the leader to body regions) vs. unspliced RNA species (alignment across TRS). See also Figures S5, S6
Figure 5.
Figure 5.. Cellular Targets of SARS-CoV-2 in the Nasopharynx
A. Summary schematic of top SARS-CoV-2 RNA+ cells. (created with BioRender). B. SARS-CoV-2 RNA+ cell number (top) and percent (bottom) per participant. Results following correction for ambient viral reads. C. Abundance of SARS-CoV-2 RNA+ cells by detailed cell type, bars colored by participant. Results following correction for ambient viral reads. D. Dot plot of SARS-CoV-2 RNA presence by sample (columns) and detailed cell types (rows). Dot size reflects fraction of a given participant and cell type containing SARS-CoV-2 RNA (following viral ambient correction). Dot color reflects fraction of aligned reads corresponding to the SARS-CoV-2 positive strand (yellow) vs. negative strand (black). Top dot plot across columns: alignment of viral reads by participant, separated by RNA species type. Right dot plot across rows: alignment of viral reads by detailed cell type, separated by RNA species type. See also Figures S5, S6
Figure 6.
Figure 6.. Intrinsic and Bystander Responses to SARS-CoV-2 Infection
A. Violin plots of selected genes upregulated in SARS-CoV-2 RNA+ cells in at least 3 individual cell type comparisons. Blue: cells from Control participants, Red: bystander cells from COVID-19 participants, Dark red: SARS-CoV-2 RNA+ cells. B. Enriched gene ontologies among genes consistently up- or down-regulated among SARS-CoV-2 RNA+ cells across cell types. C. Heatmap of genes consistently higher in SARS-CoV-2 RNA+ cells across multiple cell types. Colors represent log fold changes between SARS-CoV-2 RNA+ cells and bystander cells (SARS-CoV-2 RNA negative cells, from COVID-19 participants) by cell type. Restricted to cell types with at least 5 SARS-CoV-2 RNA+ cells. Yellow: upregulated among SARS-CoV-2 RNA+ cells, blue: upregulated among bystander cells. D. Heatmap of genes consistently higher in bystander cells across multiple cell types. See also Figure S7, Table S5

References

    1. Pan Y., Zhang D., Yang P., Poon L. L. M. & Wang Q. Viral load of SARS-CoV-2 in clinical samples. The Lancet Infectious Diseases (2020) doi: 10.1016/S1473-3099(20)30113-4. - DOI - PMC - PubMed
    1. Sanche S. et al. RESEARCH High Contagiousness and Rapid Spread of Severe Acute Respiratory Syndrome Coronavirus 2. Emerg. Infect. Dis. (2020) doi: 10.3201/eid2607.200282. - DOI - PMC - PubMed
    1. Meyerowitz E. A., Richterman A., Gandhi R. T. & Sax P. E. Transmission of SARS-CoV-2: A Review of Viral, Host, and Environmental Factors. Ann. Intern. Med. (2021) doi: 10.7326/m20-5008. - DOI - PMC - PubMed
    1. Fears A. C. et al. Persistence of Severe Acute Respiratory Syndrome Coronavirus 2 in Aerosol Suspensions. Emerg. Infect. Dis. (2020) doi: 10.3201/eid2609.201806. - DOI - PMC - PubMed
    1. Arons M. M. et al. Presymptomatic SARS-CoV-2 Infections and Transmission in a Skilled Nursing Facility. N. Engl. J. Med. (2020) doi: 10.1056/nejmoa2008457. - DOI - PMC - PubMed

Publication types