

This is a preprint.
Immune characterization and profiles of SARS-CoV-2 infected patients reveals potential host therapeutic targets and SARS-CoV-2 oncogenesis mechanism
- PMID: 33619493
- PMCID: PMC7899457
- DOI: 10.1101/2021.02.17.431721
Immune characterization and profiles of SARS-CoV-2 infected patients reveals potential host therapeutic targets and SARS-CoV-2 oncogenesis mechanism
Update in
-
Immune characterization and profiles of SARS-CoV-2 infected patients reveals potential host therapeutic targets and SARS-CoV-2 oncogenesis mechanism.Virus Res. 2021 Aug;301:198464. doi: 10.1016/j.virusres.2021.198464. Epub 2021 May 29. Virus Res. 2021. PMID: 34058265 Free PMC article.
Abstract
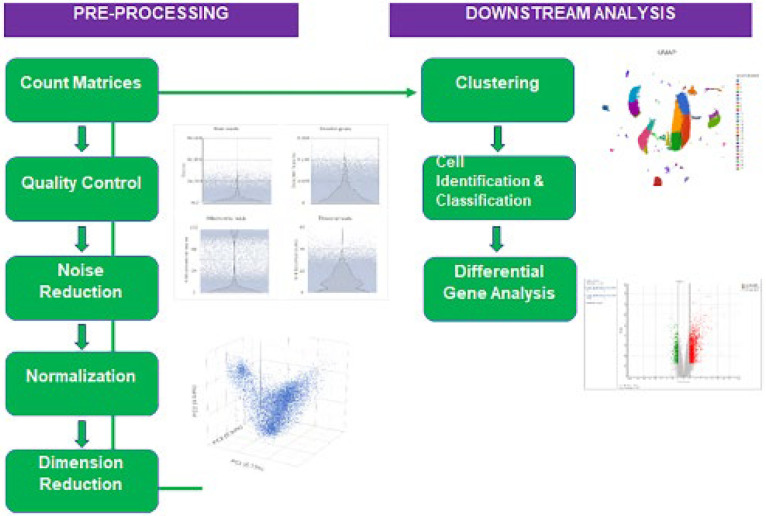
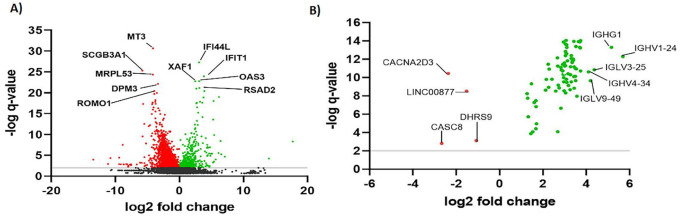
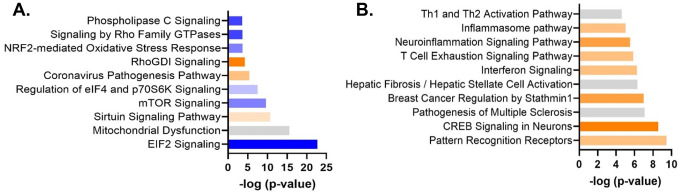
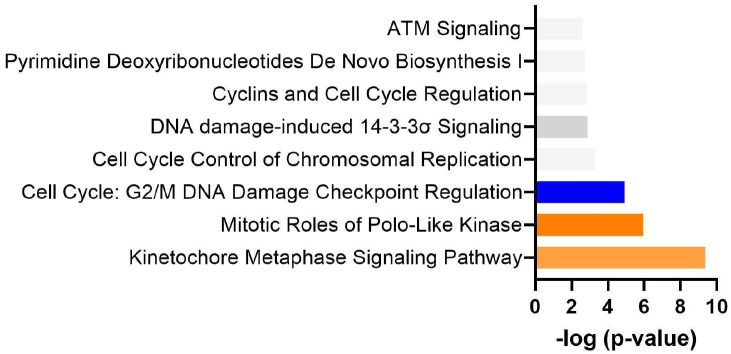
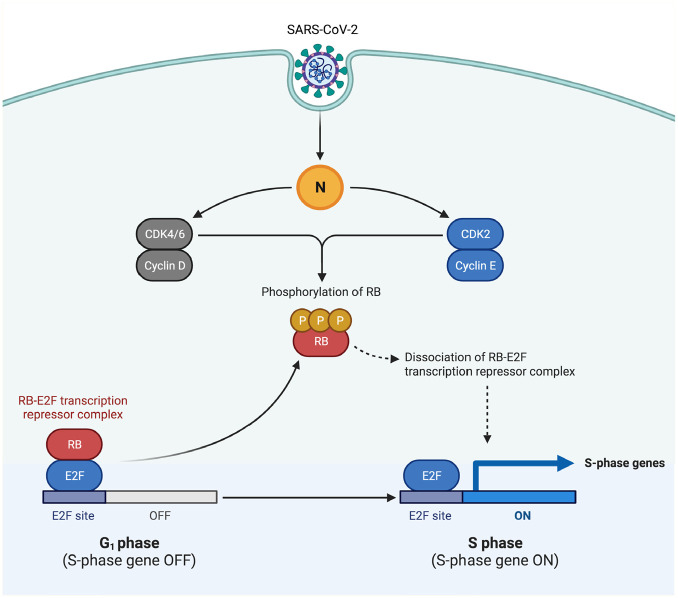
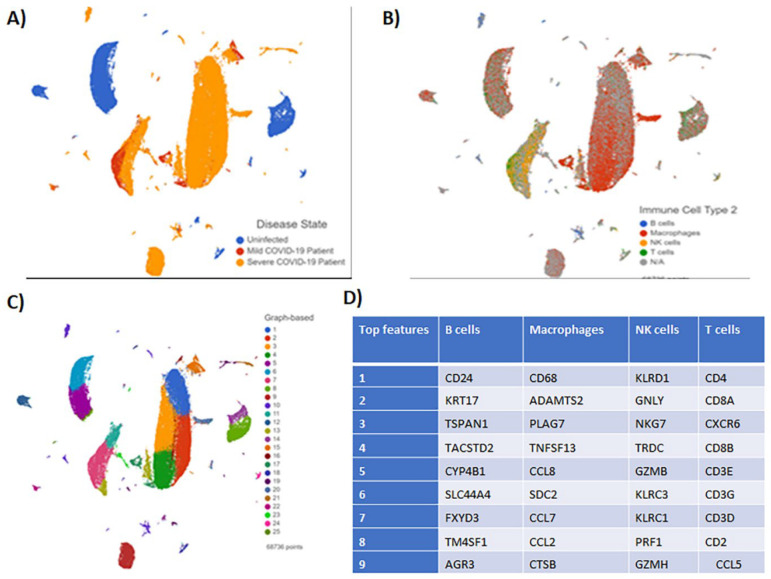
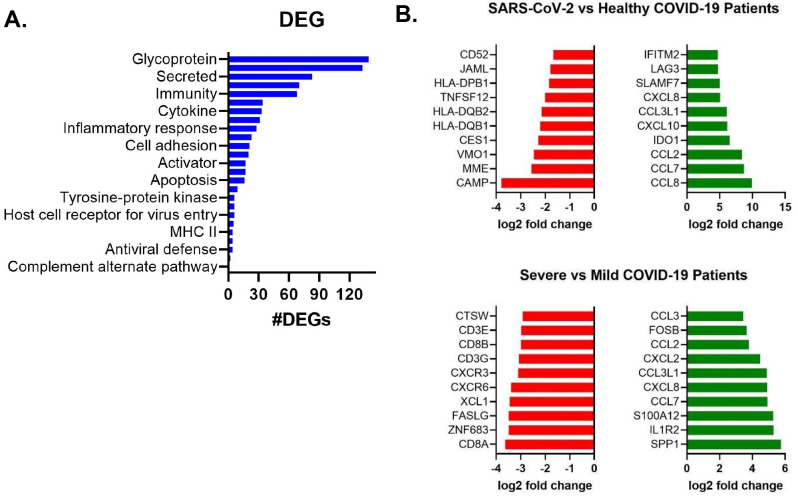
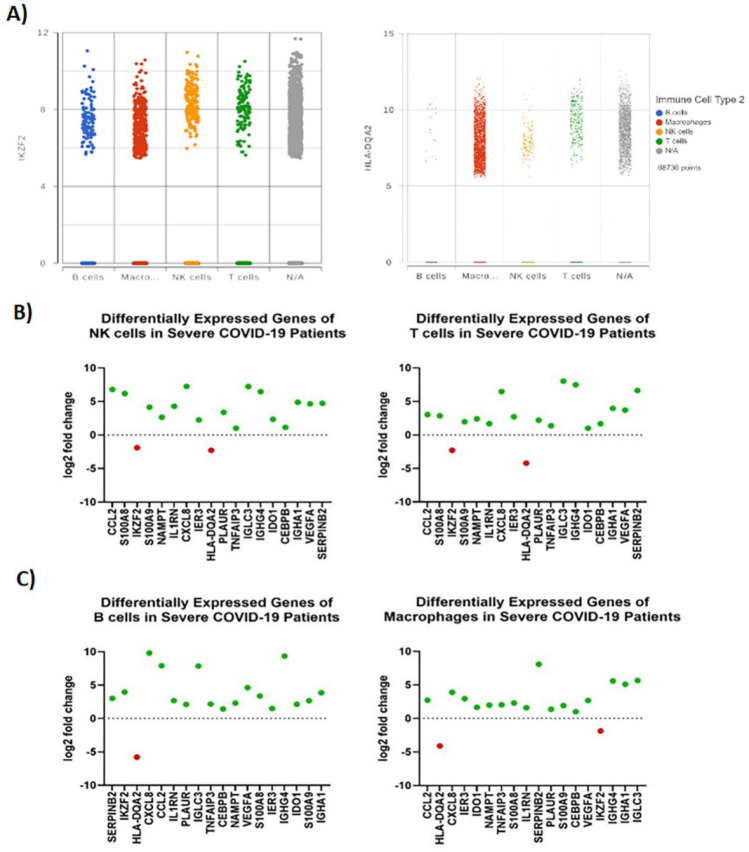
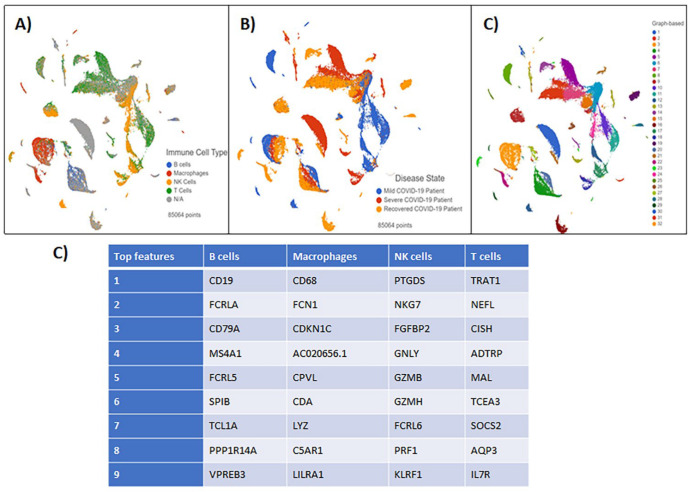
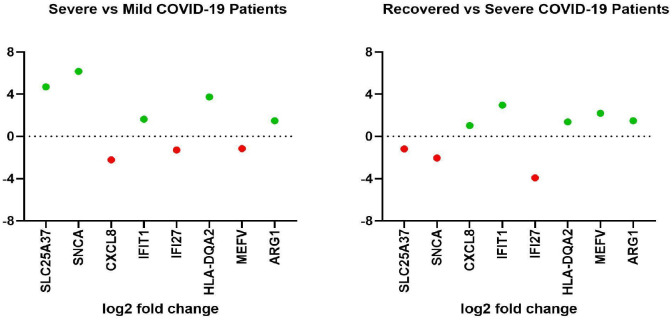
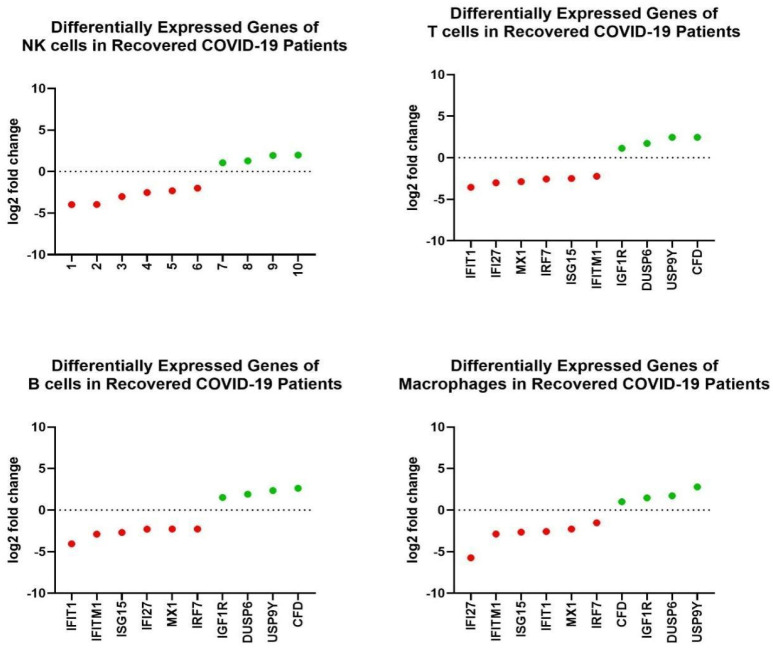
The spread of SARS-CoV-2 and the increasing mortality rates of COVID-19 create an urgent need for treatments, which are currently lacking. Although vaccines have been approved by the FDA for emergency use in the U.S., patients will continue to require pharmacologic intervention to reduce morbidity and mortality as vaccine availability remains limited. The rise of new variants makes the development of therapeutic strategies even more crucial to combat the current pandemic and future outbreaks. Evidence from several studies suggests the host immune response to SARS-CoV-2 infection plays a critical role in disease pathogenesis. Consequently, host immune factors are becoming more recognized as potential biomarkers and therapeutic targets for COVID-19. To develop therapeutic strategies to combat current and future coronavirus outbreaks, understanding how the coronavirus hijacks the host immune system during and after the infection is crucial. In this study, we investigated immunological patterns or characteristics of the host immune response to SARS-CoV-2 infection that may contribute to the disease severity of COVID-19 patients. We analyzed large bulk RNASeq and single cell RNAseq data from COVID-19 patient samples to immunoprofile differentially expressed gene sets and analyzed pathways to identify human host protein targets. We observed an immunological profile of severe COVID-19 patients characterized by upregulated cytokines, interferon-induced proteins, and pronounced T cell lymphopenia, supporting findings by previous studies. We identified a number of host immune targets including PERK, PKR, TNF, NF-kB, and other key genes that modulate the significant pathways and genes identified in COVID-19 patients. Finally, we identified genes modulated by COVID-19 infection that are implicated in oncogenesis, including E2F transcription factors and RB1, suggesting a mechanism by which SARS-CoV-2 infection may contribute to oncogenesis. Further clinical investigation of these targets may lead to bonafide therapeutic strategies to treat the current COVID-19 pandemic and protect against future outbreaks and viral escape variants.
Keywords: Bulk RNASeq analysis; Cancer; Gene expression analysis; Immune characterization of COVID19 patients; Immune profiling of COVID19 patients; SARS-COV-2; Single cell scRNAseq analysis.
Figures
Similar articles
-
Immune characterization and profiles of SARS-CoV-2 infected patients reveals potential host therapeutic targets and SARS-CoV-2 oncogenesis mechanism.Virus Res. 2021 Aug;301:198464. doi: 10.1016/j.virusres.2021.198464. Epub 2021 May 29. Virus Res. 2021. PMID: 34058265 Free PMC article.
-
Comparative analysis of dynamic transcriptomes reveals specific COVID-19 features and pathogenesis of immunocompromised populations.mSystems. 2024 Jun 18;9(6):e0138523. doi: 10.1128/msystems.01385-23. Epub 2024 May 16. mSystems. 2024. PMID: 38752789 Free PMC article.
-
Single-Cell and Bulk RNASeq Profiling of COVID-19 Patients Reveal Immune and Inflammatory Mechanisms of Infection-Induced Organ Damage.Viruses. 2021 Dec 2;13(12):2418. doi: 10.3390/v13122418. Viruses. 2021. PMID: 34960687 Free PMC article.
-
Molecular Insights of SARS-CoV-2 Infection and Molecular Treatments.Curr Mol Med. 2022;22(7):621-639. doi: 10.2174/1566524021666211013121831. Curr Mol Med. 2022. PMID: 34645374 Review.
-
Current Strategies of Antiviral Drug Discovery for COVID-19.Front Mol Biosci. 2021 May 13;8:671263. doi: 10.3389/fmolb.2021.671263. eCollection 2021. Front Mol Biosci. 2021. PMID: 34055887 Free PMC article. Review.
References
-
- Huang C., Wang Y., Li X., Ren L., Zhao J., Hu Y., Zhang L., Fan G., Xu J., Gu X., Cheng Z., Yu T., Xia J., Wei Y., Wu W., Xie X., Yin W., Li H., Liu M., Xiao Y., … Cao B. (2020). Clinical features of patients infected with 2019 novel coronavirus in Wuhan, China. Lancet (London, England), 395(10223), 497–506. 10.1016/S0140-6736(20)30183-5 - DOI - PMC - PubMed
-
- WHO. Weekly epidemiological update - 24 November 2020. (2020). Retrieved December 08, 2020, from https://www.who.int/publications/m/item/weekly-epidemiological-update---...
-
- WHO coronavirus disease (COVID-19) dashboard. Geneva: World Health Organization, 2020. Retrieved February 14, 2021 from https://covid19.who.int/
-
- Kalil A. C., Patterson T. F., Mehta A. K., Tomashek K. M., Wolfe C. R., Ghazaryan V., Marconi V. C., Ruiz-Palacios G. M., Hsieh L., Kline S., Tapson V., Iovine N. M., Jain M. K., Sweeney D. A., El Sahly H. M., Branche A. R., Regalado Pineda J., Lye D. C., Sandkovsky U., … Beigel J. H. (2020). Baricitinib plus Remdesivir for hospitalized adults with COVID-19. New England Journal of Medicine, 0(0), null. 10.1056/NEJMoa2031994 - DOI - PMC - PubMed
-
- WHO recommends against the use of remdesivir in COVID-19 patients. (2020). Retrieved December 08, 2020, from https://www.who.int/news-room/feature-stories/detail/who-recommends-agai...
Publication types
Grants and funding
LinkOut - more resources
Full Text Sources
Other Literature Sources
Miscellaneous