[Preprint]. 2021 Feb 20:2021.02.15.21251753.
doi: 10.1101/2021.02.15.21251753.

In depth analysis of patients with severe SARS-CoV-2 in sub-Saharan Africa demonstrates distinct clinical and immunological profiles

Affiliations

In depth analysis of patients with severe SARS-CoV-2 in sub-Saharan Africa demonstrates distinct clinical and immunological profiles

B Morton et al. medRxiv. .

Update in

Abstract

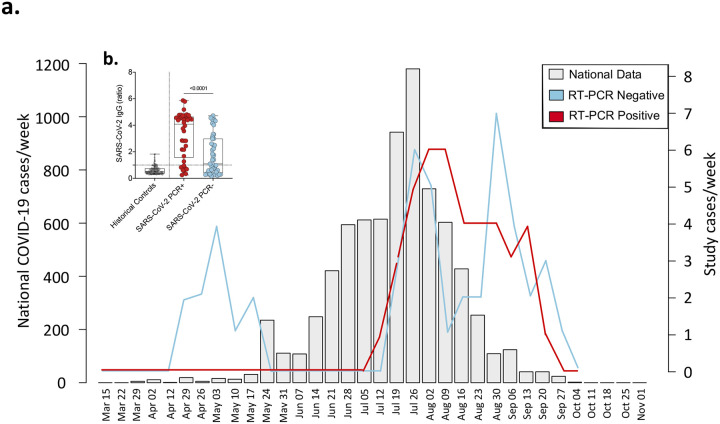
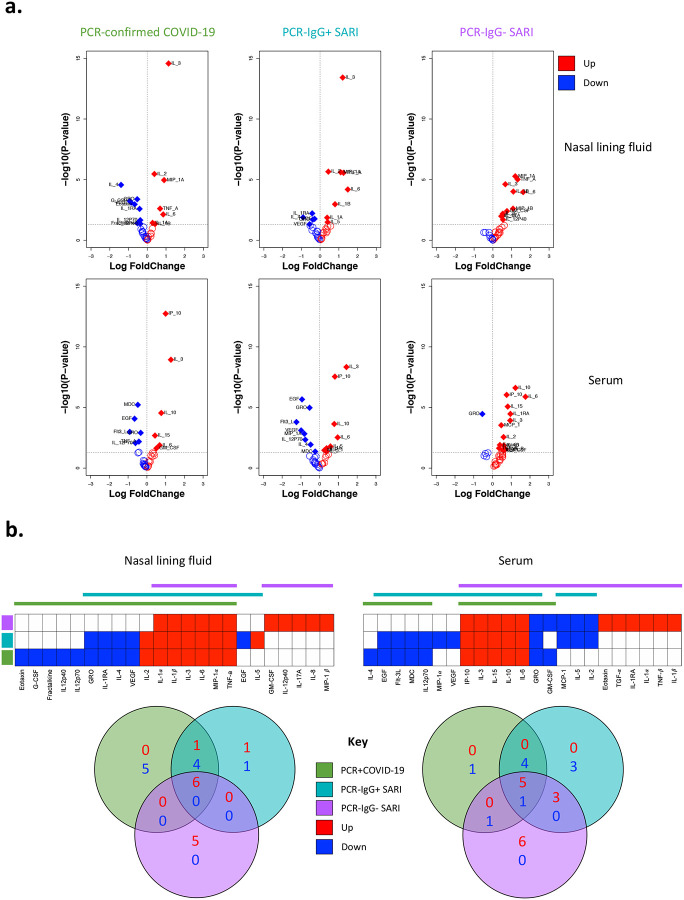
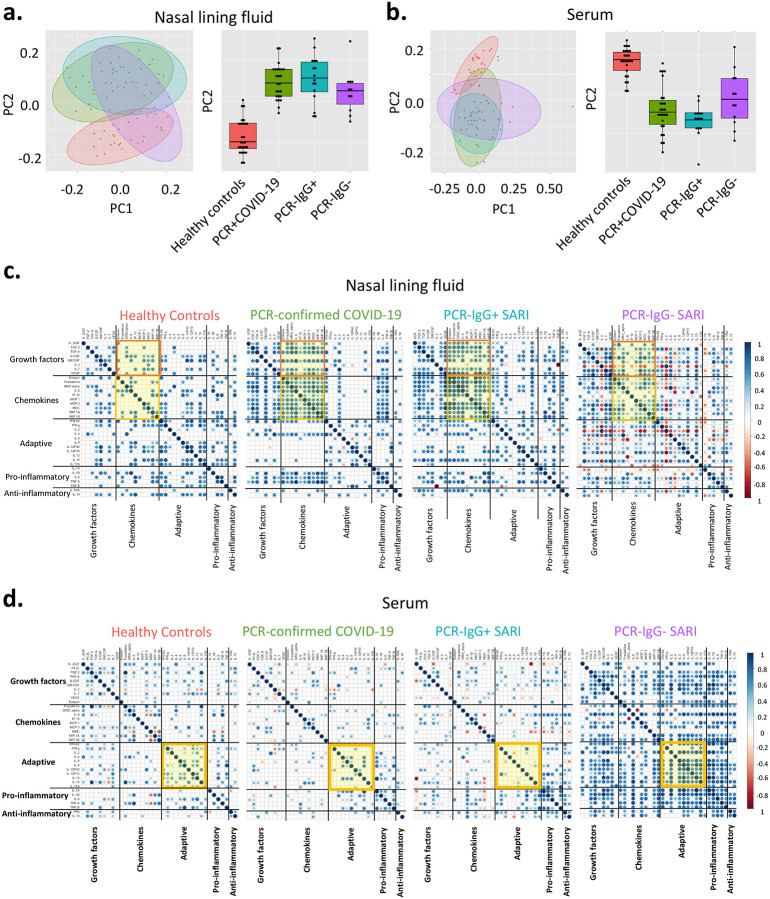
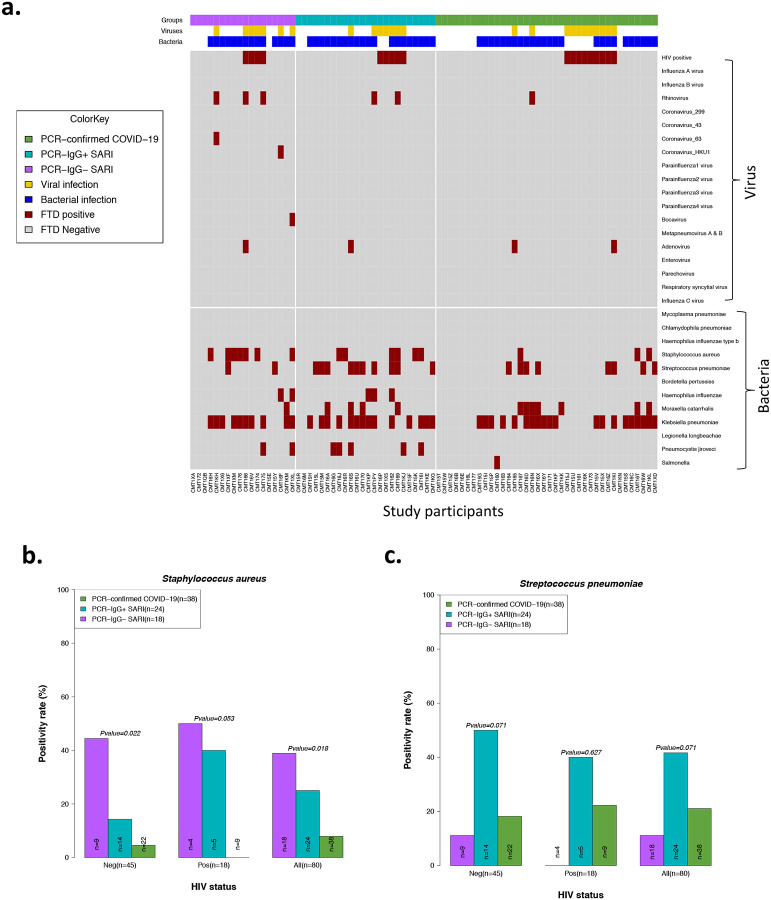
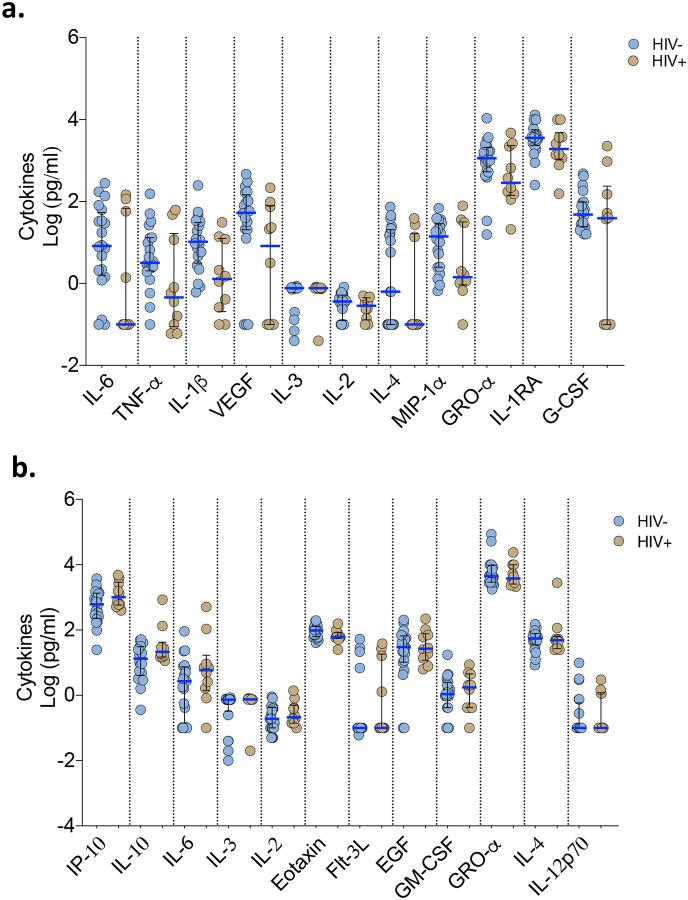
Although the COVID-19 pandemic has left no country untouched there has been limited research to understand clinical and immunological responses in African populations. Here we comprehensively characterise patients hospitalised with suspected or confirmed COVID-19, and healthy community controls. PCR-confirmed COVID-19 participants were more likely to receive dexamethasone and a beta-lactam antibiotic, and survive to hospital discharge than PCR-/IgG+ and PCR-/IgG-participants. PCR-/IgG+ participants exhibited a nasal and systemic cytokine signature analogous to PCR-confirmed COVID-19 participants, but increased propensity for Staphylococcus aureus and Streptococcus pneumoniae colonisation. We did not find evidence that HIV co-infection in COVID-19 participants was associated with mortality or altered cytokine responses. The nasal immune signature in PCR-/IgG+ and PCR-confirmed COVID-19 participants was distinct and predominated by chemokines and neutrophils. In addition, PCR-/IgG+ individuals with high COVID-19 clinical suspicion had inflammatory profiles analogous to PCR-confirmed disease and potentially represent a target population for COVID-19 treatment strategies.


Conflict of interest statement

Declaration of Interests

The authors declare no competing interests.

Figures

Figure 1.
Figure 1.. Study recruitment timeline and SARS-CoV-2 diagnosis.
a) Suspected and SARS-CoV-2 RT-qPCR confirmed COVID-19 patients recruited at Queen Elizabeth Central Hospital, Blantyre (positive (red) and negative (blue)) reported as cases/week compared to the national data (light gray). National data includes SARS-CoV-2 RT-qPCR confirmed symptomatic and non-symptomatic COVID-19. b) SARS-CoV-2 Spike protein 2 (S2) and nucleoprotein (NP) IgG antibodies in PCR-negative and positive individuals. Pre-pandemic historical samples (2016–2019) were tested for SARS-CoV-2 S2 and NP IgG antibodies. The data are reported as the ratio of OD in the test samples to the assay threshold control. The horizontal bars represent the median and interquartile range (IQR). Data were analysed using Kruskal-Wallis test (Historical samples, n=132; PCR-positive, n=38; PCR-negative, n=45). Severe acute respiratory syndrome coronavirus 2; COVID-19, coronavirus disease of 2019; PCR, polymerase chain reaction; IgG, immunoglobulin G; SARI, severe acute respiratory infection.
Figure 2.
Figure 2.. Cytokine concentrations in nasal lining fluid and serum.
a) Volcano plots showing differential cytokine concentrations in nasal lining fluid and serum of PCR-confirmed COVID-19, PCR−/IgG+ SARI and PCR−/IgG− SARI patients compared to health controls. The horizontal dotted line represents a cut-off for statistical significance, while the vertical dotted line represents a cut-off point for determining whether the levels of the cytokines were higher (right, red) or lower (left, blue) compared to healthy controls. b) Venn diagrams showing similarities in cytokine concentrations among the PCR-confirmed COVID-19 (green), PCR−/IgG+ SARI (turquoise) and PCR−/IgG− SARI (purple) patients in nasal lining fluid and serum relative to healthy controls. Numbers in Venn diagrams represent the number of cytokines that were either higher (red) or lower (blue) than healthy controls common among the study groups. Data were analysed using empirical Bayes moderated t-tests (Healthy controls, n=25; PCR-confirmed COVID-19; n=25; PCR−/IgG+ SARI, n=16; PCR−/IgG− SARI, n=11). SARS-CoV-2, severe acute respiratory syndrome coronavirus 2; COVID-19, coronavirus disease of 2019; PCR, polymerase chain reaction; IgG, immunoglobulin G; SARI, severe acute respiratory infection
Figure 3.
Figure 3.. Nasal and serum cytokine profiles.
Principal component analysis (PCA) of the 38 analytes (37 cytokines and sCD40L) in a) nasal lining fluid and b) serum of healthy controls, PCR-confirmed COVID-19, PCR−/IgG+ SARI and PCR−/IgG− SARI patients; showing similarity of nasal cytokine responses between PCR-confirmed COVID-19 and PCR−/IgG+ SARI patients. Correlogram of cytokine interactions in c) nasal lining fluid and d) serum amongst the different study groups, showing induction of similar immune process in PCR-confirmed COVID-19 and PCR−/IgG+ SARI patients. Healthy controls, n=25; PCR confirmed COVID-19; n=25; PCR−/IgG+ SARI, n=16; PCR−/IgG− SARI, n=11. SARS-CoV-2, severe acute respiratory syndrome coronavirus 2; COVID-19, coronavirus disease of 2019; PCR, polymerase chain reaction; IgG, immunoglobulin G; SARI, severe acute respiratory infection; PC1, principal component 1; PC2, principal component 2.
Figure 4.
Figure 4.. Nasal cell composition in healthy controls, confirmed and suspected COVID-19 patients.
a) Representative flow cytometry plots for cellular composition in the nasal mucosa of healthy controls, PCR-confirmed COVID-19 and PCR−/IgG+ SARI patients. b) Proportions of T cells, B cells, neutrophils and monocytes in nasal mucosa of healthy controls and COVID-19 patients. The horizontal bars represent the median and interquartile range (IQR). Data were analysed using Kruskal-Wallis test (Healthy controls, n=20; PCR confirmed COVID-19; n=20; PCR−/IgG+ SARI, n=11). SARS-CoV-2, severe acute respiratory syndrome coronavirus 2; COVID-19, coronavirus disease of 2019; PCR, polymerase chain reaction; IgG, immunoglobulin G; SARI, severe acute respiratory infection
Figure 5.
Figure 5.. Co-colonisation/infection status of suspected and confirmed COVID-19 patients.
a) Profile of co-colonisation/infection pathogens in nasopharyngeal/throat swabs. Prevalence of b) Staphylococcus aureus and c) Streptococcus pneumoniae co-colonisation in suspected and confirmed COVID-19. The horizontal bars represent the median and interquartile range (IQR). Data were analysed using Kruskal-Wallis test (PCR-confirmed COVID-19; n=39; PCR−/IgG+ SARI, n=23; PCR−/IgG− SARI, n=22). COVID-19, coronavirus disease of 2019.
Figure 6.
Figure 6.. Cytokine concentrations in nasal lining fluid and serum based on HIV-coinfection status.
PCR confirmed COVID-19 and PCR−/IgG+ SARI patients were combined (n=41) into one COVID-19 patient group. Only cytokines that showed differential responses between patients with healthy controls were included in the analysis. a) Cytokine concentrations between HIV-infected and uninfected COVID-19 patients in nasal lining fluid. b) Cytokine concentrations between HIV-infected and uninfected COVID-19 patients in serum. The horizontal bars represent the median and interquartile range (IQR). Data were analysed using Kruskal-Wallis test (HIV-, n=20; HIV+, n=10). COVID-19, coronavirus disease of 2019; PCR, polymerase chain reaction; SARI, severe acute respiratory infection

References

    1. Government SA. Update on Covid-19 2020. [Available from: https://sacoronavirus.co.za.
    1. Kuehn BM. Africa Succeeded Against COVID-19’s First Wave, but the Second Wave Brings New Challenges. Jama. 2021;325(4):327–8. - PubMed
    1. Andrews B, Semler MW, Muchemwa L, Kelly P, Lakhi S, Heimburger DC, et al. Effect of an Early Resuscitation Protocol on In-hospital Mortality Among Adults With Sepsis and Hypotension: A Randomized Clinical Trial. JAMA. 2017;318(13):1233–40. - PMC - PubMed
    1. Mallett S, Allen AJ, Graziadio S, Taylor SA, Sakai NS, Green K, et al. At what times during infection is SARS-CoV-2 detectable and no longer detectable using RT-PCR-based tests? A systematic review of individual participant data. BMC Med. 2020;18(1):346. - PMC - PubMed
    1. Chi Y, Ge Y, Wu B, Zhang W, Wu T, Wen T, et al. Serum Cytokine and Chemokine Profile in Relation to the Severity of Coronavirus Disease 2019 in China. J Infect Dis. 2020;222(5):746–54. - PMC - PubMed

Publication types

LinkOut - more resources