. 2021 Mar;37(2):272-277.
doi: 10.1111/jrh.12555. Epub 2021 Feb 22.

Nonmetropolitan COVID-19 Incidence and Mortality Rates Surpassed Metropolitan Rates Within the First 24 Weeks of the Pandemic Declaration: United States, March 1-October 18, 2020

Affiliations

Nonmetropolitan COVID-19 Incidence and Mortality Rates Surpassed Metropolitan Rates Within the First 24 Weeks of the Pandemic Declaration: United States, March 1-October 18, 2020

Kevin A Matthews et al. J Rural Health. 2021 Mar.

Abstract

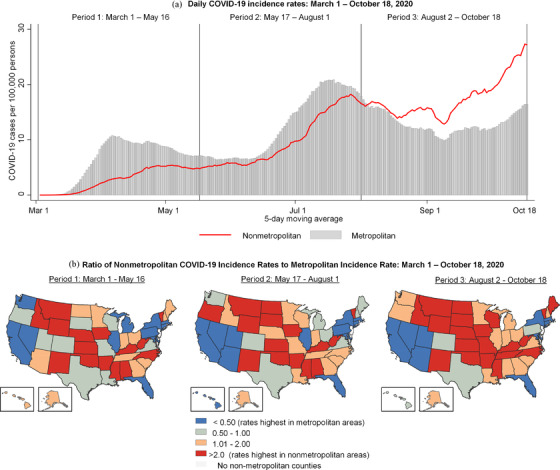
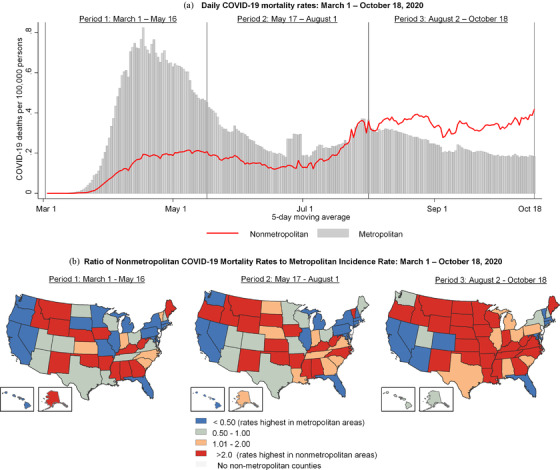
Purpose: This report compares COVID-19 incidence and mortality rates in the nonmetropolitan areas of the United States with the metropolitan areas across three 11-week periods from March 1 to October 18, 2020.

Methods: County-level COVID-19 case, death, and population counts were downloaded from USAFacts.org. The 2013 NCHS Urban-Rural Classification Scheme was collapsed into two categories called metropolitan (large central, large fringe, medium, and small metropolitans) and nonmetropolitan (micropolitan/noncore). Daily COVID-19 incidence and mortality rates were computed to show temporal trends for each of these two categories. Maps showing the ratio of nonmetropolitan to metropolitan COVID-19 incidence and mortality rates by state identify states with higher rates in nonmetropolitan areas than in metropolitan areas in each of the three 11-week periods.

Findings: In the period between March 1 and October 18, 2020, 13.8% of the 8,085,214 confirmed COVID-19 cases and 10.7% of the 217,510 deaths occurred among people residing in nonmetropolitan counties. The nonmetropolitan incidence and mortality trends steadily increased and surpassed those in metropolitan areas, beginning in early August.

Conclusions: Despite the relatively small size of the US population living in nonmetropolitan areas, these areas have an equal need for testing, health care personnel, and mitigation resources. Having state-specific rural data allow the development of prevention messages that are tailored to the sociocultural context of rural locations.

Keywords: COVID-19; geographic information system; incidence; mortality; rural.


Figures

FIGURE 1
FIGURE 1
(a) Daily COVID‐19 incidence rates: March 1–October 18, 2020. (b) Ratio of nonmetropolitan COVID‐19 incidence rates to metropolitan incidence rate: 1–October 18, 2020. In the period between March 1 and October 18, 2020, 13.8% of the 8,085,214 COVID‐19 cases occurred in nonmetropolitan areas of the United States. Incidence rates were calculated by tabulating county‐level case and population counts into the metropolitan and nonmetropolitan parts of the United States. The numerator was the case counts and the denominator was the population counts. The National Center for Health Statistics Urban‐Rural Classification Scheme for Counties was used to define metropolitan (large central, large fringe, medium, and small) and nonmetropolitan (micropolitan and noncore) areas. (A) Trends show national nonmetropolitan and metropolitan incidence rates; nonmetropolitan rates first exceeded the metropolitan rates in early August, surpassed the peak (July) metropolitan rate in early October, and continues to accelerate at a faster pace at the end of the third period. (B) Nonmetropolitan to metropolitan incidence rate ratio maps identify whether the rates were higher in the nonmetropolitan or metropolitan areas of each states. Rate ratios ≥ 1 (red) have higher nonmetropolitan rates than metropolitan rates and rate ratios ˂ 1 (blue) have higher metropolitan rates than nonmetropolitan rates. State maps of nonmetropolitan to metropolitan incidence rate ratios in three periods show that the highest COVID‐19 incidence rates had shifted to the nonmetropolitan areas in many (n = 9) states during period 3
FIGURE 2
FIGURE 2
(a) Daily COVID‐19 mortality rates: March 1–October 18, 2020. (b) Ratio of nonmetropolitan COVID‐19 mortality rates to metropolitan incidence rate: 1–October 18, 2020. In the period between March 1 and October 18, 2020, 10.7% of the 217,510 deaths occurred in nonmetropolitan areas of the United States. Mortality rates were calculated by tabulating county‐level case and population counts into the metropolitan and nonmetropolitan parts of the United States. The numerator was the death counts and the denominator was the population counts. The National Center for Health Statistics Urban‐Rural Classification Scheme for Counties was used to define metropolitan (large central, large fringe, medium, and small) and nonmetropolitan (micropolitan and noncore). (a) Trends show national metropolitan and nonmetropolitan mortality rates; nonmetropolitan rates first exceeded the metropolitan rates in early August, plateaued for several weeks, and appear to increase again in mid‐October. (b) Nonmetropolitan to metropolitan mortality rate ratio maps identify whether the rates were higher in the nonmetropolitan or metropolitan areas of each states. Rate ratios ≥ 1 (red) have higher nonmetropolitan rates than metropolitan rates and rate ratios ˂ 1 (blue) have higher metropolitan rates than nonmetropolitan rates. State maps of nonmetropolitan to metropolitan mortality rate ratios in three periods show that the highest COVID‐19 incidence rates had shifted to the nonmetropolitan areas in many (n = 15) states during period 3

Similar articles

Cited by

References

    1. Ingram DD, Franco SJ. 2013 National Center for Health Statistics Urban‐Rural Classification Scheme for Counties. Atlanta, GA: US Department of Health and Human Services, Centers for Disease Control and Prevention; 2014.
    1. Pender J, Hertz T, Cromartie J, Farrigan T. Rural America at a Glance. Washington, DC: United States Department of Agriculture; 2019.
    1. Razzaghi H, Wang Y, Lu H, et al. Estimated county‐level prevalence of selected underlying medical conditions associated with increased risk for severe COVID‐19 illness—United States, 2018. Morb Mortal Wkly Rep. 2020;69(29):945–950. - PMC - PubMed
    1. Cohen PN. The COVID‐19 epidemic in rural US counties. Eur J Environ Public Health. 2020;4(2):em0050.
    1. Frakt AB. The rural hospital problem. J Am Med Assoc. 2019;321(23):2271‐2272. - PubMed

Publication types

MeSH terms