. 2021 Feb 1;62(2):36.
doi: 10.1167/iovs.62.2.36.

Retinal Phenotyping of Ferrochelatase Mutant Mice Reveals Protoporphyrin Accumulation and Reduced Neovascular Response

Affiliations

Retinal Phenotyping of Ferrochelatase Mutant Mice Reveals Protoporphyrin Accumulation and Reduced Neovascular Response

S P B Sardar Pasha et al. Invest Ophthalmol Vis Sci. .

Abstract

Purpose: Heme depletion, through inhibition of ferrochelatase (FECH), blocks retinal and choroidal neovascularization. Both pharmacologic FECH inhibition and a partial loss-of-function Fech mutation (Fechm1Pas) are associated with decreased neovascularization. However, the ocular physiology of Fechm1Pas mice under basal conditions has not been characterized. Here, we aimed to characterize the retinal phenotype of Fechm1Pas mice.

Methods: We monitored retinal vasculature at postnatal day 17, 2 months, and 6 months in Fechm1Pas homozygotes, heterozygotes, and their wild-type littermates. We characterized Fech substrate protoporphyrin (PPIX) fluorescence in the eye (excitation = 403 nm, emission = 628 nm), retinal function by electroretinogram, visual acuity by optomotor reflex, and retinal morphology by optical coherence tomography and histology. We stained vasculature using isolectin B4 and fluorescein angiography. We determined endothelial sprouting of retinal and choroidal tissue ex vivo and bioenergetics of retinal punches using a Seahorse flux analyzer.

Results: Fundi, retinal vasculature, venous width, and arterial tortuosity showed no aberrations. However, VEGF-induced retinal and choroidal sprouting was decreased in Fechm1Pas mutants. Homozygous Fechm1Pas mice had pronounced buildup of PPIX in the posterior eye with no damage to visual function, bioenergetics, and integrity of retinal layers.

Conclusions: Even with a buildup of PPIX in the retinal vessels in Fechm1Pas homozygotes, the vasculature remains normal. Notably, stimulus-induced ex vivo angiogenesis was decreased in Fechm1Pas mutants, consistent with reduced pathologic angiogenesis seen previously in neovascular animal models. Our findings indicate that Fechm1Pas mice are a useful model for studying the effects of heme deficiency on neovascularization due to Fech blockade.


Conflict of interest statement

Disclosure: S.P.B. Sardar Pasha, 62/837,506 (P); T. Shetty, None; N.A. Lambert-Cheatham, None; K. Sishtla, None; D. Mathew, None; A. Muniyandi, None; N. Patwari, None; A.D. Bhatwadekar, None; T.W. Corson, 15/009,339, 62/837,506 (P)

Figures

Figure 1.
Figure 1.
In vivo ocular imaging of adult Fechm1Pas mutant mice. (A) Representative fundus photographs of 2-month-old Fechm1Pas homozygous (Homo) and heterozygous (Het) mutants and WT animals (the white halo seen close to optic nerve head is an artifact). (B) PPIX fluorescence imaging. (C) OCT images from adult Fechm1Pas mutant and WT animals from the plane indicated in the fundus photograph (red lines in A). Representative data from n = 8–12 eyes, n = 4–6 animals per genotype.
Figure 2.
Figure 2.
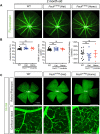
Vascular organization in adult Fechm1Pas mutants. (A) Fluorescein angiography images of 2-month-old Fechm1Pas homozygous (Homo) and heterozygous (Het) mutants and WT animals. Vasculature shown in green; n = 6–12 eyes, n = 3–6 animals. (B) QuantBV vessel analysis of fluorescein angiography. Data represented as mean ± SEM, n = 5–12 eyes, n = 3–6 animals; ns, nonsignificant (one-way ANOVA). (C) Confocal overview of retinal flatmounts from Fechm1Pas mutants and WT animals stained with GS-IB4 (green; labels vasculature) and confocal Z-stack merged images, n = 4–6 retinas, n = 3–6 animals per group. Note that punctate staining in the high-magnification image from the heterozygote is artifactual. ONH, optic nerve head.
Figure 3.
Figure 3.
Fech m1Pas mutant inhibits retinal and choroidal sprouting ex vivo. (A) Representative phase-contrast images of retinal sprouts from Fechm1Pas homozygous (Homo) and heterozygous (Het) mutants and WT animals formed after 48 hours of VEGF treatment. (B) Quantification of sprouting distance from the edge of the retinal tissue to the end of the sprouts averaged from four perpendicular directions using ImageJ software. Data represented as mean ± SEM, n = 12 retinal pieces per treatment; n = 5–6 eyes, ns, not significant, **P < 0.01, ***P < 0.001 (ANOVA with Tukey's post hoc test). (C) Representative phase-contrast images of choroidal sprouts from Fechm1Pas mutants and WT controls formed after 48 hours of VEGF treatment. (D) Quantification of choroidal sprouting distance from the edge of the choroidal tissue to the end of the sprouts averaged from four perpendicular directions using ImageJ software. Data represented as mean ± SEM, n = 18–19 choroidal pieces per treatment, n = 8–10 eyes; ns, nonsignificant, ***P < 0.001 (ANOVA with Tukey's post hoc test).
Figure 4.
Figure 4.
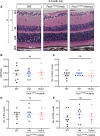
Individual retinal layers of adult Fechm1Pas mice are normal. (A) Representative images of H&E sections of the retinas of 2-month-old Fechm1Pas homozygous (Homo) and heterozygous (Het) mutants and WT animals. (B) Quantification of the A/B ratio as indicated. Quantification of the number of rows of nuclei (thickness) making up the (C) GCL, (D) INL, and (E) ONL. Data represented as mean ± SEM, n = 5–8 animals per genotype; ns, not significant (one-way ANOVA).
Figure 5.
Figure 5.
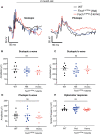
Fech m1Pas mice had comparable visual activity and optomotor response. (A) Representative mean ERG traces of dark-adapted Fechm1Pas homozygous (Homo) and heterozygous (Het) mutants and WT mice. Quantification of (B) scotopic a-wave, (C) scotopic b-wave, and (D) photopic b-wave (stimulus: scotopic = 2.5, photopic = 25 cd·s/m2). (E) Quantification of the optomotor response of mice from each genotype. Data represented as mean ± SEM, n = 6–11 animals; each data point corresponds to mean of left and right eye. ns, not significant (one-way ANOVA).
Figure 6.
Figure 6.
Retinal bioenergetics of Fechm1Pas mice do not vary by genotype among littermates. (A) Representative OCR kinetic traces for retinas from Fechm1Pas homozygous (Homo) and heterozygous (Het) mutants and WT mice. (B) Basal respiration, (C) maximal respiration, and (D) spare respiratory capacity were calculated based on OCR curves for the respective treatment groups. Graphs indicate mean ± SEM, n = 6 animals per genotype; each data point corresponds to mean of two tissue punches from each retina. ns, not significant (one-way ANOVA).

References

    1. Dailey HA, Meissner PN.. Erythroid heme biosynthesis and its disorders. Cold Spring Harb Perspect Med. 2013; 3: a011676. - PMC - PubMed
    1. Shetty T, Corson TW.. Mitochondrial heme synthesis enzymes as therapeutic targets in vascular diseases. Front Pharmacol. 2020; 11: 1015. - PMC - PubMed
    1. Bonkovsky HL, Guo JT, Hou W, Li T, Narang T, Thapar M.. Porphyrin and heme metabolism and the porphyrias. Compr Physiol. 2013; 3: 365–401. - PubMed
    1. Rufenacht UB, Gouya L, Schneider-Yin X, et al. .. Systematic analysis of molecular defects in the ferrochelatase gene from patients with erythropoietic protoporphyria. Am J Hum Genet. 1998; 62: 1341–1352. - PMC - PubMed
    1. Boulechfar S, Lamoril J, Montagutelli X, et al. .. Ferrochelatase structural mutant (Fechm1Pas) in the house mouse. Genomics. 1993; 16: 645–648. - PubMed

Publication types

MeSH terms

LinkOut - more resources