

Bacterial diketopiperazines stimulate diatom growth and lipid accumulation
- PMID: 33620482
- PMCID: PMC8195512
- DOI: 10.1093/plphys/kiab080
Bacterial diketopiperazines stimulate diatom growth and lipid accumulation
Abstract
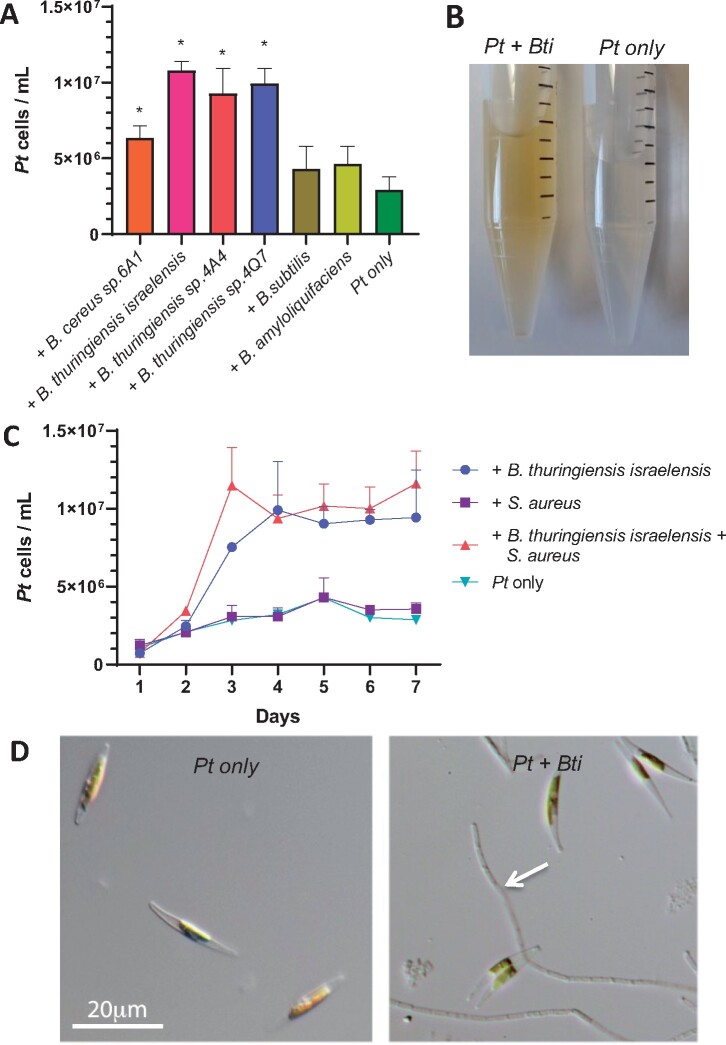
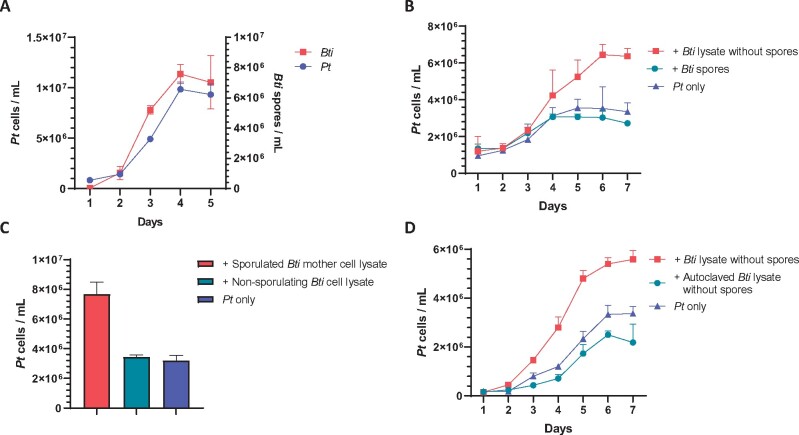
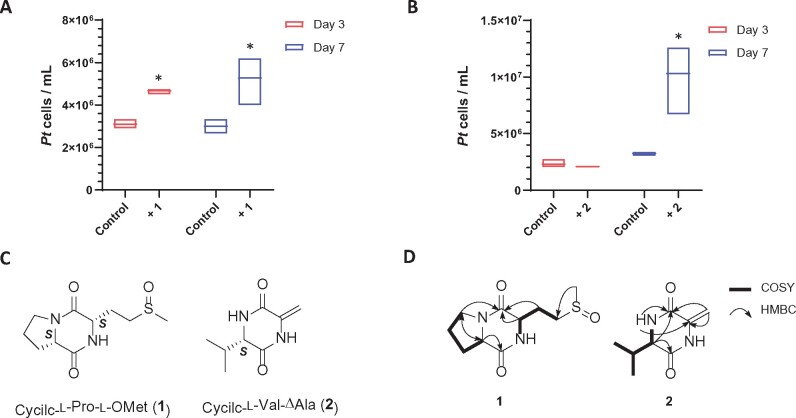
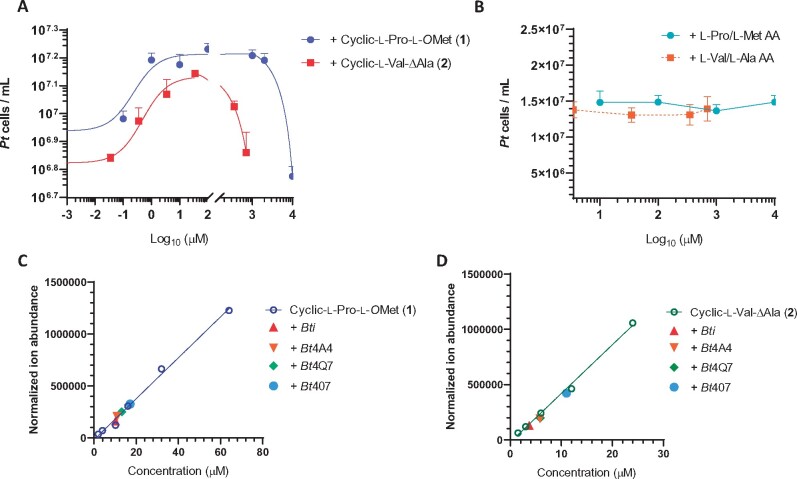
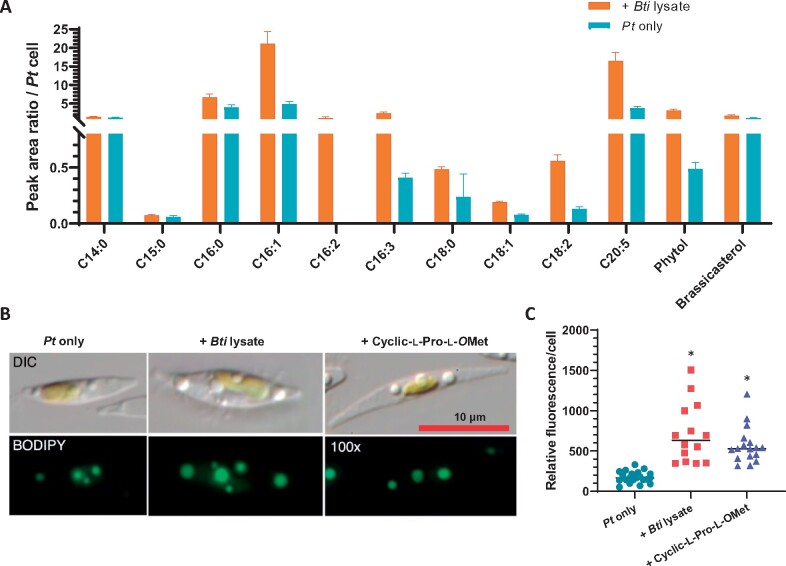
Diatoms are photosynthetic microalgae that fix a significant fraction of the world's carbon. Because of their photosynthetic efficiency and high-lipid content, diatoms are priority candidates for biofuel production. Here, we report that sporulating Bacillus thuringiensis and other members of the Bacillus cereus group, when in co-culture with the marine diatom Phaeodactylum tricornutum, significantly increase diatom cell count. Bioassay-guided purification of the mother cell lysate of B. thuringiensis led to the identification of two diketopiperazines (DKPs) that stimulate both P. tricornutum growth and increase its lipid content. These findings may be exploited to enhance P. tricornutum growth and microalgae-based biofuel production. As increasing numbers of DKPs are isolated from marine microbes, the work gives potential clues to bacterial-produced growth factors for marine microalgae.
© American Society of Plant Biologists 2021. All rights reserved. For permissions, please email: journals.permissions@oup.com.
Figures
Comment in
-
Compounds derived from bacteria enhance marine diatom growth.Plant Physiol. 2021 Jun 11;186(2):827-828. doi: 10.1093/plphys/kiab139. Plant Physiol. 2021. PMID: 33772271 Free PMC article. No abstract available.
Similar articles
-
Investigating mixotrophic metabolism in the model diatom Phaeodactylum tricornutum.Philos Trans R Soc Lond B Biol Sci. 2017 Sep 5;372(1728):20160404. doi: 10.1098/rstb.2016.0404. Philos Trans R Soc Lond B Biol Sci. 2017. PMID: 28717014 Free PMC article.
-
Growth and physiological responses of a marine diatom (Phaeodactylum tricornutum) against two imidazolium-based ionic liquids ([C4mim]BF4 and [C8mim]BF4).Aquat Toxicol. 2017 Aug;189:115-122. doi: 10.1016/j.aquatox.2017.05.016. Epub 2017 May 31. Aquat Toxicol. 2017. PMID: 28618302
-
Combined nitrogen limitation and hydrogen peroxide treatment enhances neutral lipid accumulation in the marine diatom Phaeodactylum tricornutum.Bioresour Technol. 2016 Nov;219:559-565. doi: 10.1016/j.biortech.2016.08.010. Epub 2016 Aug 5. Bioresour Technol. 2016. PMID: 27529521
-
Modelling metabolism of the diatom Phaeodactylum tricornutum.Biochem Soc Trans. 2015 Dec;43(6):1182-6. doi: 10.1042/BST20150152. Biochem Soc Trans. 2015. PMID: 26614658 Review.
-
Mixotrophy in diatoms: Molecular mechanism and industrial potential.Physiol Plant. 2021 Oct;173(2):603-611. doi: 10.1111/ppl.13471. Epub 2021 Jun 9. Physiol Plant. 2021. PMID: 34076276 Review.
Cited by
-
Cyclic Dipeptides: The Biological and Structural Landscape with Special Focus on the Anti-Cancer Proline-Based Scaffold.Biomolecules. 2021 Oct 14;11(10):1515. doi: 10.3390/biom11101515. Biomolecules. 2021. PMID: 34680148 Free PMC article. Review.
-
Nitrogenous Compounds from the Antarctic Fungus Pseudogymnoascus sp. HSX2#-11.Molecules. 2021 Apr 30;26(9):2636. doi: 10.3390/molecules26092636. Molecules. 2021. PMID: 33946466 Free PMC article.
-
Diketopiperazine Gels: New Horizons from the Self-Assembly of Cyclic Dipeptides.Molecules. 2021 Jun 3;26(11):3376. doi: 10.3390/molecules26113376. Molecules. 2021. PMID: 34204905 Free PMC article. Review.
-
Unveiling interactions mediated by B vitamins between diatoms and their associated bacteria from cocultures.J Phycol. 2024 Dec;60(6):1456-1470. doi: 10.1111/jpy.13515. Epub 2024 Oct 16. J Phycol. 2024. PMID: 39413213 Free PMC article.
-
Compounds derived from bacteria enhance marine diatom growth.Plant Physiol. 2021 Jun 11;186(2):827-828. doi: 10.1093/plphys/kiab139. Plant Physiol. 2021. PMID: 33772271 Free PMC article. No abstract available.
References
-
- Ashraf A, Bano A, Ali SA (2019) Characterisation of plant growth-promoting rhizobacteria from rhizosphere soil of heat-stressed and unstressed wheat and their use as bio-inoculant. Plant Biol 21: 762–769 - PubMed
-
- Borthwick AD (2012) 2,5-Diketopiperazines: synthesis, reactions, medicinal chemistry, and bioactive natural products. Chem Rev 112: 3641–3716 - PubMed
-
- Bowler C, Allen AE, Badger JH, Grimwood J, Jabbari K, Kuo A, Maheswari U, Martens C, Maumus F, Otillar RP, et al. (2008) The Phaeodactylum genome reveals the evolutionary history of diatom genomes. Nature 456: 239–244 - PubMed
Publication types
MeSH terms
Substances
LinkOut - more resources
Full Text Sources
Other Literature Sources
Research Materials
