. 2021 Jun 11;186(2):945-963.
doi: 10.1093/plphys/kiab085.

Analysis of formin functions during cytokinesis using specific inhibitor SMIFH2

Affiliations

Analysis of formin functions during cytokinesis using specific inhibitor SMIFH2

Laining Zhang et al. Plant Physiol. .

Abstract

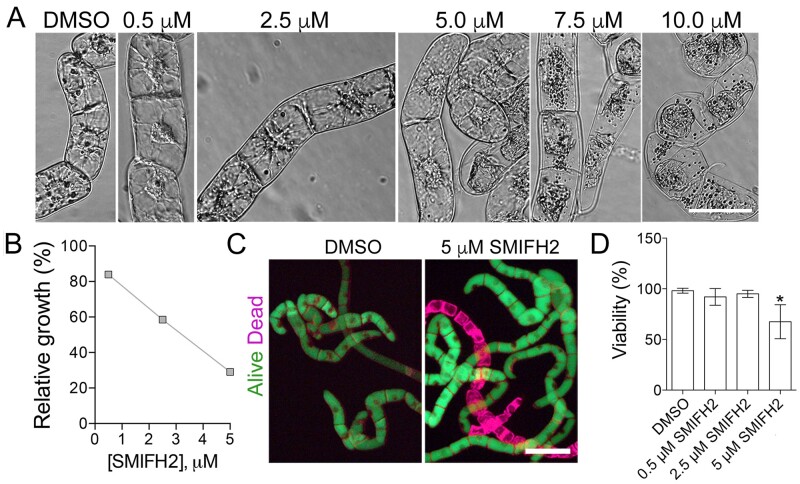
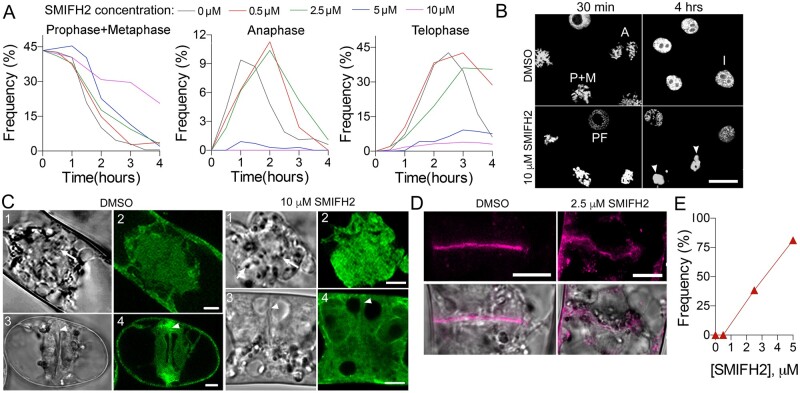
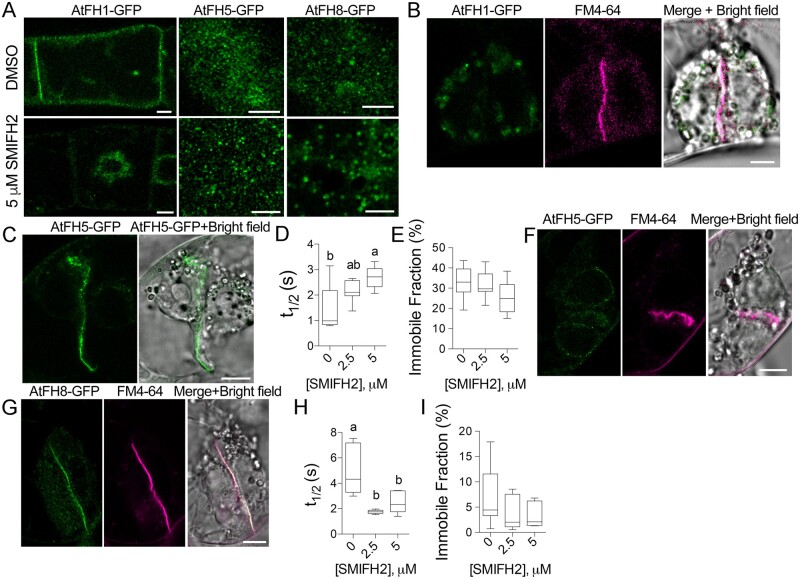
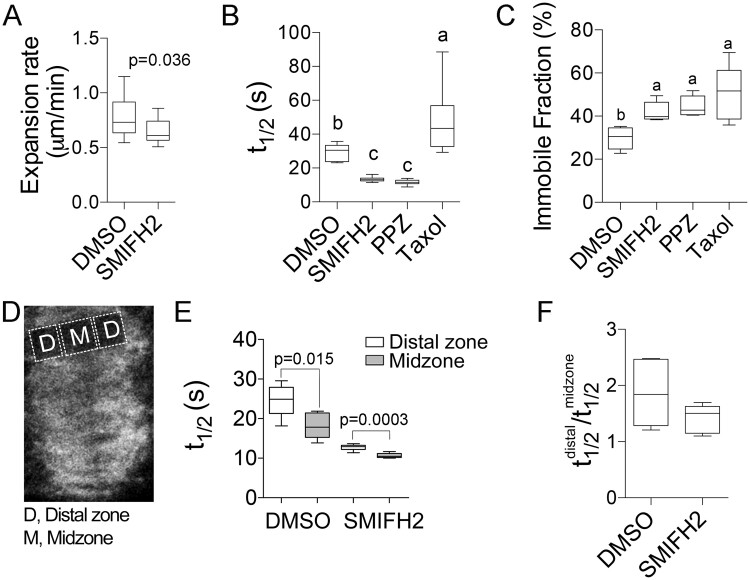
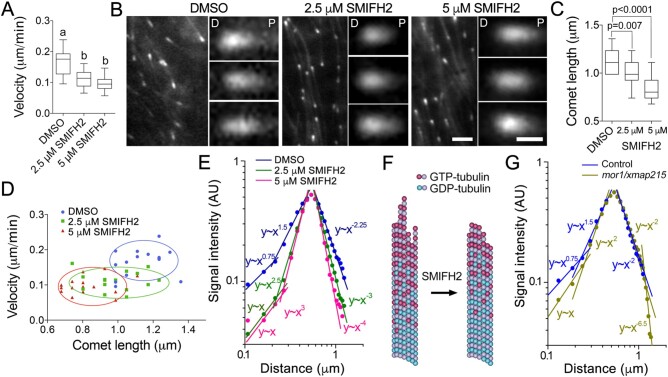
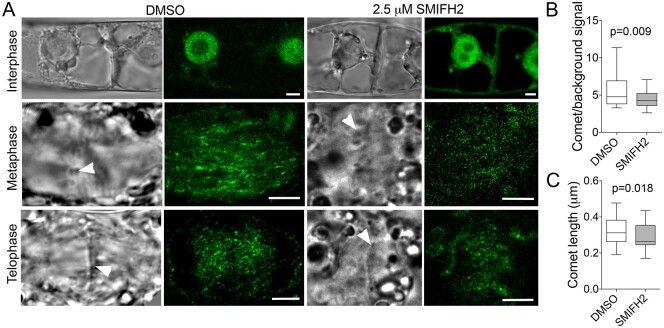
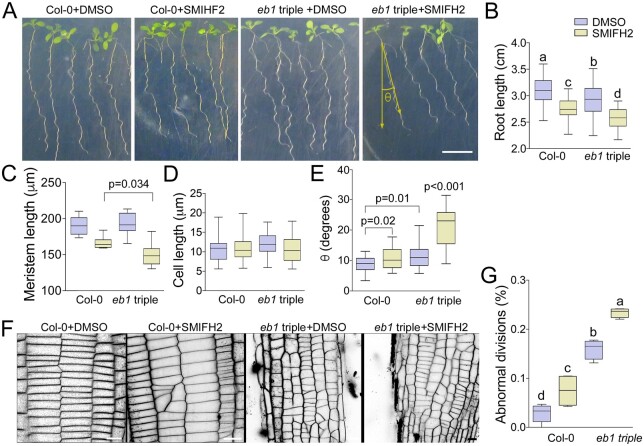
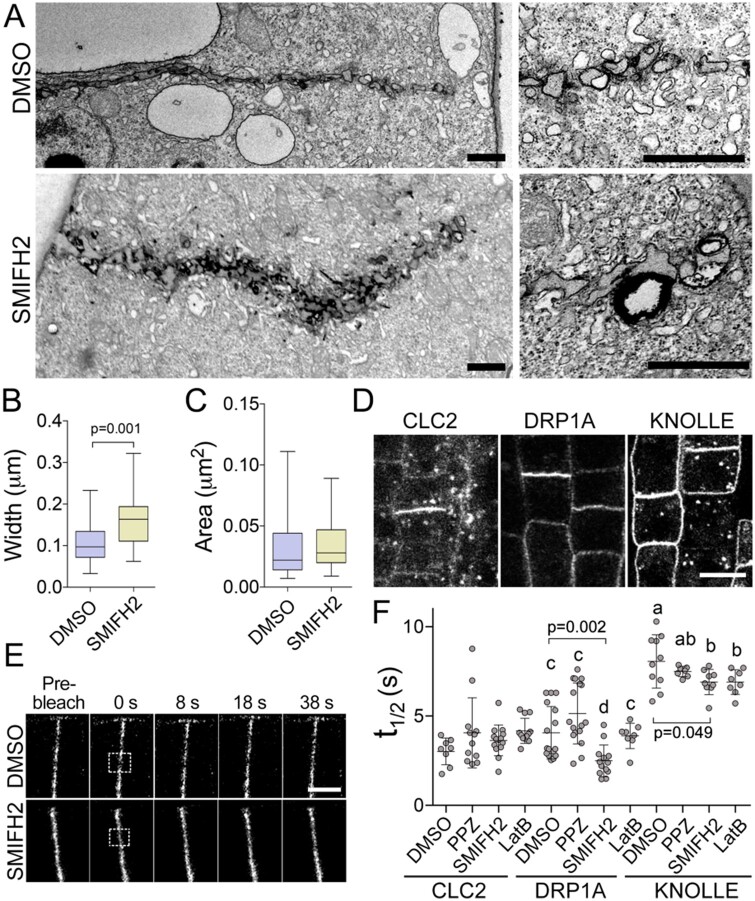
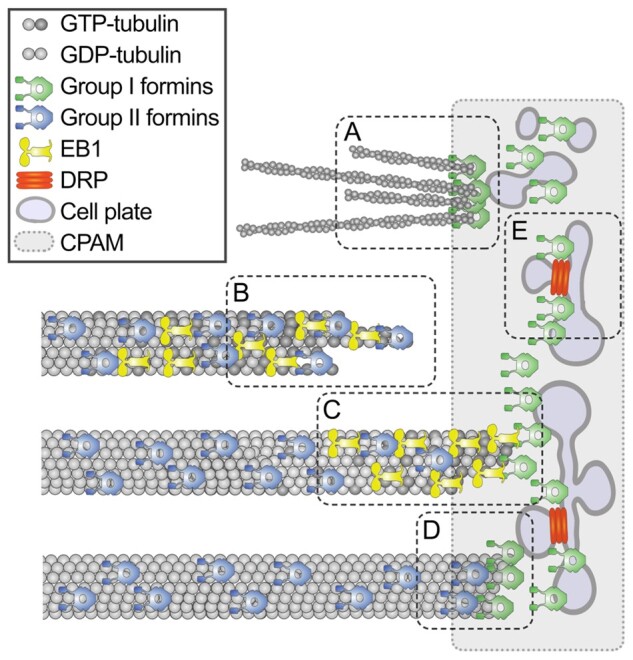
The phragmoplast separates daughter cells during cytokinesis by constructing the cell plate, which depends on interaction between cytoskeleton and membrane compartments. Proteins responsible for these interactions remain unknown, but formins can link cytoskeleton with membranes and several members of formin protein family localize to the cell plate. Progress in functional characterization of formins in cytokinesis is hindered by functional redundancies within the large formin gene family. We addressed this limitation by employing Small Molecular Inhibitor of Formin Homology 2 (SMIFH2), a small-molecule inhibitor of formins. Treatment of tobacco (Nicotiana tabacum) tissue culture cells with SMIFH2 perturbed localization of actin at the cell plate; slowed down both microtubule polymerization and phragmoplast expansion; diminished association of dynamin-related proteins with the cell plate independently of actin and microtubules; and caused cell plate swelling. Another impact of SMIFH2 was shortening of the END BINDING1b (EB1b) and EB1c comets on the growing microtubule plus ends in N. tabacum tissue culture cells and Arabidopsis thaliana cotyledon epidermis cells. The shape of the EB1 comets in the SMIFH2-treated cells resembled that of the knockdown mutant of plant Xenopus Microtubule-Associated protein of 215 kDa (XMAP215) homolog MICROTUBULE ORGANIZATION 1/GEMINI 1 (MOR1/GEM1). This outcome suggests that formins promote elongation of tubulin flares on the growing plus ends. Formins AtFH1 (A. thaliana Formin Homology 1) and AtFH8 can also interact with EB1. Besides cytokinesis, formins function in the mitotic spindle assembly and metaphase to anaphase transition. Our data suggest that during cytokinesis formins function in: (1) promoting microtubule polymerization; (2) nucleating F-actin at the cell plate; (3) retaining dynamin-related proteins at the cell plate; and (4) remodeling of the cell plate membrane.


Figures

Figure 1
Figure 1
SMIFH2 inhibits BY-2 cell growth. A, Morphology of BY-2 cells after 5-d treatment with different concentrations of SMIFH2. Scale bar, 50 µm. B, Impact of SMIFH2 on cell growth rate. Relative fresh weight of BY-2 cells was measured after 5-d treatment with SMIFH2. Cultures treated with carrier (DMSO) were taken as 100%. C, Representative images of BY-2 cells stained with fluorescein diacetate (FDA; green, alive) and FM4-64 (purple, dead) from cultures treated for 5 d with DMSO or SMIFH2. Scale bar, 100 µm. D, Viability of BY-2 cells after treatment with DMSO or SMIFH2 for 5 d. Error bars in B and D show standard deviation of three independent replicates containing three technical repeats (n = 3). Asterisks denote samples that are significantly different from the DMSO-treated control (t test P < 0.05).
Figure 2
Figure 2
Impact of SMIFH2 on cell division. A, Frequency of cells in prophase plus metaphase, anaphase, or telophase at different concentrations of SMIFH2 following propyzamide washout. At least 300 cells were scored for each time point and the treatment. B, Representative images of DNA staining in cells taken at 30 min or 4 h after treatment with DMSO or 10 µM SMIFH2 in the experiment presented in panel A. Scale bar, 25 µm. A, anaphase; I, interphase; P+M, prophase and metaphase, PF, prophase. Arrowheads indicate aggregated condensed chromosomes in cells treated with SMIFH2 for 4 h. C, GFP-Lifeact labels G- and F-actin in metaphase (parts 1 and 2) or telophase (parts 3 and 4) cells after treatment with DMSO or 10 µM SMIFH2 for 3 h. Parts 1 and 2 show metaphase cells, and 3 and 4 show telophase cells. Cells were imaged using confocal microscope. Scale bars, 5 µm. Arrows denote condensed chromosomes. Arrowheads denote the midzone. D, Representative images of cell plates following treatment with DMSO or SMIFH2 (2.5 µM) for 3 h. Confocal images of BY-2 cells expressing SCAMP2-mCherry. Scale bar, 10 µm. E, The frequency of abnormal cell plates (shown in D) among cytokinetic cells treated with SMIFH2. Thirty cells were counted per each treatment.
Figure 3
Figure 3
Localization and dynamics of formins in the cells treated with SMIFH2. A, A single optical section through the center of an interphase cells expressing AtFH1-GFP, and maximal projection of several optical sections through the plasma membrane of cells expressing AtFH5-GFP or AtFH8-GFP following treatment with DMSO or 5 µM SMIFH2 for 3 h. Scale bars, 5 µm. B, AtFH1-GFP does not localize to the cell plate after treatment with 2.5 µM SMIFH2 for 3 h. Scale bar, 5 µm. C, A representative image of AtFH5-GFP in the cell plate following treatment with 5 µM SMIFH2. Scale bar, 10 µm. D and E, Turnover rate (t1/2) and the immobile fraction of AtFH5-GFP on the cell plate in cells treated with DMSO, 2.5 µM SMIFH2, or 5 µM SMIFH2 for 3 h. Different letters denote significant difference between the datasets according to one-way ANOVA. At least six phragmoplasts were analyzed per each dataset. F and G, Representative images of cell plates without (F) or with (G) AtFH8-GFP signal following treatment with 5 µM SMIFH2 for 3 h. Scale bars, 10 µm. H and I, Turnover rate (t1/2) and the immobile fraction of AtFH8-GFP on the cell plate in cells treated with DMSO, 2.5 µM SMIFH2, or 5 µM SMIFH2 for 3 h. Different letters denote significant difference between the datasets according to one-way ANOVA. At least six phragmoplasts were analyzed per each dataset.
Figure 4
Figure 4
Effects of SMIFH2 on phragmoplast microtubule dynamics in BY-2 cells. A, Phragmoplast expansion rate. B and C, Phragmoplast microtubule turnover (t1/2; B) and tubulin immobile fraction (C) in cells treated with SMIFH2, 1 µM propyzamide (PPZ), or 5 µM taxol. D and E, Schematic showing location of the phragmoplast distal zone and midzone regions for measuring microtubule turnover in cells expressing GFP-NtTUA1 (D). Microtubule turnover in different phragmoplast zones (E). F, Ratio of t1/2 in distal zone to midzone. The concentration of SMIFH2 in all experiments was 2.5 µM and treatment time was 3 h. Whiskers denote minimal to maximal range of values. P-values were calculated using Mann–Whitney U test. Different letters denote statistically different values determined by one-way ANOVA. At least five cells were measured for each treatment.
Figure 5
Figure 5
SMIFH2 inhibits microtubule polymerization and alters EB1 plus-end localization. A, Microtubule polymerization rates in interphase BY-2 cells treated with DMSO (mock) or SMIFH2. Cells were treated with SMIFH2 for 3 h in all experiments shown in this figure. B, Confocal microscopic images of mCherry-AtEB1b in interphase BY-2 cells. The distal or proximal comet ends are denoted by letter D and P respectively. Scale bar are 2 µm or 0.5 µm on zoomed images. C, Average mCherry-AtEB1b comet lengths in cells treated with DMSO, 2.5 or 5 µM SMIFH2. D, Relationships between microtubule polymerization rates and mCherry-AtEB1b comet lengths in cells treated with DMSO and SMIFH2. Each data point represents measurement of one comet. E, Impact of SMIFH2 on mCherry-AtEB1b comet shape. X-axis in E and G shows absolute distance from the distal to the proximal ends of the EB1 comet, y-axis shows normalized fluorescence signal intensity. F, A model of SMIFH2 activity. SMIFH2 reduces the length of tubulin protofilament “flares” and increases β-tubulin GTP hydrolysis rate resulting in less GTP-tubulin in the microtubule lattice to which EB1 binds. G, Analysis of ProEB1::EB1b-GFP comet shapes in Arabidopsis mor1-1 mutant dark-grown hypocotyl epidermis cells compared to wild-type. Whiskers in A and C denote minimal to maximal range of values. Statistically different average values are denoted by different letters as determined by one-way ANOVA test. P-value was calculated using unpaired t test (n = 15).
Figure 6
Figure 6
Impact of SMIFH2 on AtEB1c-GFP comet size and intensity during cell division. A, Confocal microscopic images (right) showing SMIFH2 does not affect nuclear localization of AtEB1c-GFP in BY-2 cells during interphase, but results in less intensive labeling of comets during both metaphase and telophase. Scale bars, 5 µm. Arrowheads in bright-field images (left) denote position of chromosomes during metaphase and cell plate during telophase. B, The ratio of signal intensity of AtEB1c-GFP comets to the background signal in phragmoplasts of BY-2 cells treated with DMSO or 2.5 µM SMIFH2. P-value was calculated using unpaired t test (n = 31). Whiskers in B and C denote minimal to maximal range of values. C, Size of AtEB1c-GFP comets in the phragmoplasts of BY-2 cells treated with DMSO or 2.5 µM SMIFH2. P-value was calculated using unpaired t test (n = 31). Cells were treated with SMIFH2 for 3 h in all experiments.
Figure 7
Figure 7
Formins and EB1s cooperate in regulating root development. A, Representative images f Arabidopsis wild-type Col-0 and Ateb1a Ateb1b Ateb1c triple mutant roots grown on vertically oriented agar media supplemented with DMSO or SMIFH2 (viewed through the agar). Scale bar, 1 cm. B–E, Measurements of root lengths (B), root apical meristem lengths (C), epidermal cell lengths (D), and deviation of root growth trajectories from the gravity vector, n > 21 (E). F, Impact of SMIFH2 on cell division patterns in wild type and Ateb1 triple mutant roots, visualized with FM4-64 staining and confocal microscopy. Scale bar, 20 µm. G, Frequencies of abnormal cell divisions in wild type and Ateb1 triple mutant roots after treatment with DMSO (mock) or SMIFH2. Roots were treated with 10 µM SMIFH2 in all experiments, n = 6. Whiskers denote minimal to maximal range of values. Statistically different average values are denoted by different letters as determined by one-way ANOVA test. P-values were calculated using unpaired t test.
Figure 8
Figure 8
SMIFH2 inhibits cell plate membrane remodeling. A, Electron microscopic images of cell plate morphologies in BY-2 cells after treatment with 2.5 µM SMIFH2 for 3 h. Scale bar, 1 µm. B, Statistical analysis of cell plate morphology using electron micrographs. P-value was calculated using unpaired t test (n = 28). C, Area of the individual vesicles at the growing edge of the cell plate in BY-2 cells treated with DMSO or 2.5 µM SMIFH2 (n = 28). Whiskers denote minimal to maximal range of values. D, Confocal microscopy images showing CLC2-GFP, DRP1A-GFP, and KNOLLE-GFP localization to the cell plates of Arabidopsis root epidermal cells. Scale bar, 5 µm. E, Representative confocal time-lapse images of photobleaching experiments in Arabidopsis root apical meristem cells expressing DRP1A-GFP after treatment with DMSO or 25 µM SMIFH2. The photobleached areas are indicated by the rectangles. Scale bar, 5 µm. F, Turnover of CLC2-GFP, DRP1A-GFP, and KNOLLE-GFP in root epidermis cell after treatment with 0.5% (v/v) DMSO, 10 µM SMIFH2, 5 µM propyzamide (PPZ), or 5 µM latruncnulin B (LatB) for 6 h. Significantly different average values are denoted by different letters as determined by one-way ANOVA test.
Figure 9
Figure 9
Model of formin localization and functions during cytokinesis. During cytokinesis group I formins localize on the cell plate membrane and in the cell plate assembly matrix; group II formins localize on microtubules. The first function of formins is nucleating F-actin by the cell plate (A). The second function is promoting microtubule elongation by stabilizing tubulin protofilament flares on the growing plus-tips (B). When microtubule tip approaches the cell plate, formins dock the microtubule tip to the cell plate assembly matrix (CPAM) through interaction with EB1 proteins (C). Formins localized within CPAM and on the cell plate stabilizes microtubule plus-ends (D). Formins can also contribute to the cell plate membrane recycling by facilitating recruitment of DRPs to the cell plate through yet unknown mechanism (E). Only one-half of the phragmoplast is shown in the model.

Comment in

Similar articles

Cited by

References

    1. Akhmanova A, Steinmetz MO (2008) Tracking the ends: a dynamic protein network controls the fate of microtubule tips. Nat Rev Mol Cell Biol 9: 309–322 - PubMed
    1. Asada T, Sonobe S, Shibaoka H (1991) Microtubule translocation in the cytokinetic apparatus of cultured tobacco cells. Nature 350: 238–241
    1. Austin JR II, Segui-Simarro JM, Staehelin LA (2005) Quantitative analysis of changes in spatial distribution and plus-end geometry of microtubules involved in plant-cell cytokinesis. J Cell Sci 118: 3895–3903 - PubMed
    1. Bajer A (1968) Fine structure studies on phragmoplast and cell plate formation. Chromosoma 24: 383–417
    1. Baluska F, Jasik J, Edelmann HG, Salajova T, Volkmann D (2001) Latrunculin B-induced plant dwarfism: Plant cell elongation is F-actin-dependent. Dev Biol 231: 113–124 - PubMed

Publication types

MeSH terms

LinkOut - more resources