

Proteomics signature of autoimmune atrophic gastritis: towards a link with gastric cancer
- PMID: 33620602
- PMCID: PMC8064991
- DOI: 10.1007/s10120-020-01148-3
Proteomics signature of autoimmune atrophic gastritis: towards a link with gastric cancer
Abstract
Background: Autoimmune atrophic gastritis (AAG) is a chronic disease that can progress to gastric cancer (GC). To better understand AAG pathology, this proteomics study investigated gastric proteins whose expression levels are altered in this disease and also in GC.
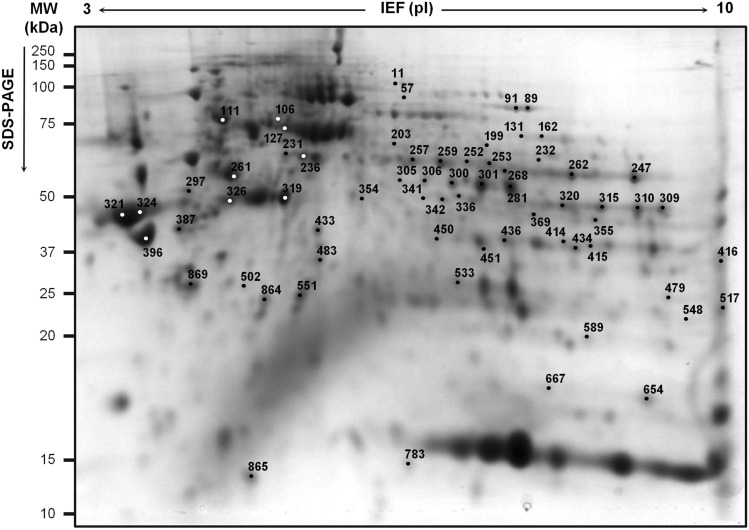
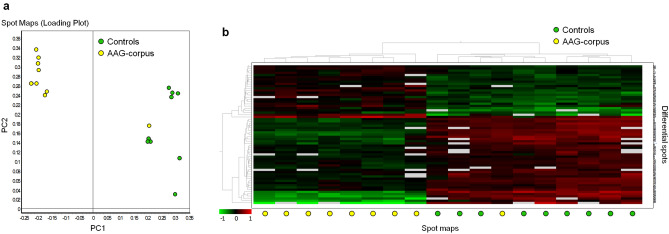
Methods: Using two-dimensional difference gel electrophoresis (2D-DIGE), we compared protein maps of gastric corpus biopsies from AAG patients and controls. Differentially abundant spots (|fold change|≥ 1.5, P < 0.01) were selected and identified by LC-MS/MS. The spots were further assessed in gastric antrum biopsies from AAG patients (without and with Helicobacter pylori infection) and from GC patients and unaffected first-degree relatives of GC patients.
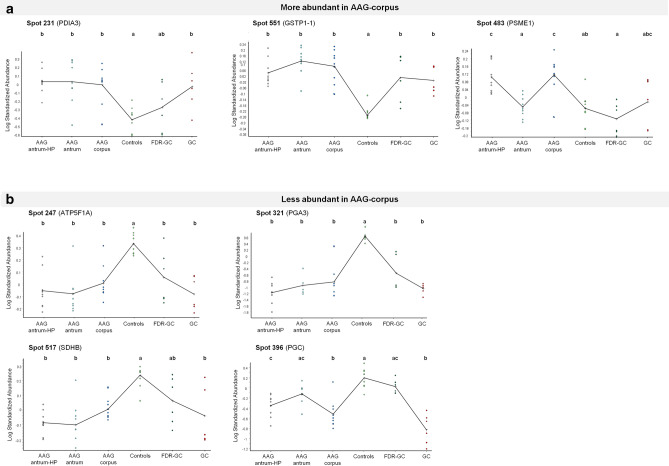
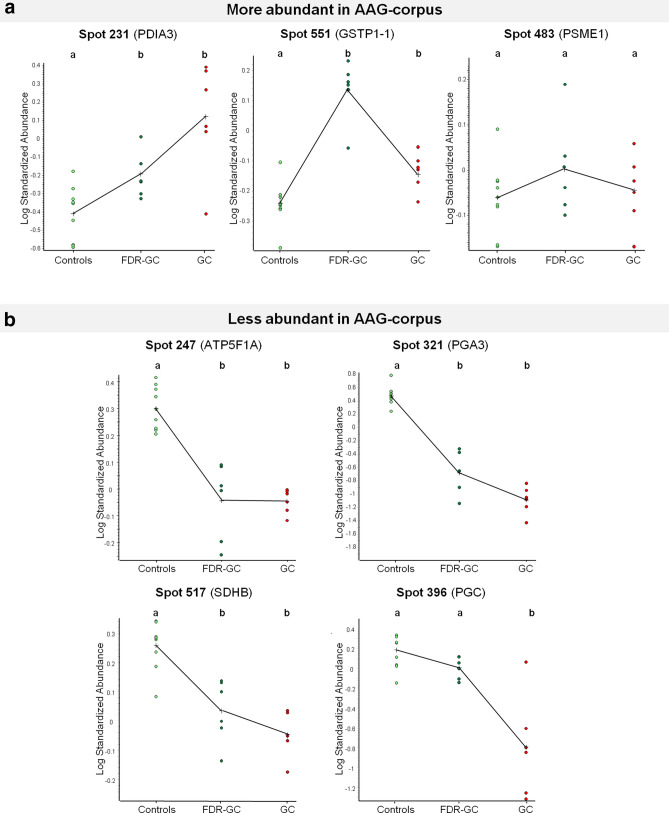
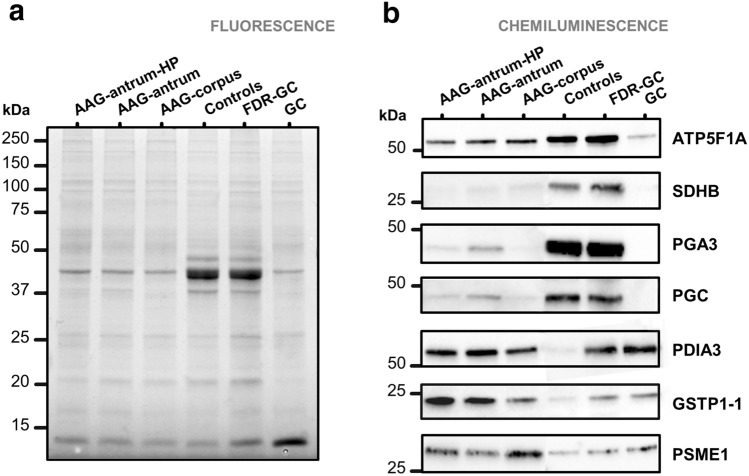
Results: 2D-DIGE identified 67 differentially abundant spots, with 28 more and 39 less abundant in AAG-corpus than controls. LC-MS/MS identified these as 53 distinct proteins. The most significant (adjusted P < 0.01) biological process associated with the less abundant proteins was "tricarboxylic acid cycle". Of the 67 spots, 57 were similarly differentially abundant in AAG-antrum biopsies irrespective of H. pylori infection status. The differential abundance was also observed in GC biopsies for 14 of 28 more abundant and 35 of 39 less abundant spots, and in normal gastric biopsies of relatives of GC patients for 6 and 25 spots, respectively. Immunoblotting confirmed the different expression levels of two more abundant proteins (PDIA3, GSTP gene products) and four less abundant proteins (ATP5F1A, PGA3, SDHB, PGC).
Conclusion: This study identified a proteomics signature of AAG. Many differential proteins were shared by GC and may be involved in the progression of AAG to GC.
Keywords: Autoimmune disease; Biological markers; Gastric cancer; Gastritis; Proteomics.
Conflict of interest statement
The authors disclose no competing interests.
Figures
Similar articles
-
Protein signature characterizing Helicobacter pylori strains of patients with autoimmune atrophic gastritis, duodenal ulcer and gastric cancer.Infect Agent Cancer. 2017 Apr 27;12:22. doi: 10.1186/s13027-017-0133-x. eCollection 2017. Infect Agent Cancer. 2017. PMID: 28465717 Free PMC article.
-
Differential proteomics of Helicobacter pylori associated with autoimmune atrophic gastritis.Mol Med. 2014 Feb 28;20(1):57-71. doi: 10.2119/molmed.2013.00076. Mol Med. 2014. PMID: 24395566 Free PMC article.
-
Antral-type mucosa in the gastric incisura, body, and fundus (antralization): a link between Helicobacter pylori infection and intestinal metaplasia?Am J Gastroenterol. 2000 Jan;95(1):114-21. doi: 10.1111/j.1572-0241.2000.01609.x. Am J Gastroenterol. 2000. PMID: 10638568
-
Gastric atrophy, metaplasia, and dysplasia: a clinical perspective.J Clin Gastroenterol. 2003 May-Jun;36(5 Suppl):S29-36; discussion S61-2. doi: 10.1097/00004836-200305001-00006. J Clin Gastroenterol. 2003. PMID: 12702963 Review.
-
[Atrophic gastritis caused by Helicobacter pylori as a precancer disease].Arkh Patol. 2004 Nov-Dec;66(6):57-60. Arkh Patol. 2004. PMID: 15648171 Review. Russian.
Cited by
-
Clinicopathological characteristics of early gastric cancer associated with autoimmune gastritis.JGH Open. 2021 Sep 16;5(10):1210-1215. doi: 10.1002/jgh3.12656. eCollection 2021 Oct. JGH Open. 2021. PMID: 34622010 Free PMC article.
-
Case Report: Two Is Not (Always) Better Than One: Pyloric Gland Adenoma of the Gastric Cardia and Concurrent Neuroendocrine Cell Dysplasia Arising From Autoimmune Gastritis.Front Med (Lausanne). 2022 May 19;9:890794. doi: 10.3389/fmed.2022.890794. eCollection 2022. Front Med (Lausanne). 2022. PMID: 35665334 Free PMC article.
-
Incidence of Gastric Neoplasms Arising from Autoimmune Metaplastic Atrophic Gastritis: A Systematic Review and Case Reports.J Clin Med. 2023 Jan 30;12(3):1062. doi: 10.3390/jcm12031062. J Clin Med. 2023. PMID: 36769710 Free PMC article.
-
Bioinformatics- and quantitative proteomics-based identification of gastric adenocarcinoma-related proteins and analysis.Am J Cancer Res. 2024 Nov 15;14(11):5286-5303. doi: 10.62347/BVFO4627. eCollection 2024. Am J Cancer Res. 2024. PMID: 39659938 Free PMC article.
-
Autoimmune gastritis concomitant with gastric adenoma and subacute combined degeneration of the spinal cord.BMJ Case Rep. 2021 May 11;14(5):e242836. doi: 10.1136/bcr-2021-242836. BMJ Case Rep. 2021. PMID: 33975851 Free PMC article.
References
-
- Lenti MV, Rugge M, Lahner E, Miceli E, Toh BH, Genta RM, et al. Autoimmune gastritis. Nat Rev Dis Primers. 2020;6:56. - PubMed
-
- Di Sabatino A, Lenti MV, Giuffrida P, Vanoli A, Corazza GR. New insights into immune mechanisms underlying autoimmune diseases of the gastrointestinal tract. Autoimmun Rev. 2015;14:1161–1169. - PubMed
-
- Mårdh S, Song YH. Characterization of antigenic structures in auto-immune atrophic gastritis with pernicious anaemia. The parietal cell H, K-ATPase and the chief cell pepsinogen are the two major antigens. Acta Physiol Scand. 1989;136:581–587. - PubMed
-
- Lahner E, Norman GL, Severi C, Encabo S, Shums Z, Vannella L, et al. Reassessment of intrinsic factor and parietal cell autoantibodies in atrophic gastritis with respect to cobalamin deficiency. Am J Gastroenterol. 2009;104:2071–2079. - PubMed
-
- Chlumska A, Boudova L, Benes Z, Zámecník M. Autoimmune gastritis. A clinicopathologic study of 25 cases. Cesk Patol. 2005;41(4):137–142. - PubMed
MeSH terms
Grants and funding
LinkOut - more resources
Full Text Sources
Other Literature Sources
Medical
Research Materials
Miscellaneous
