

Short-Range Forecasting of COVID-19 During Early Onset at County, Health District, and State Geographic Levels Using Seven Methods: Comparative Forecasting Study
- PMID: 33621186
- PMCID: PMC7990039
- DOI: 10.2196/24925
Short-Range Forecasting of COVID-19 During Early Onset at County, Health District, and State Geographic Levels Using Seven Methods: Comparative Forecasting Study
Abstract
Background: Forecasting methods rely on trends and averages of prior observations to forecast COVID-19 case counts. COVID-19 forecasts have received much media attention, and numerous platforms have been created to inform the public. However, forecasting effectiveness varies by geographic scope and is affected by changing assumptions in behaviors and preventative measures in response to the pandemic. Due to time requirements for developing a COVID-19 vaccine, evidence is needed to inform short-term forecasting method selection at county, health district, and state levels.
Objective: COVID-19 forecasts keep the public informed and contribute to public policy. As such, proper understanding of forecasting purposes and outcomes is needed to advance knowledge of health statistics for policy makers and the public. Using publicly available real-time data provided online, we aimed to evaluate the performance of seven forecasting methods utilized to forecast cumulative COVID-19 case counts. Forecasts were evaluated based on how well they forecast 1, 3, and 7 days forward when utilizing 1-, 3-, 7-, or all prior-day cumulative case counts during early virus onset. This study provides an objective evaluation of the forecasting methods to identify forecasting model assumptions that contribute to lower error in forecasting COVID-19 cumulative case growth. This information benefits professionals, decision makers, and the public relying on the data provided by short-term case count estimates at varied geographic levels.
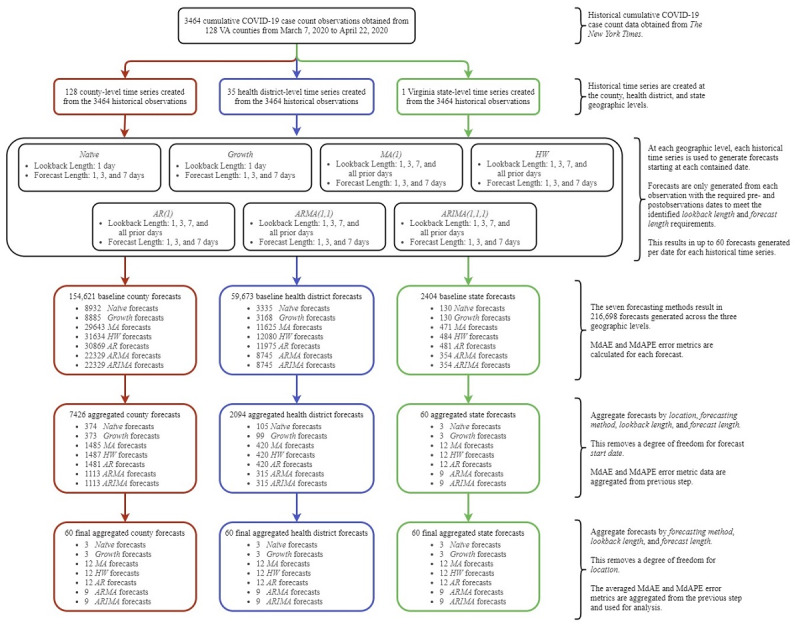
Methods: We created 1-, 3-, and 7-day forecasts at the county, health district, and state levels using (1) a naïve approach, (2) Holt-Winters (HW) exponential smoothing, (3) a growth rate approach, (4) a moving average (MA) approach, (5) an autoregressive (AR) approach, (6) an autoregressive moving average (ARMA) approach, and (7) an autoregressive integrated moving average (ARIMA) approach. Forecasts relied on Virginia's 3464 historical county-level cumulative case counts from March 7 to April 22, 2020, as reported by The New York Times. Statistically significant results were identified using 95% CIs of median absolute error (MdAE) and median absolute percentage error (MdAPE) metrics of the resulting 216,698 forecasts.
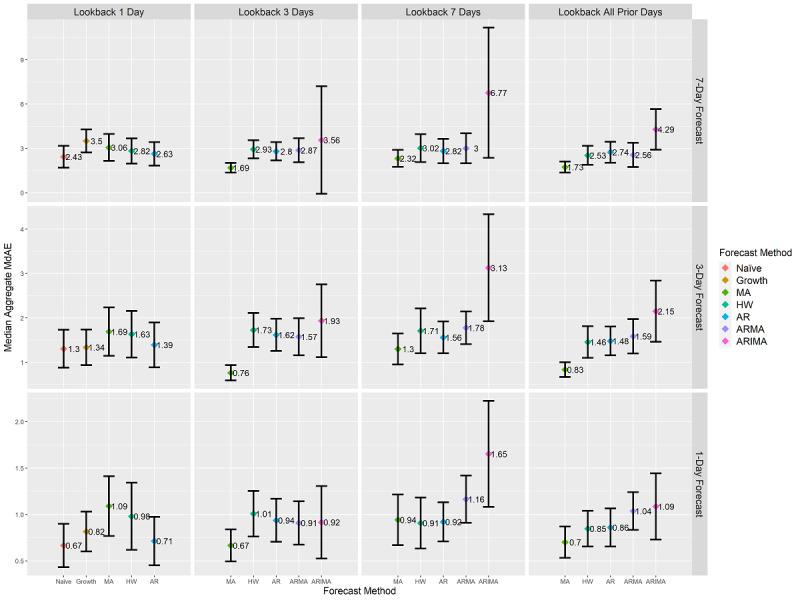
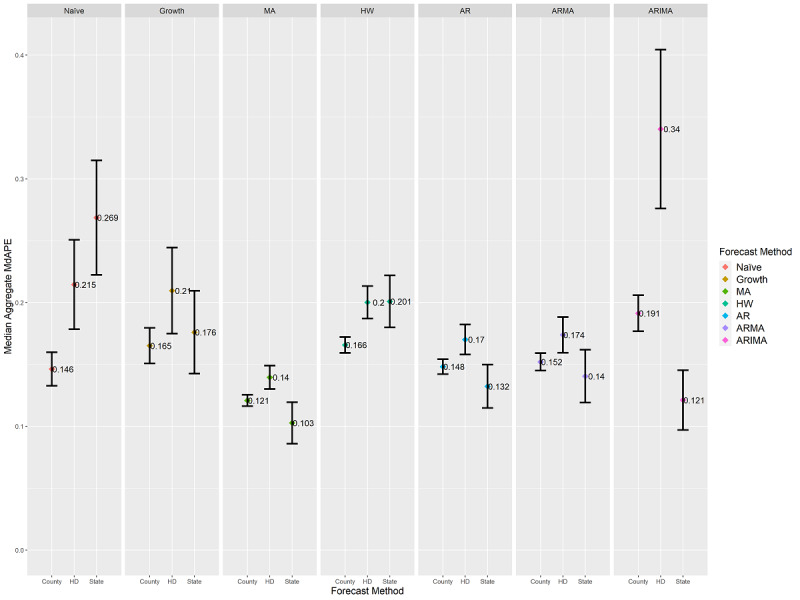
Results: The next-day MA forecast with 3-day look-back length obtained the lowest MdAE (median 0.67, 95% CI 0.49-0.84, P<.001) and statistically significantly differed from 39 out of 59 alternatives (66%) to 53 out of 59 alternatives (90%) at each geographic level at a significance level of .01. For short-range forecasting, methods assuming stationary means of prior days' counts outperformed methods with assumptions of weak stationarity or nonstationarity means. MdAPE results revealed statistically significant differences across geographic levels.
Conclusions: For short-range COVID-19 cumulative case count forecasting at the county, health district, and state levels during early onset, the following were found: (1) the MA method was effective for forecasting 1-, 3-, and 7-day cumulative case counts; (2) exponential growth was not the best representation of case growth during early virus onset when the public was aware of the virus; and (3) geographic resolution was a factor in the selection of forecasting methods.
Keywords: COVID-19; coronavirus disease 2019; emerging outbreak; forecasting; infectious disease; modeling and simulation; modeling disease outbreaks; public health.
©Christopher J Lynch, Ross Gore. Originally published in the Journal of Medical Internet Research (http://www.jmir.org), 23.03.2021.
Conflict of interest statement
Conflicts of Interest: None declared.
Figures
Similar articles
-
Application of one-, three-, and seven-day forecasts during early onset on the COVID-19 epidemic dataset using moving average, autoregressive, autoregressive moving average, autoregressive integrated moving average, and naïve forecasting methods.Data Brief. 2021 Apr;35:106759. doi: 10.1016/j.dib.2021.106759. Epub 2021 Jan 15. Data Brief. 2021. PMID: 33521186 Free PMC article.
-
A COVID-19 Pandemic Artificial Intelligence-Based System With Deep Learning Forecasting and Automatic Statistical Data Acquisition: Development and Implementation Study.J Med Internet Res. 2021 May 20;23(5):e27806. doi: 10.2196/27806. J Med Internet Res. 2021. PMID: 33900932 Free PMC article.
-
Predictive performance of multi-model ensemble forecasts of COVID-19 across European nations.Elife. 2023 Apr 21;12:e81916. doi: 10.7554/eLife.81916. Elife. 2023. PMID: 37083521 Free PMC article.
-
Predictive Models for Forecasting Public Health Scenarios: Practical Experiences Applied during the First Wave of the COVID-19 Pandemic.Int J Environ Res Public Health. 2022 May 3;19(9):5546. doi: 10.3390/ijerph19095546. Int J Environ Res Public Health. 2022. PMID: 35564940 Free PMC article.
-
Forecasting and Surveillance of COVID-19 Spread Using Google Trends: Literature Review.Int J Environ Res Public Health. 2022 Sep 29;19(19):12394. doi: 10.3390/ijerph191912394. Int J Environ Res Public Health. 2022. PMID: 36231693 Free PMC article. Review.
Cited by
-
Forecasting COVID-19 Hospital Census: A Multivariate Time-Series Model Based on Local Infection Incidence.JMIR Public Health Surveill. 2021 Aug 4;7(8):e28195. doi: 10.2196/28195. JMIR Public Health Surveill. 2021. PMID: 34346897 Free PMC article.
-
Spatial-Temporal Relationship Between Population Mobility and COVID-19 Outbreaks in South Carolina: Time Series Forecasting Analysis.J Med Internet Res. 2021 Apr 13;23(4):e27045. doi: 10.2196/27045. J Med Internet Res. 2021. PMID: 33784239 Free PMC article.
-
Emergency Physician Twitter Use in the COVID-19 Pandemic as a Potential Predictor of Impending Surge: Retrospective Observational Study.J Med Internet Res. 2021 Jul 14;23(7):e28615. doi: 10.2196/28615. J Med Internet Res. 2021. PMID: 34081612 Free PMC article.
-
Monitoring User Opinions and Side Effects on COVID-19 Vaccines in the Twittersphere: Infodemiology Study of Tweets.J Med Internet Res. 2022 May 13;24(5):e35115. doi: 10.2196/35115. J Med Internet Res. 2022. PMID: 35446781 Free PMC article.
-
Risk of SARS-CoV-2 transmission in the close contacts in a small rural area in the Veneto Region (NE-Italy): past evidence for future scenarios.Front Public Health. 2023 Sep 5;11:1223109. doi: 10.3389/fpubh.2023.1223109. eCollection 2023. Front Public Health. 2023. PMID: 37732097 Free PMC article.
References
-
- Li Q, Guan X, Wu P, Wang X, Zhou L, Tong Y, Ren R, Leung KSM, Lau EHY, Wong JY, Xing X, Xiang N, Wu Y, Li C, Chen Q, Li D, Liu T, Zhao J, Liu M, Tu W, Chen C, Jin L, Yang R, Wang Q, Zhou S, Wang R, Liu H, Luo Y, Liu Y, Shao G, Li H, Tao Z, Yang Y, Deng Z, Liu B, Ma Z, Zhang Y, Shi G, Lam TTY, Wu JT, Gao GF, Cowling BJ, Yang B, Leung GM, Feng Z. Early transmission dynamics in Wuhan, China, of novel coronavirus-infected pneumonia. N Engl J Med. 2020 Mar 26;382(13):1199–1207. doi: 10.1056/NEJMoa2001316. http://europepmc.org/abstract/MED/31995857 - DOI - PMC - PubMed
-
- Wu Z, McGoogan JM. Characteristics of and important lessons from the coronavirus disease 2019 (COVID-19) outbreak in China: Summary of a report of 72 314 cases from the Chinese Center for Disease Control and Prevention. JAMA. 2020 Apr 07;323(13):1239–1242. doi: 10.1001/jama.2020.2648. - DOI - PubMed
-
- Roosa K, Lee Y, Luo R, Kirpich A, Rothenberg R, Hyman J, Yan P, Chowell G. Real-time forecasts of the COVID-19 epidemic in China from February 5th to February 24th, 2020. Infect Dis Model. 2020;5:256–263. doi: 10.1016/j.idm.2020.02.002. https://linkinghub.elsevier.com/retrieve/pii/S2468-0427(20)30005-1 - DOI - PMC - PubMed
-
- Petropoulos F, Makridakis S. Forecasting the novel coronavirus COVID-19. PLoS One. 2020;15(3):e0231236. doi: 10.1371/journal.pone.0231236. https://dx.plos.org/10.1371/journal.pone.0231236 - DOI - DOI - PMC - PubMed
-
- Dong E, Du H, Gardner L. An interactive web-based dashboard to track COVID-19 in real time. Lancet Infect Dis. 2020 May;20(5):533–534. doi: 10.1016/S1473-3099(20)30120-1. http://europepmc.org/abstract/MED/32087114 - DOI - PMC - PubMed
Publication types
MeSH terms
LinkOut - more resources
Full Text Sources
Other Literature Sources
Medical
Research Materials
Miscellaneous
