. 2021 Apr 8;6(7):e146883.
doi: 10.1172/jci.insight.146883.

Highly multiplexed 2-dimensional imaging mass cytometry analysis of HBV-infected liver

Affiliations

Highly multiplexed 2-dimensional imaging mass cytometry analysis of HBV-infected liver

Daniel Traum et al. JCI Insight. .

Abstract

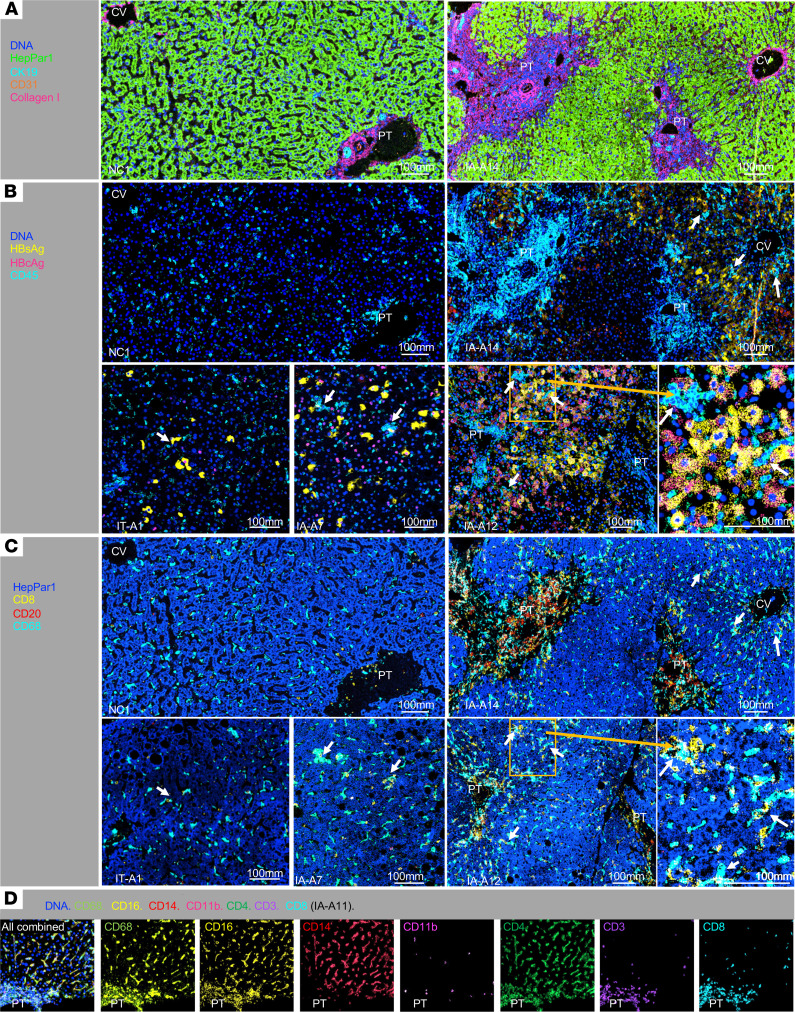
Studies of human hepatitis B virus (HBV) immune pathogenesis are hampered by limited access to liver tissues and technologies for detailed analyses. Here, utilizing imaging mass cytometry (IMC) to simultaneously detect 30 immune, viral, and structural markers in liver biopsies from patients with hepatitis B e antigen+ (HBeAg+) chronic hepatitis B, we provide potentially novel comprehensive visualization, quantitation, and phenotypic characterizations of hepatic adaptive and innate immune subsets that correlated with hepatocellular injury, histological fibrosis, and age. We further show marked correlations between adaptive and innate immune cell frequencies and phenotype, highlighting complex immune interactions within the hepatic microenvironment with relevance to HBV pathogenesis.

Keywords: Adaptive immunity; Fibrosis; Hepatology; Infectious disease; Innate immunity.


Conflict of interest statement

Conflict of interest: The authors’ conflicts of interest can be found in the supplemental material (supplemental material available online with this article; https://doi.org/10.1172/jci.insight.146883DS1).

Figures

Figure 1
Figure 1. Visualizing multiple structural, immune, and viral markers in HBV-infected livers by image mass cytometry.
(A) Detection of hepatic structures with nuclear DNA (blue), HepPar1+ hepatocytes (green), CK19+ bile ducts (cyan), CD31+ endothelial cells (orange), and collagen I (pink) in a representative noninfected control (NC1) and chronic hepatitis B (CHB) IA (IA-A6) subject. Portal tract (PT) was defined by the presence of portal triad including CK19+ bile ducts, CD31+ hepatic artery, and portal vein with surrounding collagen I. Central vein (CV) was defined as a vascular structure with surrounding collagen without bile duct or hepatic artery. (B) Detection of viral and immune markers including HBsAg (yellow), HBcAg (pink), and CD45+ immune cells (cyan) with the same regions as A for NC1 and IA-A14, and additional CHB subjects (IT-A1, IA-A8, and IA-A12) with various patterns of HBsAg and HBcAg expression. White arrows indicate clusters of CD45+ immune cells close to hepatocytes expressing HBsAg and/or HBcAg. Orange inlay for IA-A12 provides a higher power view. (C) Detection of CD8+ T cells, CD20+ B cells, and CD68+ Kupffer cells. Regions in B are shown here with CD8 (yellow), CD20 (red), CD68 (cyan), and HepPar1 (blue), with increased CD20+ B cells, yellow CD8+ T cells, and cyan CD68+ cells in portal tracts (especially in IA-A14), and more diffuse lobular detection of cyan CD68+ cells. White arrows highlight CD45+ immune clusters near hepatocytes expressing HBsAg and/or HBcAg in B, with both yellow CD8+ T cells and cyan CD68+ Kupffer cells located in close contact. (D) Representative distribution for innate and adaptive immune markers in the liver. Colocalization of CD68, CD16, and CD14 in hepatic lobular region, with a similar pattern for CD4 expression (without associated CD3 expression). Relative paucity of CD14 expression compared with other markers (e.g., CD3, CD8, CD4, CD68, CD16) is noted in portal tract (PT).
Figure 2
Figure 2. Portal and lobular distribution of CD45+ immune cells quantified in chronic hepatitis B (CHB) and control liver tissues by IMC.
(A) Acquired IMC images are visualized in representative pseudocolor plots and histogram with overlays to show that HepPar1+ events can be gated separately from CD45+ events, and that CD45+ events are enriched for immune markers (e.g., CD3, CD8, CD68). Far right contour plot overlay shows that CD68+CD45+ gate (red) is enriched for concurrent CD16/CD14 expression, compared with CD68CD45+ gate (blue). (B) Representative contour plot and histogram overlays provide comparisons for portal (red) versus lobular (blue) detection of HepPar1, CD45, and/or CD3 expression, with expected lobular but not portal detection for HepPar1+ hepatocytes and both lobular and portal detection for CD45+ or CD3+ immune cells. (C) Overlay of lobular CD45HepPar1+ (green), lobular CD45+HepPar1 (purple), and all portal (orange) events show HBsAg expression limited to CD45HepPar1+ cells, CK19 expression limited to portal cells, and CD68 expression in both lobular CD45+HepPar1 immune cells and portal cells. (D) Tissue image reproduced with portal and/or lobular location of bile ducts, hepatocytes, and immune cells by applying x/y spatial coordinates to analyzed IMC data. (E) Scatter plots comparing %portal/total area, ALT, HBV DNA, and age relative to total, lobular, and portal CD45+ cell density per mm2 for 28 IA (red diamond) and 6 IT (blue X) subjects. A single outlier with portal CD45+ immune cell density at 43,365 was not shown graphically, although it was included in calculating the Spearman’s correlation and P values (shown in red fonts for P < 0.05). (F) Scatter plots comparing histological scores (Ishak lobular inflammation, Ishak portal inflammation, Ishak periportal hepatitis [piecemeal necrosis], Ishak fibrosis, and perisinusoidal fibrosis scores) with total, lobular, and portal CD45+ cell density per mm2 for 28 IA (red diamond) and 6 IT (blue X) subjects, with Spearman’s correlations and P values.
Figure 3
Figure 3. CD45+ adaptive and innate immune cells in the liver in HBV-infected and uninfected subjects.
(A) Stacked bar graphs show relative proportions of adaptive and innate immune subsets within total, lobular, and portal regions. (B) Hepatic concentrations of adaptive and innate immune subset per mm2 ROI are compared with each other, with Spearman’s correlation coefficients and P values shown in right upper part of each scatterplots. P < 0.0033 were considered significant and highlighted in red font. (C and D) Heatmaps showing Spearman’s correlation coefficients (rs) comparing total, lobular, and portal hepatic immune cell concentrations (in number of cells/mm2) to serum ALT (U/L), HBV DNA (log HBV DNA IU/mL), and histological Ishak scores among 28 IA and 6 IT subjects, and with %portal/total ROI as a measure of portal expansion. Correlations associated with P < 0.0083 are highlighted by bold font and black border. (E) Dot plots comparing 14 pediatric IA, 14 adult IA, 4 pediatric IT, and 2 adult IT subjects with chronic hepatitis B for median hepatic CD45+ immune cell density/mm2 in total, lobular, and portal region, with error bars indicating 25% and 75% IQRs. P values were calculated by Mann-Whitney U test. P < 0.00625 were considered significant and highlighted in red font. (F) Comparisons between age and total, lobular, and portal hepatic immune densities in 28 IA subjects, with Spearman’s correlation (rs) and P values shown in red font for P < 0.00625.
Figure 4
Figure 4. Phenotype of CD45+ immune subsets in the liver.
(A) Greater HLA DR and/or CD45RO expression by hepatic immune subsets from IA compared with IT subjects. Median percentages of cells expressing various phenotype markers within each immune subset are shown as a heatmap from IA (n = 28) and IT (n = 6) groups. Significant percentage differences between IA and IT subjects (with P values < 0.00625 by Mann-Whitney U test) are highlighted in bold font with thick borders. (B) Portal enrichment for immune subsets with activation phenotype. Heatmap represents percentages of lobular (L) and portal (P) immune subsets that express various phenotype markers from individual IA and IT subjects, with median percentages indicated for significant phenotype differences between lobular and portal immune subsets (P < 0.00625 by nonparametric signed-rank test). (C) Immune phenotype correlations with clinical and histological measures. Heatmaps show Spearman’s correlation coefficients (*rs) comparing serum ALT, HBV DNA, and age with percentages of cells expressing various markers in 6 CD45+ immune subsets. Correlations associated with significant P values below 0.0625 are indicated with thick/black borders. Positive and negative values of correlation coefficient corresponding to the red to blue colors are indicated for reference, with cutoff rs values (± 0.46) shown. P values associated with the correlation coefficients are provided in Supplemental Figure 4.
Figure 5
Figure 5. PhenoGraph analysis identifies distinct immune subclusters that correlate with serum ALT.
(A) PhenoGraph analysis of IMC data shown as: (left) a tSNE plot with 13 subclusters (S1–S13); (middle) a heatmap displaying expression of cellular markers; (right) 9 representative tSNE plots showing various marker expression. (B) Representative IMC images with PhenoGraph subcluster events shown as distinct dots (top); select antibody staining patterns in IMC images (middle); overlays of subcluster dots in red onto individual markers in green, with yellow color representing colocalization (bottom). Three images on the far left and bottom far right show background of HepPar1 in blue and collagen I in light gray to indicate hepatic architecture. (C) Scatter plots comparing cellular densities (cells/mm2 ROI) for immune subclusters on the x axis and manually gated CD45+ immune subsets on the y axis for 28 IA, 6 IT, and 10 NC subjects. Spearman’s correlation coefficients (rs) and P values are shown, with red font for P < 0.05. (D) Dot plots comparing hepatic densities of CD45-enriched subclusters between 28 IA and 6 IT subjects. Median values shown as red horizontal bars. P values by Mann-Whitney U tests with values < 0.00625 highlighted in red font. (E) Upper right half of the table shows Spearman’s correlation coefficients between immune subcluster densities as a heatmap (positive correlations in orange and negative correlations in blue) with corresponding P values in left bottom half, with significant P values highlighted in pink with red font (P < 0.00238 considered significant). (F) Scatter plots comparing subcluster densities (cells/mm2 ROI) on the x axis and serum ALT levels, HBV DNA, and Ishak histological scores on the y axis. Spearman’s correlation coefficients (rs) and P values are shown. Correlations with P < 0.0071 were considered significant and highlighted in red.

References

    1. Guidotti LG, Chisari FV. Immunobiology and pathogenesis of viral hepatitis. Annu Rev Pathol. 2006;1:23–61. doi: 10.1146/annurev.pathol.1.110304.100230. - DOI - PubMed
    1. Maini MK, Bertoletti A. HBV in 2016: Global and immunotherapeutic insights into hepatitis B. Nat Rev Gastroenterol Hepatol. 2017;14(2):71–72. doi: 10.1038/nrgastro.2016.196. - DOI - PubMed
    1. Rehermann B, Thimme R. Insights from antiviral therapy into immune responses to hepatitis B and C virus infection. Gastroenterology. 2019;156(2):369–383. doi: 10.1053/j.gastro.2018.08.061. - DOI - PMC - PubMed
    1. Likhitsup A, Lok AS. Understanding the natural history of hepatitis B virus infection and the new definitions of cure and the endpoints of clinical trials. Clin Liver Dis. 2019;23(3):401–416. doi: 10.1016/j.cld.2019.04.002. - DOI - PubMed
    1. Schwarz KB, et al. Phenotypes of chronic hepatitis B in children from a large North American cohort. J Pediatr Gastroenterol Nutr. 2019;69(5):588–594. doi: 10.1097/MPG.0000000000002467. - DOI - PMC - PubMed

Publication types