. 2021 Mar 22;6(6):e146242.
doi: 10.1172/jci.insight.146242.

Comorbid illnesses are associated with altered adaptive immune responses to SARS-CoV-2

Affiliations

Comorbid illnesses are associated with altered adaptive immune responses to SARS-CoV-2

Krystle Kq Yu et al. JCI Insight. .

Abstract

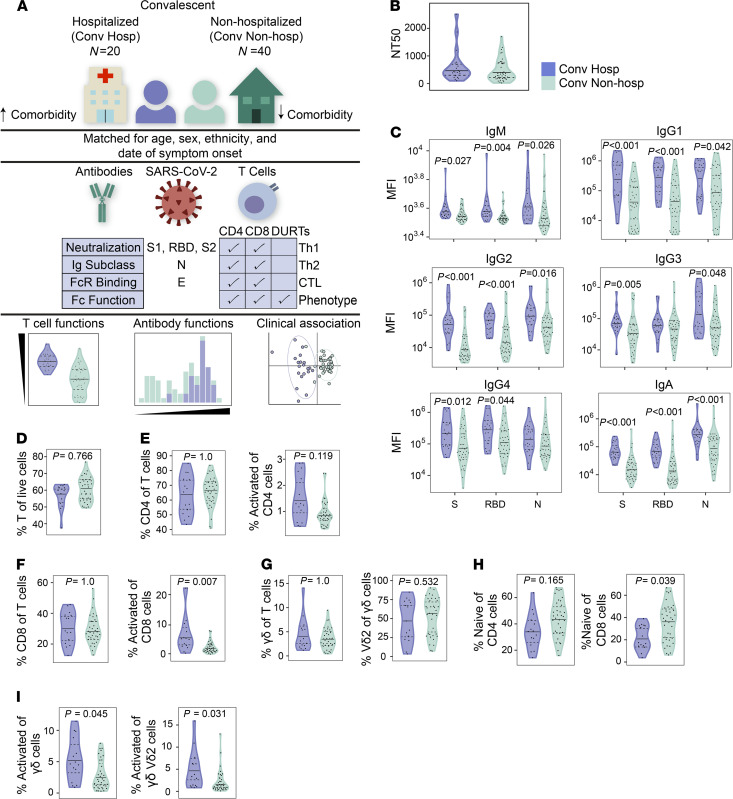
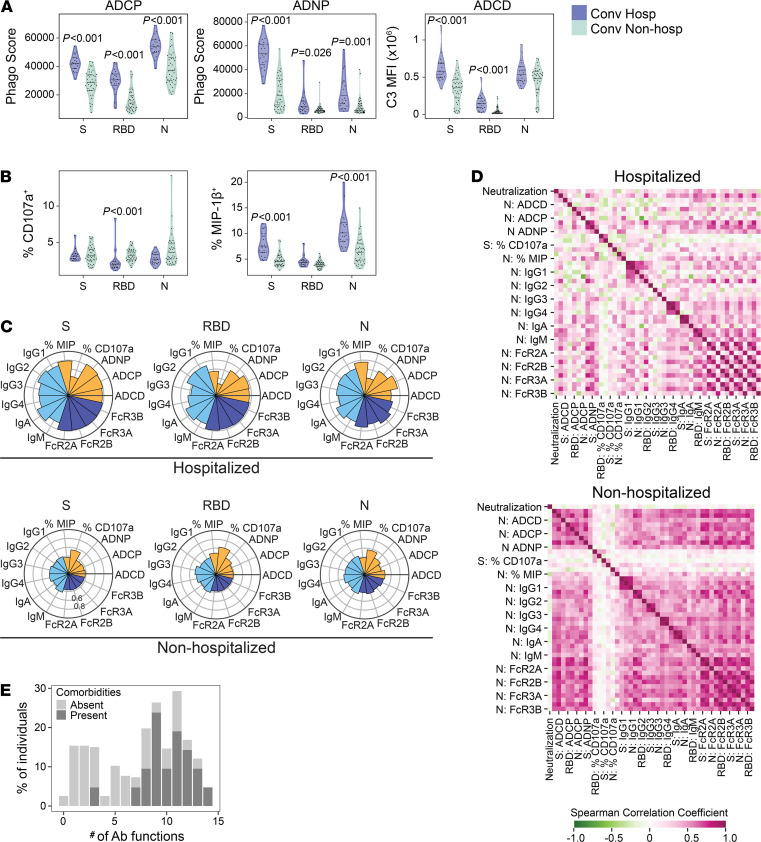
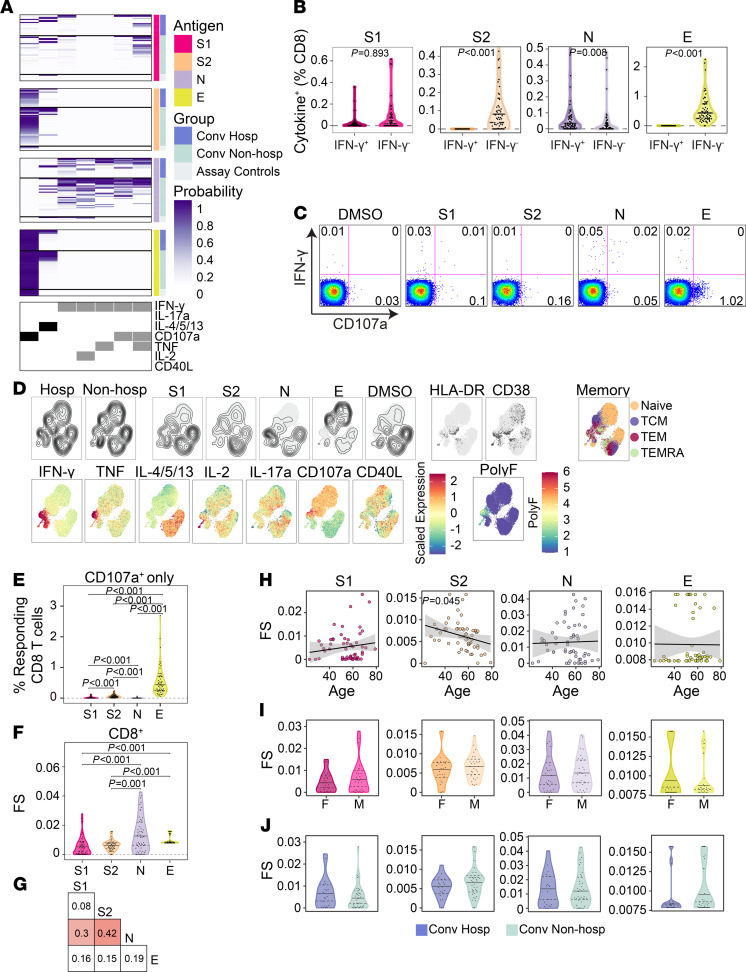
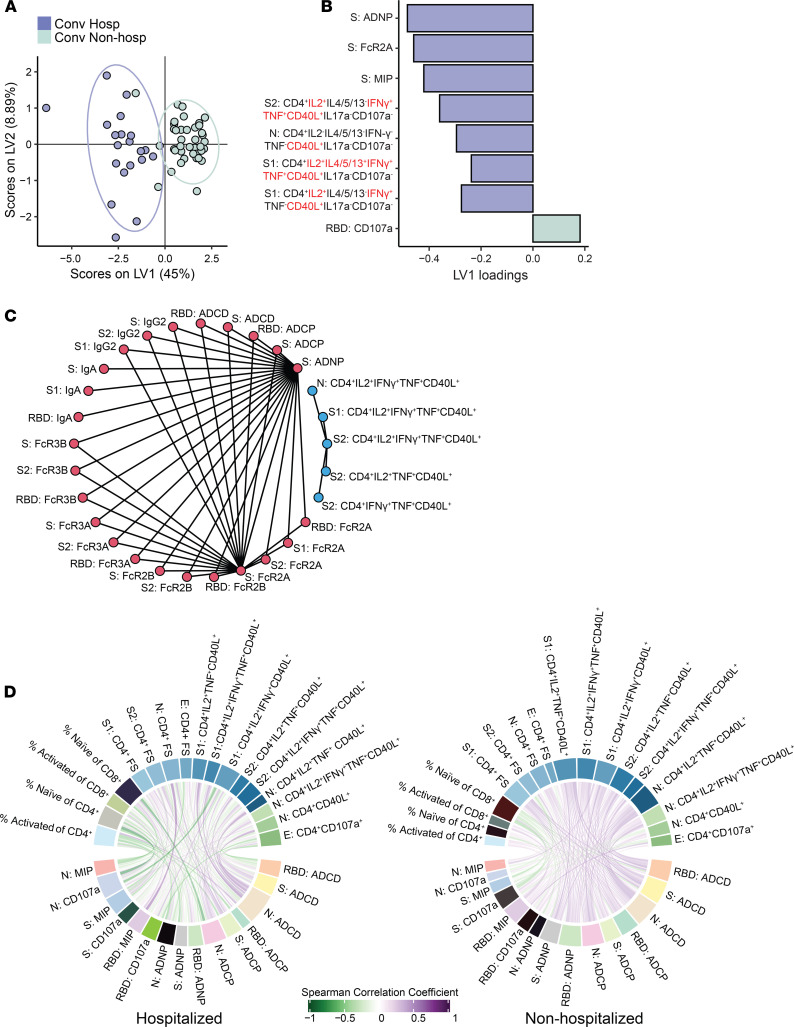
Comorbid medical illnesses, such as obesity and diabetes, are associated with more severe COVID-19, hospitalization, and death. However, the role of the immune system in mediating these clinical outcomes has not been determined. We used multiparameter flow cytometry and systems serology to comprehensively profile the functions of T cells and antibodies targeting spike, nucleocapsid, and envelope proteins in a convalescent cohort of COVID-19 subjects who were either hospitalized (n = 20) or not hospitalized (n = 40). To avoid confounding, subjects were matched by age, sex, ethnicity, and date of symptom onset. Surprisingly, we found that the magnitude and functional breadth of virus-specific CD4+ T cell and antibody responses were consistently higher among hospitalized subjects, particularly those with medical comorbidities. However, an integrated analysis identified more coordination between polyfunctional CD4+ T cells and antibodies targeting the S1 domain of spike among subjects who were not hospitalized. These data reveal a functionally diverse and coordinated response between T cells and antibodies targeting SARS-CoV-2, which is reduced in the presence of comorbid illnesses that are known risk factors for severe COVID-19.

Keywords: Adaptive immunity; Beta cells; COVID-19; Immunology; T cells.


Conflict of interest statement

Conflict of interest: HYC reports grants from the Bill and Melinda Gates Foundation, Sanofi Pasteur, and Gates Ventures; serves as a consultant for Merck and the Bill and Melinda Gates Foundation; and reports nonfinancial support from Cepheid and Ellume. AW reports grants from Sanofi-Pasteur and GlaxoSmithKline, and serves as a consultant for Aicuris, Merck, and X-Vax. DMK serves as a consultant for Curevo, MaxHealth, and Gilead and reports grants from Sensei and Sanofi Pasteur.

Figures

Figure 1
Figure 1. Cellular and humoral dynamics in a matched cohort of convalescent COVID-19 subjects.
(A) Study schema. Archived peripheral blood mononuclear cells (PBMC) and plasma from COVID-19 study subjects who were previously hospitalized (purple, n = 20) or nonhospitalized (green, n = 40) were selected based on matching for age, sex, ethnicity, and date of symptom onset. Samples were comprehensively profiled for SARS-CoV-2–specific T cell and antibody phenotypes and functions. Data were analyzed to identify differences between the groups and to build a classifier. DURTs, donor-unrestricted T cells. (B) Antibody neutralization titers were compared between hospitalized and nonhospitalized subjects. NT50 denotes the concentration of serum required to achieve 50% of the maximum neutralization in the assay. (C) Comparison of antibody subclass and isotype levels against spike (S), receptor binding domain (RBD), and nucleocapsid (N) antigens between groups. (D) Flow cytometric analysis comparing the percent of total CD3+ T cells between groups. (E and F) Among CD3+ T cells, the percent of CD4+ T cells (E), CD8+ T cells (F), and activation statuses as defined by coexpression of HLA-DR and CD38 was compared between groups. (G) The frequency of γδ T cells as a percent of total CD3+ T cells and Vδ2 T cell frequencies as a percent of γδ T cells are compared between hospitalized and nonhospitalized patients. (H) The percentage of naive CD4+ and CD8+ T cells as defined by coexpression of CD45RA and CCR7 is assessed between groups. (I) The frequencies of activated γδ and Vδ2 T cells are compared between groups. NT50, Ig titers, and T cell frequencies were compared between groups using Mann-Whitney U tests, followed by correction for multiple hypothesis testing using the Bonferroni method. Median, 25th, and 75th quartiles are indicated for violin plots. If not shown, P values for Mann-Whitney U tests were not significant.
Figure 2
Figure 2. Antibody functional profiles are associated with hospitalization after COVID-19.
SARS-CoV-2–specific antibody phenotypes and functional profiles were compared between hospitalized (purple, n = 20) and nonhospitalized (green, n = 40) COVID-19 study subjects. (A and B) Antibody-dependent cellular phagocytosis (ADCP), antibody-dependent neutrophil phagocytosis (ADNP), antibody-dependent complement deposition (ADNP) (A), and NK cell activation as measured by MIP-1β secretion or CD107a expression (B) against spike (S), receptor binding domain (RBD), and nucleocapsid (N) was quantified and compared between groups. (C) Nightingale rose graphs show the distribution around the mean profiles of antibody features for S, RBD, and N among hospitalized and nonhospitalized subjects. Each flower petal represents a SARS-CoV-2–specific antibody measurement. The size of the petal depicts the percentile above/below the mean across both groups. The colors indicate type of feature: antibody function (orange), titer (light blue), and Fc-receptor binding (dark blue). (D) The correlation matrix shows the Spearman correlation coefficient for antibody features separately in hospitalized and nonhospitalized subjects. Pink indicates a positive correlation, whereas green indicates a negative correlation. (E) Polyfunctional antibody profiles were compared between subjects with and without comorbidities. To determine polyfunctionality, an individual’s response was noted to be functional if it was above the median response for the cohort. Per person, the number of positive functions was summed, resulting in a polyfunctionality score per individual. Polyfunctional scores are displayed as percent positivity of the whole cohort. Antibody phenotypes and effector functions excluding neutralization were compared across groups using Mann-Whitney U tests, followed by correction for multiple hypothesis testing using the Bonferroni method. Median, 25th, and 75th quartiles are indicated for violin plots. If not shown, P values for Mann-Whitney U tests were not significant.
Figure 3
Figure 3. IFN-γ–independent CD4 T cell responses to SARS-CoV-2 structural antigens.
(A) Intracellular cytokine staining was used to profile the functions of CD4+ T cells specific for the S1 and S2 domains of spike, nucleocapsid (N), and envelope small membrane protein (E). Data were analyzed using COMPASS, and results are displayed as a probability heatmap in which the rows represent study subjects and the columns represent CD4+ T cell functional subsets. The depth of shading within the heatmap represents the probability of detecting a response above background. In the column legend, white indicates absence and black/gray indicates presence of a function. (B) Background subtracted magnitudes of CD4+ T cell responses stratified by the presence of IFN-γ. (C) Representative bivariate flow cytometry plots showing the expression of IFN-γ and CD40L following stimulation. (D) Cells expressing any of the functional profiles identified by COMPASS were aggregated across all subjects prior to performing dimensionality reduction with UMAP. Plots are stratified and colored according to hospitalization status, stimulation, effector function, memory markers (naive, CD45RA+CCR7+; central memory [TCM], CD45RACCR7+; effector memory [TEM], CD45RACCR7; and effector memory RA [TEMRA], CD45RA+CCR7), and activation markers (HLA-DR, CD38). Polyfunctionality (PolyF) was calculated as the number of cytokines gated positive for each cell. (E) Magnitudes of CD4+ T cells expressing a CD40L+IL-2+TNF+ functional profile in the presence or absence of IFN-γ are compared across stimulations. (F) Magnitudes of CD4+ T cells expressing CD107a in the absence of all other functions are compared across stimulations. Wilcoxon signed-rank tests were used to compare frequencies between groups in B and E. E reports Bonferroni-corrected P values, but B is unadjusted. Median, 25th, and 75th quartiles are indicated for violin plots. If not shown, P values were not significant. n = 60 in all panels.
Figure 4
Figure 4. Functional diversity of CD4+ T cell responses to SARS-CoV-2 are associated with hospitalization.
(A) The CD4+ T cell functionality score (FS) was determined by COMPASS and compared across all 4 stimulation conditions. (B) Two-way correlations of FS were calculated between stimulations. Colored squares indicate a statistically significant correlation (P < 0.05). (CE) For each stimulation, we examined the association with age (C), sex (D), and hospitalization status (E). The black lines on the scatter plots represent best fit linear regression lines, and the gray-shaded areas represent the 95% CI of the predicted means. (F) CD4 functionality scores for each stimulation were compared in the presence and absence of comorbidities. (G) Background corrected magnitudes of CD4+ T cells expressing a CD40L+IL-2+TNF+ functional profile in the presence or absence of IFN-γ are compared between groups after stimulation with S1, S2, and N. CD4 functionality scores were compared using Wilcoxon signed-rank tests or Mann-Whitney U tests, followed by correction for multiple hypothesis testing using the Bonferroni method except for D and F. Supplemental Figure 6 shows all the functional profiles that were compared with obtain P values reported in G. Median, 25th, and 75th quartiles are indicated for violin plots. If not shown, P values were not significantly different. n = 60 in all panels.
Figure 5
Figure 5. CD8+ T cell responses to SARS-CoV-2 structural antigens are not associated with hospitalization.
(A) Intracellular cytokine staining was used to profile the functions of CD8+ T cells specific for the S1 and S2 domains of spike, nucleocapsid (N), and envelope small membrane protein (E). Results of COMPASS are displayed as a heatmap in which rows represent study subjects and columns represent CD8+ T cell functional subsets. The depth of shading within the heatmap represents the probability of detecting a response above background. In the column legend, white indicates absence and black/gray indicates presence of a function. (B) Background subtracted magnitudes of CD8+ T cell responses stratified by the presence of IFN-γ. A single outlier is not displayed for S2 and N. (C) Representative bivariate flow cytometry plots showing the expression of IFN-γ and CD107a following stimulation. (D) Cells expressing any of the functional profiles identified by COMPASS were aggregated across all subjects prior to UMAP. (E) Magnitudes of CD8+ T cells expressing CD107a in the absence of other functions. (F) The CD8+ T cell functionality score (FS) as determined by COMPASS. (G) Two-way correlations of FS were calculated between stimulations. Colored squares indicated a statistically significant correlation (P < 0.05). (HJ) For each stimulation, we examined the association with age (H), sex (I), and hospitalization status (J). Black lines on the scatter plots represent best fit linear regression lines, and the gray-shaded areas represent the 95% CI of the predicted means. Data were analyzed using Wilcoxon signed-rank tests (B, E, and F) and Mann-Whitney U tests (I and J) and were corrected for multiple hypothesis testing using the Bonferroni method. Median, 25th, and 75th quartiles are indicated for violin plots. If not shown, P values were not significant. n = 60 in all panels.
Figure 6
Figure 6. A classifier based on antibody and T cell features predicts hospitalization status.
(A) Partial least squares discriminant analysis (PLS-DA) was used to identify features that could discriminate between hospitalized (purple) and nonhospitalized (green) subjects. The PLS-DA scores plot shows the separation between groups using the first 2 latent variables (LVs). Each dot represents an individual, and ellipses correspond to the 95% data ellipse for each group. (B) The bar plot shows the LV1 loadings of the LASSO-selected features for the PLS-DA ranked based on their variable importance in projection (VIP) score. Features are color coded according to the group in which they are enriched — i.e., the group with the higher average values of the feature. (C) The correlation network was generated from all the features correlated with LASSO-selected features. A cutoff with Spearman P > 0.8 and P < 0.005 is shown. A cutoff of Spearman P > 0.8 with a Benjamini-Hochberg adjusted P <0.05 was set, and only connections outside of this cutoff are shown. The graph was generated using R package network (72, 74). (D) The chord diagram generated using the R package circlize (73) shows Spearman correlations between T cell features and antibody-dependent effector functions for nonhospitalized and hospitalized subjects. Spearman correlations are shown as links that carry the color of the average correlation coefficient between the functional antibody features and T cell measurements. The arc length of each segment is automatically scaled to the number of correlating segments it pairs with. To exclude potential bias caused by the number of subjects in nonhospitalized (n = 40) and hospitalized (n = 20) groups, per-group Spearman correlations were calculated by sampling 10 subjects 100 times and computing the average of the Spearman correlation coefficients for each antibody feature–T cell measurement pair.

Update of

Similar articles

Cited by

References

    1. Virological. Novel 2019 Coronavirus Genome. https://virological.org/t/novel-2019-coronavirus-genome/319 Accessed February 19, 2021.
    1. Johns Hopkins University of Medicine. Coronavirus Resource Center. https://coronavirus.jhu.edu/map.html Accessed February 19, 2021.
    1. Huang C, et al. Clinical features of patients infected with 2019 novel coronavirus in Wuhan, China. Lancet. 2020;395(10223):497–506. doi: 10.1016/S0140-6736(20)30183-5. - DOI - PMC - PubMed
    1. Wu Z, McGoogan JM. Characteristics of and important lessons from the Coronavirus Disease 2019 (COVID-19) outbreak in China: summary of a report of 72314 cases from the Chinese Center for Disease Control and Prevention. JAMA. 2020;323(13):1239–1242. doi: 10.1001/jama.2020.2648. - DOI - PubMed
    1. Petrilli CM, et al. Factors associated with hospital admission and critical illness among 5279 people with coronavirus disease 2019 in New York City: prospective cohort study. BMJ. 2020;369:m1966. - PMC - PubMed

Publication types

MeSH terms