. 2021 Apr 1;131(7):e137752.
doi: 10.1172/JCI137752.

Cx43 hemichannel microdomain signaling at the intercalated disc enhances cardiac excitability

Affiliations

Cx43 hemichannel microdomain signaling at the intercalated disc enhances cardiac excitability

Maarten Aj De Smet et al. J Clin Invest. .

Abstract

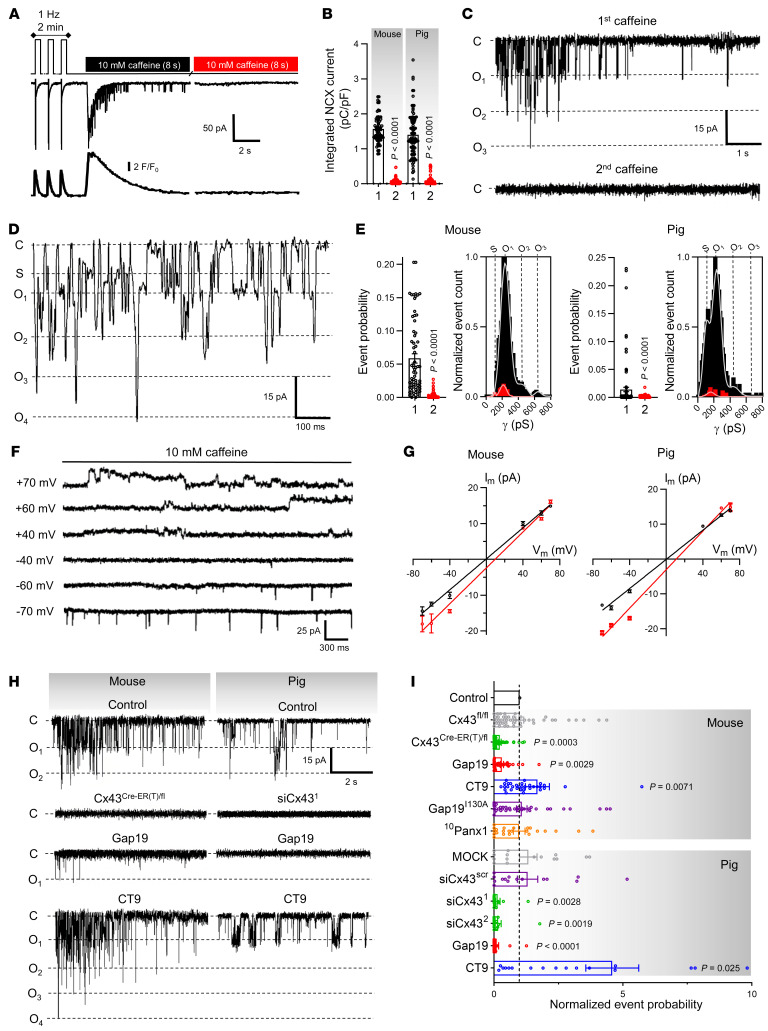
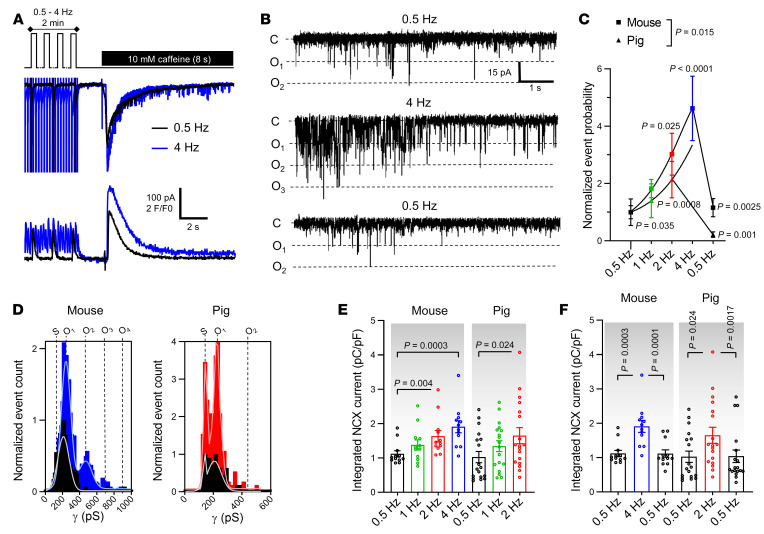
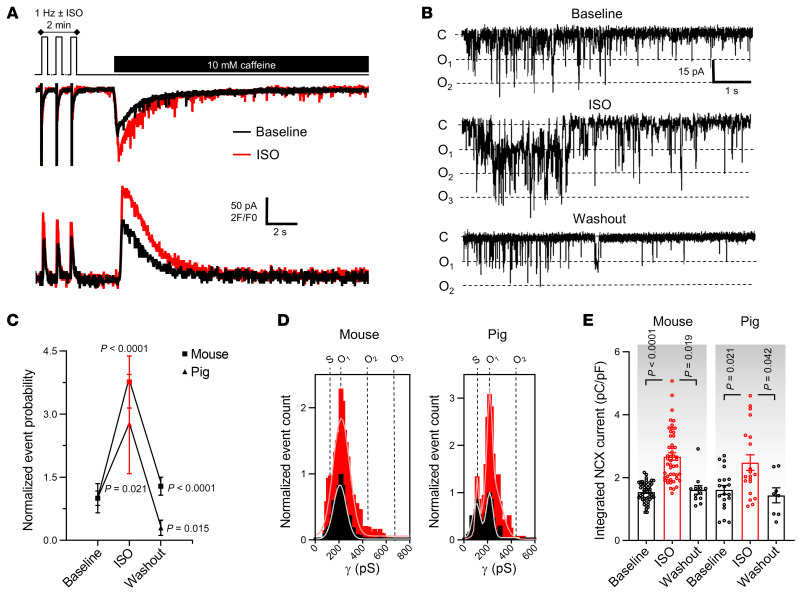
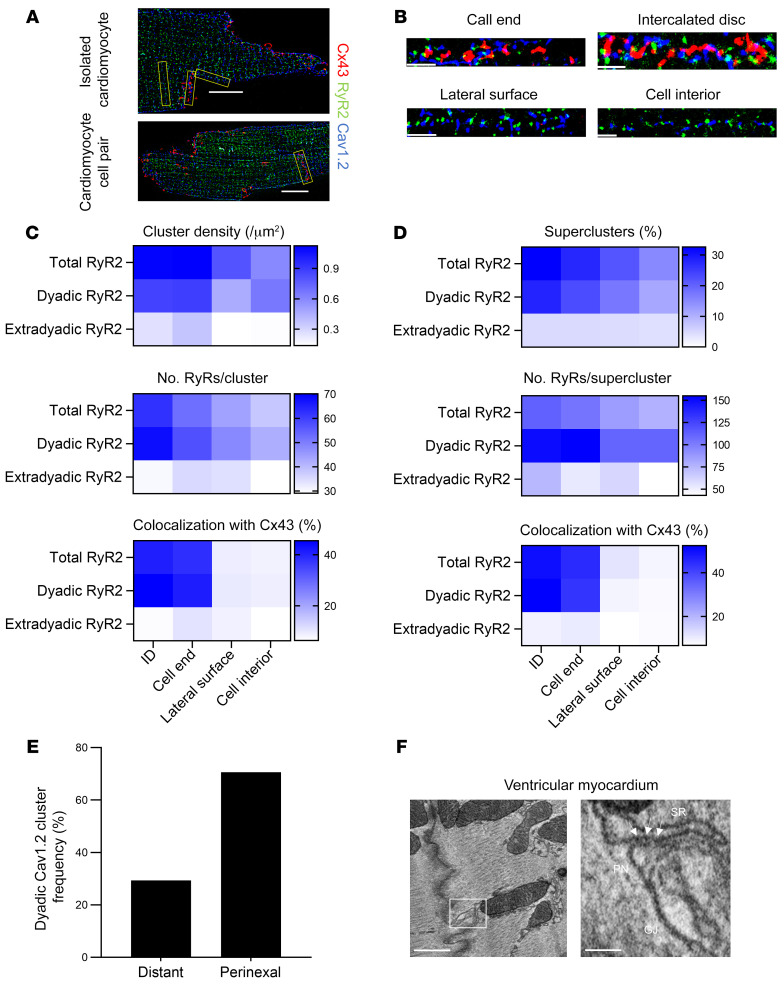
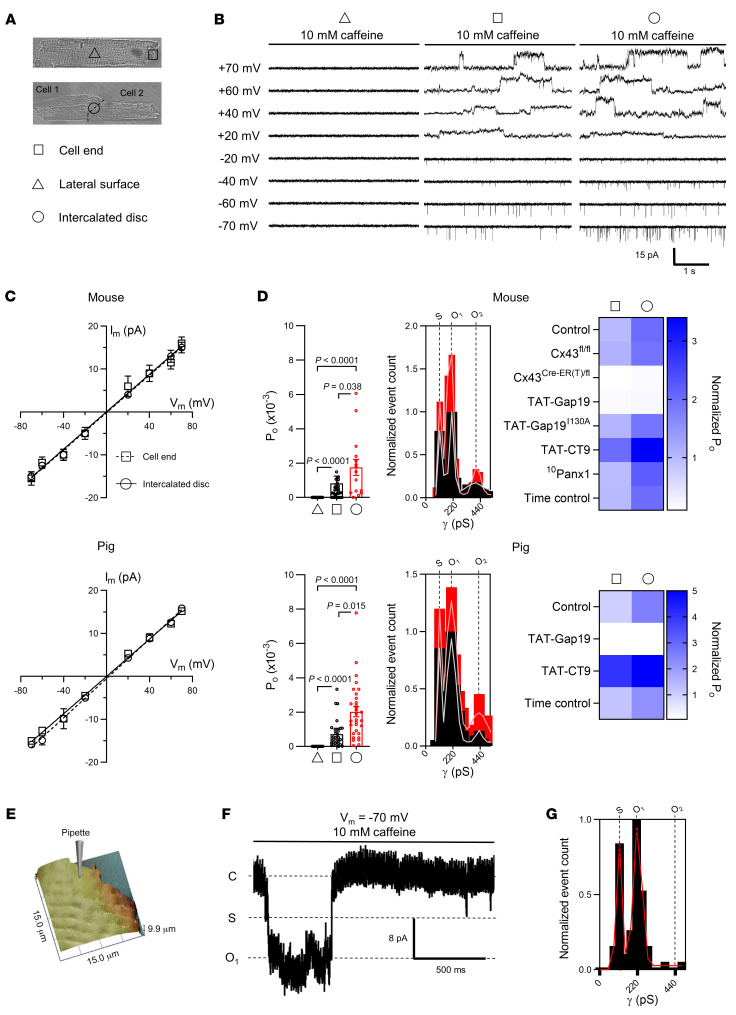
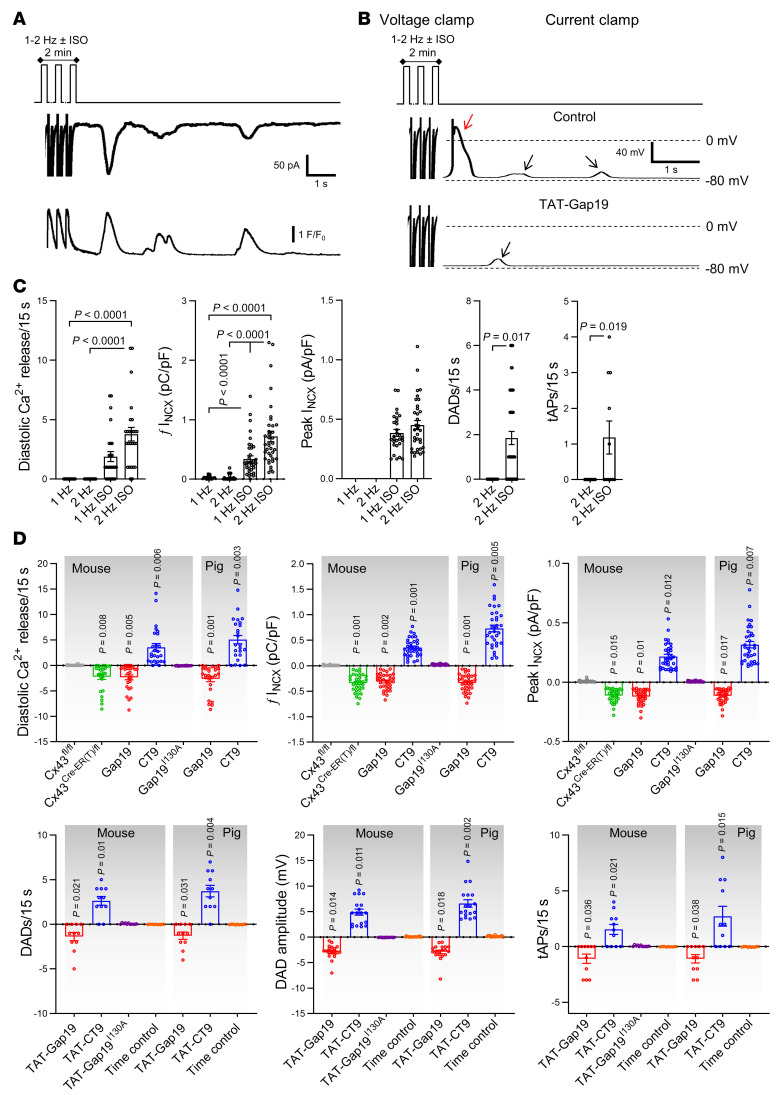
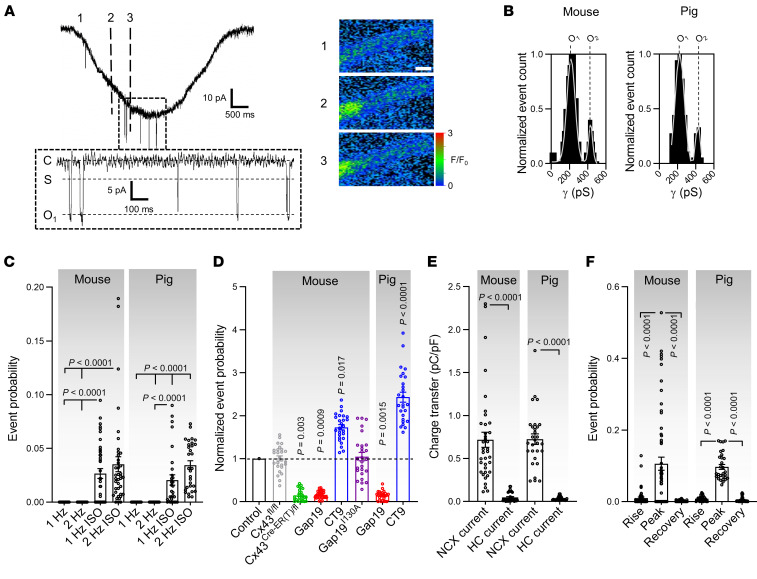
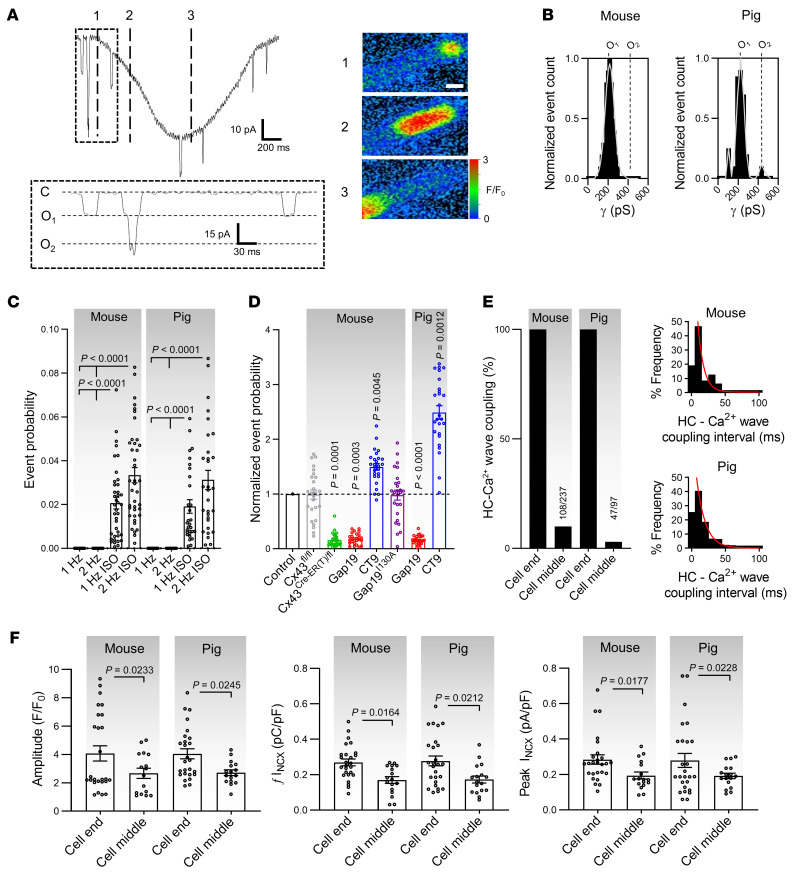
Cx43, a major cardiac connexin, forms precursor hemichannels that accrue at the intercalated disc to assemble as gap junctions. While gap junctions are crucial for electrical conduction in the heart, little is known about the potential roles of hemichannels. Recent evidence suggests that inhibiting Cx43 hemichannel opening with Gap19 has antiarrhythmic effects. Here, we used multiple electrophysiology, imaging, and super-resolution techniques to understand and define the conditions underlying Cx43 hemichannel activation in ventricular cardiomyocytes, their contribution to diastolic Ca2+ release from the sarcoplasmic reticulum, and their impact on electrical stability. We showed that Cx43 hemichannels were activated during diastolic Ca2+ release in single ventricular cardiomyocytes and cardiomyocyte cell pairs from mice and pigs. This activation involved Cx43 hemichannel Ca2+ entry and coupling to Ca2+ release microdomains at the intercalated disc, resulting in enhanced Ca2+ dynamics. Hemichannel opening furthermore contributed to delayed afterdepolarizations and triggered action potentials. In single cardiomyocytes, cardiomyocyte cell pairs, and arterially perfused tissue wedges from failing human hearts, increased hemichannel activity contributed to electrical instability compared with nonfailing rejected donor hearts. We conclude that microdomain coupling between Cx43 hemichannels and Ca2+ release is a potentially novel, targetable mechanism of cardiac arrhythmogenesis in heart failure.

Keywords: Arrhythmias; Calcium signaling; Cardiology; Cell Biology; Peptides.


Conflict of interest statement

Conflict of interest: The authors have declared that no conflict of interest exists.

Figures

Figure 1
Figure 1. Caffeine-induced Ca2+ release from the sarcoplasmic reticulum activates Cx43 hemichannels at resting membrane potential.
(A) Freshly isolated left ventricular cardiomyocytes were studied under voltage clamp with continuous [Ca2+]i recording. Top trace shows experimental protocol. Middle and bottom traces depict current and [Ca2+]i signals recorded in a mouse myocyte. (B) Summary data illustrating abolished NCX current during second caffeine pulse compared with first pulse (nested t test), indicating depleted SR Ca2+ stores (N/nmouse = 90/281, N/npig = 20/55). (C) Unitary current example traces during first and second caffeine applications with NCX current subtracted. “C” indicates closed state; O1 corresponds to fully open state; O2 and O3 indicate multiples of fully open state. (D) Expanded trace of unitary current activity. “S” indicates substate. (E) Summary dot plots and transition histograms indicate significantly reduced unitary current event probability during the second caffeine pulse (red) compared with the first application (black) (nested t test; N/nmouse = 90/281, N/npig = 20/55). (F) Unitary current example traces during caffeine application at different membrane voltages. Recordings under conditions of K+ channel blockade after 30 seconds of 1 Hz pacing. (G) IV plots depicting linear current-voltage relationship with slope conductance approximately 220 pS and Erev ≈ 0 mV (black line; N/nmouse = 5/20, N/npig = 5/15). A 5-fold elevation of [Ca2+]e shifted Erev from 0 to approximately 9.5 mV (red line; N/nmouse = 5/20, N/npig = 5/15). (H) Unitary current example traces under control conditions and after Cx43 knockdown or application of Gap19 or CT9. (I) Summary data of Ca2+ release–induced unitary current event probability under conditions of Cx43 knockdown or in the presence of Gap19, inactive Gap19I130A, CT9, or 10Panx1 (N/nmouse = 5–16/20–49 per condition, N/npig = 5–6/15–21 per condition). P values indicate significance compared with control (nested 1-way ANOVA).
Figure 2
Figure 2. Cx43 hemichannel activation is frequency dependent.
(A) Top trace shows experimental protocol: cells were paced for 2 minutes to steady state (mouse 0.5, 1, 2, or 4 Hz; pig 0.5, 1, or 2 Hz) followed by caffeine superfusion. Middle and bottom traces depict current and [Ca2+]i signals recorded in a mouse myocyte after 0.5 (black) or 4 Hz (blue) pacing. (B) Unitary current example traces after 0.5 and 4 Hz including reversibility (NCX currents subtracted). (C and D) Summary graph and transition histograms indicate significant and reversible increase in unitary current event probability with increasing pacing frequency (N/nmouse = 4/12, N/npig = 7/19). P values compare to 0.5 Hz or to 2/4 Hz (nested 1-way ANOVA). (E) Summary dot plot depicting significant increase in SR Ca2+ content with increasing frequency, as determined by integrating NCX current during caffeine (nested 1-way ANOVA; N/nmouse = 4/12, N/npig = 7/19). (F) Summary dot plot depicting reversible increase in SR Ca2+ content with increasing frequency (nested 1-way ANOVA; N/nmouse = 4/12, N/npig = 7/19).
Figure 3
Figure 3. Cx43 hemichannel activation is modulated by β-adrenergic stimulation.
(A) Top trace shows experimental protocol: β-adrenergic stimulation (1 μmol/L isoproterenol for mouse; 10 nmol/L pig) was applied when pacing frequency was 1 Hz. Middle and bottom traces depict current and [Ca2+]i signals recorded in mouse following 1 Hz pacing without (black) or with isoproterenol (red). (B) Unitary current example traces in the absence or presence of isoproterenol, including washout (NCX currents subtracted). (C and D) Summary graph and transition histograms indicate significant and reversible increase in unitary current event probability with isoproterenol compared with baseline (nested 1-way ANOVA; N/nmouse = 20/49, N/npig = 8/20). (E) Summary dot plot illustrating reversible increase in SR Ca2+ content with isoproterenol compared with baseline (nested 1-way ANOVA; N/nmouse = 20/49, N/npig = 8/20).
Figure 4
Figure 4. Cx43 colocalizes with large dyadic RyR2 superclusters and forms microdomains at the perinexus.
(A) 2D SMLM images of a murine cardiomyocyte (top) and cardiomyocyte cell pair (bottom), triple stained for Cx43 (red), RyR2 (green), and Cav1.2 (blue). Scale bar: 10 μm. (B) Straightened region of interest (from yellow boxes in A) of Cx43, RyR2, and Cav1.2 at different subcellular domains. Scale bar: 2 μm. (C) Heatmap of RyR2 cluster density, number of molecules, and colocalization with Cx43 at different subcellular domains (n = 5, n = 42 single cardiomyocytes, 16 cardiomyocyte cell pairs). RyR2 clusters were classified as dyadic or extradyadic based on the proximity of Cav1.2 clusters, RyR2 clusters occurring less than 250 nm from a Cav1.2 cluster were categorized as dyadic. (D) Heatmap of RyR2 supercluster abundance, size, and colocalization with Cx43 at different subcellular domains (n = 5, n = 42 single cardiomyocytes, 16 cardiomyocyte cell pairs). (E) Relative localization overview in left ventricular mouse cardiomyocyte cell pairs. Dyadic Cav1.2 clusters were categorized as perinexal or distant based on edge distance 200 nm or less or greater than 200 nm from edge of Cx43 cluster, respectively (n = 5, n = 16 cardiomyocyte cell pairs). (F) EM images of an SR cistern forming a dyadic cleft at the perinexus in mouse ventricular myocardium. Left image shows an EM overview of a murine ventricular intercalated disc. Scale bar: 500 nm. White box is enlarged on the right. Arrows indicate electron dense particles, likely ryanodine receptors. Scale bars: 100 nm. Pn, perinexus.
Figure 5
Figure 5. Discrete sites of Cx43 hemichannel activation at the intercalated disc during Ca2+ release from the sarcoplasmic reticulum.
(A) Transmitted light images of a single cardiomyocyte (top) and cardiomyocyte cell pair (bottom). Triangle, square, and circle symbols indicate cell-attached macropatch (Rp = ~2 MΩ, ~2 μm pipette inner diameter) recording positions at the lateral membrane and cell end of single cardiomyocytes and intercalated disc of cardiomyocyte cell pairs, respectively. (B) Example traces showing single channel currents recorded at the lateral membrane, cell end, or intercalated disc. Traces recorded in mouse cardiomyocytes during caffeine superfusion (10 mM, 8 seconds) at indicated membrane potentials. (C) IV plots depicting linear current-voltage relationship with slope conductance of approximately 220 pS and Erev ≈ 0 mV (N/nmouse = 5/10–18 patches per condition, N/npig = 5/15–20 patches per condition). (D) Summary dot plots and transition histograms indicate recording of approximately 220 pS single channel currents at the cell end of single cardiomyocytes, but not at the lateral membrane, with significantly increased open probability at the intercalated disc of cardiomyocyte cell pairs. Comparative statistics with nested 1-way ANOVA. Heatmap summarizes single channel open probability at the cell end or at the intercalated disc under conditions of Cx43 knockdown or in the presence of TAT-Gap19, inactive TAT-Gap19I130A, TAT-CT9, or 10Panx1 (N/nmouse = 5/10–18 patches per condition, N/npig = 5/15–20 patches per condition). (E) SICM-generated membrane topology of the cell end of a mouse left ventricular cardiomyocyte. Pipette indicates the recording position distally of the last Z-line. (F) Example trace recorded at –70 mV during caffeine superfusion. (G) Transition histogram from all experiments (n = 5, n = 35) showing a fully open state at approximately 220 pS and a substate at approximately 110 pS.
Figure 6
Figure 6. Cx43 hemichannel opening during adrenergic stimulation modulates spontaneous Ca2+ release from the sarcoplasmic reticulum and arrhythmogenic afterdepolarizations.
(A) Freshly isolated mouse and pig left ventricular cardiomyocytes were subjected to voltage clamp experiments while [Ca2+]i was simultaneously monitored. Top trace shows experimental protocol: cells were paced to steady state for 2 minutes at 1 Hz and then clamped to –70 mV. Middle and bottom traces depict resulting current and [Ca2+]i signals: final 3 paced Ca2+ transients and accompanying currents followed by 15-second rest period showing spontaneous diastolic Ca2+ release with resulting NCX current. Protocols were repeated at 2 Hz with and without isoproterenol. Example traces were recorded in pig cardiomyocytes. (B) In a subset of experiments, we switched to current clamp mode following steady-state pacing in voltage clamp. Example traces, recorded in the same pig cardiomyocyte, without and with TAT-Gap19 were recorded in current clamp mode following 2-minute pacing to steady state at 2 Hz with isoproterenol (in voltage clamp mode). Black arrows indicate DADs, red arrow indicates a triggered action potential. (C) Summary dot plots (nested 1-way ANOVA; N/nmouse = 23/75 for voltage clamp experiments and N/nmouse = 5/45 for current clamp experiments) illustrating increased frequency and amplitude of diastolic Ca2+ release with increased resulting NCX current and membrane depolarization during adrenergic stimulation (2 Hz + ISO) compared with baseline. tAP, triggered action potential. Similar results were obtained in pig cardiomyocytes (not shown). (D) Summary data showing the impact of different interventions on diastolic Ca2+ release and resulting NCX currents and membrane depolarization (nested 1-way ANOVA; N/nmouse = 5–11/15–24 per condition, N/npig = 5/15–20 per condition). Values reported as differences from the control condition.
Figure 7
Figure 7. Spontaneous Cx43 hemichannel openings during Ca2+ waves.
(A) Left, NCX current during spontaneous Ca2+ release with superimposed unitary currents. Inset shows detail of unitary current activity. Right, Ca2+ images corresponding to time points indicated by dashed lines in left trace. Scale bar: 10 μm. (B) Transition histograms of superimposed unitary activity showing approximately 220 pS unitary conductance (N/nmouse = 23/75, N/npig = 10/30). (C) Summary dot plot illustrating increasing unitary current event probability with increasing pacing frequency and with isoproterenol (nested 1-way ANOVA; N/nmouse = 23/75, N/npig = 10/30). (D) Summary data showing the effect of different interventions at 2 Hz + ISO (N/nmouse = 5–11/15–24 per condition, N/npig = 5/15 per condition). P values indicate significance compared with control (nested 1-way ANOVA). (E) Summary dot plot depicting relative integrals of NCX and unitary current at 2 Hz + ISO (nested t test; N/nmouse = 23/75, N/npig = 10/30). (F) Summary dot plot depicting unitary current event probability during different phases of NCX current induced by spontaneous Ca2+ release (nested 1-way ANOVA; N/nmouse = 23/75, N/npig = 10/30). These phases include the rising phase (rise, 10%–90%), peak and recovery (90%–10%).
Figure 8
Figure 8. Spontaneous Cx43 hemichannel openings preceding Ca2+ waves promote arrhythmogenic Ca2+ release and the resulting depolarizing current.
(A) Left, unitary currents preceding diastolic Ca2+ release. Inset shows detail of unitary current activity. Right, Ca2+ images corresponding to time points indicated by dashed lines in left trace. Scale bar: 10 μm. (B) Transition histograms showing approximately 220 pS unitary conductance of preceding unitary activity (N/nmouse = 23/75, N/npig = 10/30). (C) Summary dot plot illustrating increasing unitary current event probability with increasing pacing frequency and with isoproterenol (nested 1-way ANOVA; N/nmouse = 23/75, N/npig = 10/30). (D) Summary data showing the effect of different interventions at 2 Hz + ISO (N/nmouse = 5–11/15–24 per condition, N/npig = 5/15 per condition). P values indicate significance compared with control (nested 1-way ANOVA). (E) Fraction and coupling interval of Cx43 HC-associated Ca2+ release (N/nmouse = 23/75, N/npig = 10/30). Left graph indicates that HC-Ca2+ release coupling to Ca2+ waves occurs at the cell end. Numbers show absolute counts. Right histogram indicates time from hemichannel opening to Ca2+ release. (F) Dot plots summarizing properties of diastolic Ca2+ release and resulting NCX currents categorized by origin (nested t test; N/nmouse = 23/75, N/npig = 10/30). HC, hemichannel.
Figure 9
Figure 9. Modeling-based estimations of electrical and Ca2+ consequences of single hemichannel opening.
(A) Schematic overview of electrical and Ca2+ consequences of single hemichannel opening. The 15.9 pA electrical current is a measured value; the 0.8 pA and 1.5 pA Ca2+ currents are calculated estimates using 1.0 and 1.8 mM of extracellular Ca2+, respectively. Panels B to E further explore the impact of a range of hemichannel Ca2+ currents. Note that the values given are only valid at –70 mV membrane potential and 37°C. Further modeling details can be found in the supplemental material. (B) Peak elevation of subsarcolemmal [Ca2+]i as a function of single hemichannel Ca2+ current (ICa,HC). (C) Membrane depolarization due to Ca2+ entry is associated with NCX activation. Black and red points indicate hemichannel Ca2+ current estimates, which are close to or in the plateau phase of the curve. (D) Probability of activation of RyR superclusters as a function of single hemichannel Ca2+ current. (E) Probability of Ca2+ wave propagation as a function of single hemichannel Ca2+ current.
Figure 10
Figure 10. Identification and regulation of Cx43 hemichannels in nonfailing and failing human ventricular cardiomyocytes.
(A) Unitary current example traces during first and second caffeine applications, NCX current subtracted. Recorded in nonfailing left ventricular human cardiomyocyte. (B) Summary dot plot and transition histogram indicating significantly reduced unitary current event probability during the second caffeine pulse (red) compared with the first (black) (nested t test; N/nNF = 20/64). (C) IV plots depicting linear current-voltage relationship with slope conductance approximately 220 pS and Erev ≈ 0 mV (NNF/nNF = 4/14). (D) Ca2+ release–induced unitary current example traces following 0.5 and 2 Hz pacing in nonfailing and failing human cardiac myocytes (NCX currents subtracted). (E) Summary graph and transition histograms indicate significant increase in unitary current event probability with increasing pacing frequency (nested t test; N/nNF = 5/25, N/nHF = 5/25). This effect is significantly stronger at 2 Hz in failing compared with nonfailing cardiomyocytes (nested t test). (F) Ca2+ release–induced unitary current example traces in the absence and presence of isoproterenol (10 nmol/L) in nonfailing and failing human cardiac myocytes (NCX currents subtracted). (G) Summary graph and transition histograms indicate significant increase in unitary current event probability with isoproterenol compared with baseline (nested t test; N/nNF = 5/13, N/nHF = 5/14). The effect was significantly stronger with ISO in failing compared with nonfailing cardiomyocytes (nested t test). (H) Ca2+ release–induced unitary current example traces during fast pacing and adrenergic stimulation in nonfailing and failing human cardiomyocytes. Including Gap19 in the pipette solution abolished unitary current activity (NCX currents subtracted). (I) Summary dot plot and transition histogram illustrating increased event probability in failing compared with nonfailing myocytes. Gap19 significantly reduced event probability in nonfailing and failing cardiomyocytes (nested 1-way ANOVA; N/nNF = 4/15, N/nHF = 5/15).
Figure 11
Figure 11. Microdomain-specific activation of Cx43 hemichannels in nonfailing and failing human cardiomyocytes.
(A) Transmitted light images of single cardiomyocyte (top) and cardiomyocyte cell pairs (middle, bottom). Triangle, square, circle, and diamond symbols indicate cell-attached macropatch positions at the lateral membrane and cell end of single cardiomyocytes and intercalated disc and side-side of cardiomyocyte cell pairs, respectively. (B) Example traces showing single channel currents recorded at the different macropatch recording positions. Traces recorded in nonfailing and failing human cardiomyocytes during caffeine superfusion (10 mM, 8 seconds) at –70 mV. (C) IV plots depicting linear current-voltage relationship with slope conductance of approximately 220 pS and Erev ≈ 0 mV (N/nNF = 3/10–15 per recording position, N/nHF = 3/10–15 per recording position). (D) Example traces showing single channel currents recorded at the different macropatch recording positions following TAT-Gap19 superfusion. (E) Summary histograms depicting number of channels per patch for the different macropatch recording positions (N/nNF = 3/10–15 per recording position, N/nHF = 3/10–15 per recording position). Black and red bars indicate recordings in nonfailing and failing human cardiomyocytes, respectively. (F) Heatmap summarizing single channel open probability at different macropatch recording positions with and without TAT-Gap19 in nonfailing and failing human single cardiomyocytes and cardiomyocyte cell pairs (N/nNF = 3/10–15 per recording position, N/nHF = 3/10–15 per recording position).
Figure 12
Figure 12. Contribution of Cx43 hemichannels to spontaneous Ca2+ release and afterdepolarizations in human heart failure.
(A) Example traces of spontaneous diastolic Ca2+ release and resulting NCX currents recorded in failing human left ventricular cardiomyocytes following fast pacing and adrenergic stimulation with or without Gap19. (B and C) unitary current detail and associated confocal line scan images during and preceding spontaneous Ca2+ release, respectively. Red line on illustrations indicates scan line position. Dot plots show significant increase in unitary current event probability in failing compared with nonfailing cardiomyocytes. Gap19 abolished unitary current activities (nested 1-way ANOVA; N/nNF = 5/13, N/nHF = 5/14). (D and E) Summary dot plots illustrating increased frequency and significantly increased amplitude of spontaneous Ca2+ release and associated NCX currents in human heart failure. Gap19 abolished Ca2+ release and NCX currents, especially in heart failure (nested 1-way ANOVA; N/nNF = 5/13, N/nHF = 5/14). (F) Example traces of delayed afterdepolarizations and triggered action potentials recorded in a failing human left ventricular cardiomyocytes at baseline and after TAT-Gap19 superfusion. Black arrows indicate DADs, red arrows indicate triggered action potentials. (G) Summary dot plots showing significantly increased frequency and amplitude of DADs and triggered action potential frequency in failing compared with nonfailing cardiac myocytes. TAT-Gap19 abolished DADs and triggered action potentials, especially in human heart failure (nested 1-way ANOVA; N/nNF = 6/22, N/nHF = 5/22). (H) Example ECG (top traces) and monophasic action potential traces (lower traces) recorded during adrenergic stimulation (baseline and after TAT-Gap19) in an arterially perfused left ventricular tissue wedge prepared from failing human heart. Red arrows indicate triggered action potentials. (I) Summary dot plots showing significantly increased frequency and amplitude of DADs and triggered action potential frequency in failing compared with nonfailing tissue wedges. TAT-Gap19 abolished DADs and triggered action potentials, especially in human heart failure (nested 1-way ANOVA; N/nNF = 5/10, N/nHF = 4/9).

References

    1. Giovannone S, et al. Channeling diversity: gap junction expression in the heart. Heart Rhythm. 2012;9(7):1159–1162. doi: 10.1016/j.hrthm.2011.11.040. - DOI - PMC - PubMed
    1. Rhett JM, et al. The perinexus: sign-post on the path to a new model of cardiac conduction? Trends Cardiovasc Med. 2013;23(6):222–228. doi: 10.1016/j.tcm.2012.12.005. - DOI - PMC - PubMed
    1. Wang N, et al. Connexin mimetic peptides inhibit Cx43 hemichannel opening triggered by voltage and intracellular Ca2+ elevation. Basic Res Cardiol. 2012;107(6):304. doi: 10.1007/s00395-012-0304-2. - DOI - PMC - PubMed
    1. Wang N, et al. Selective inhibition of Cx43 hemichannels by Gap19 and its impact on myocardial ischemia/reperfusion injury. Basic Res Cardiol. 2013;108(1):309. doi: 10.1007/s00395-012-0309-x. - DOI - PMC - PubMed
    1. Bol M, et al. At the cross-point of connexins, calcium, and ATP: blocking hemichannels inhibits vasoconstriction of rat small mesenteric arteries. Cardiovasc Res. 2017;113(2):195–206. doi: 10.1093/cvr/cvw215. - DOI - PubMed

Publication types