. 2021 Feb 23;19(2):e3001138.
doi: 10.1371/journal.pbio.3001138. eCollection 2021 Feb.

Silencing of SRRM4 suppresses microexon inclusion and promotes tumor growth across cancers

Affiliations

Silencing of SRRM4 suppresses microexon inclusion and promotes tumor growth across cancers

Sarah A Head et al. PLoS Biol. .

Abstract

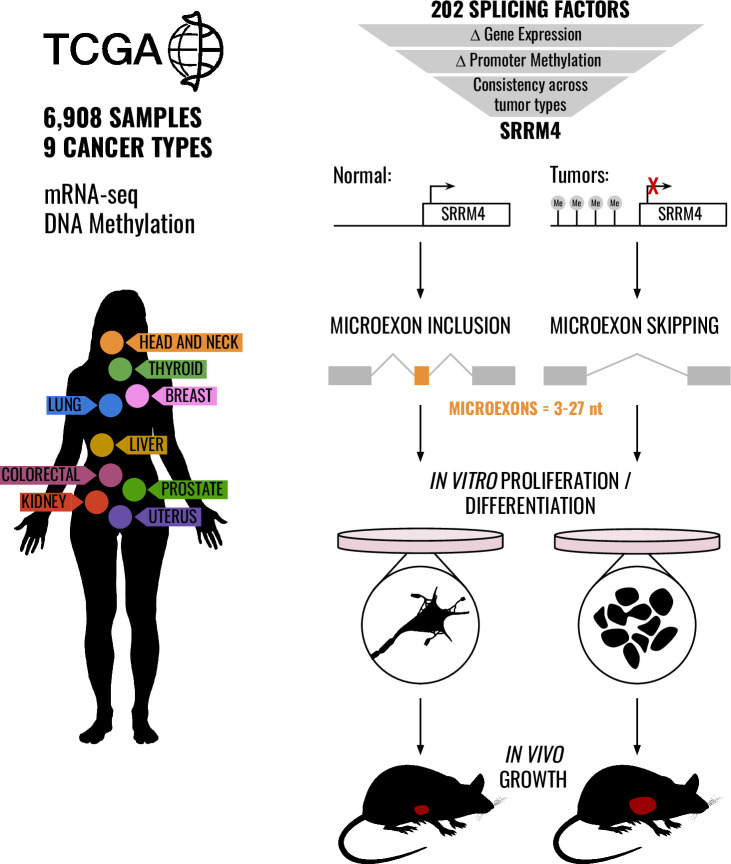
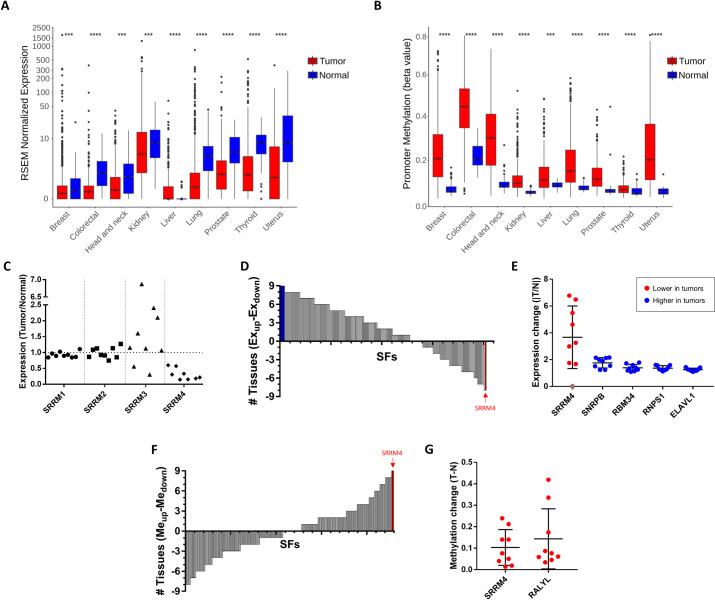
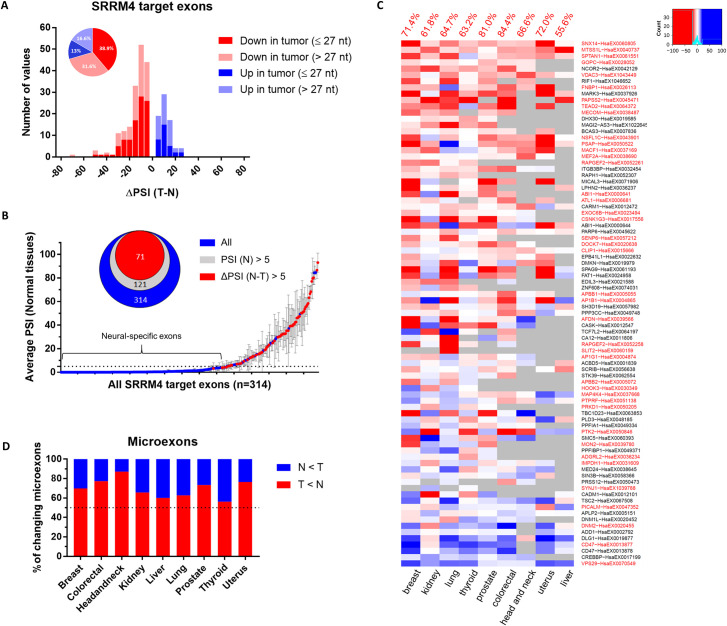
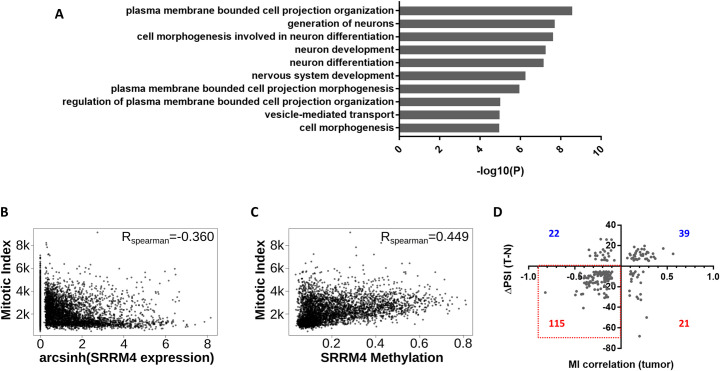
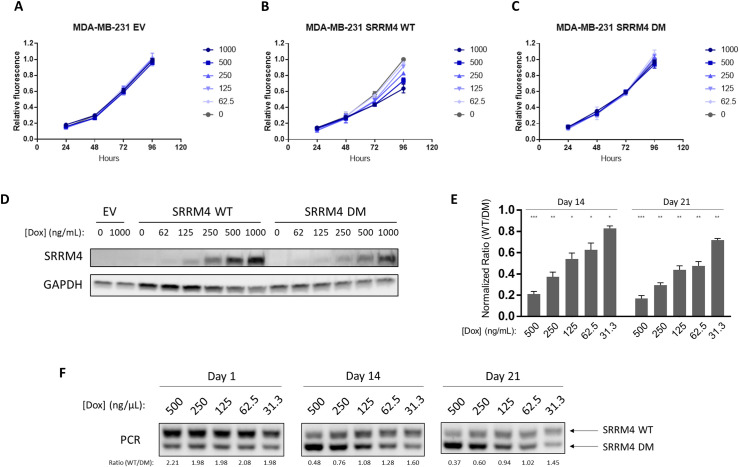
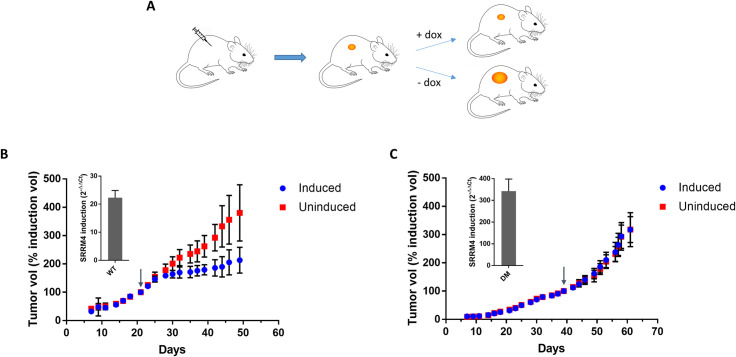
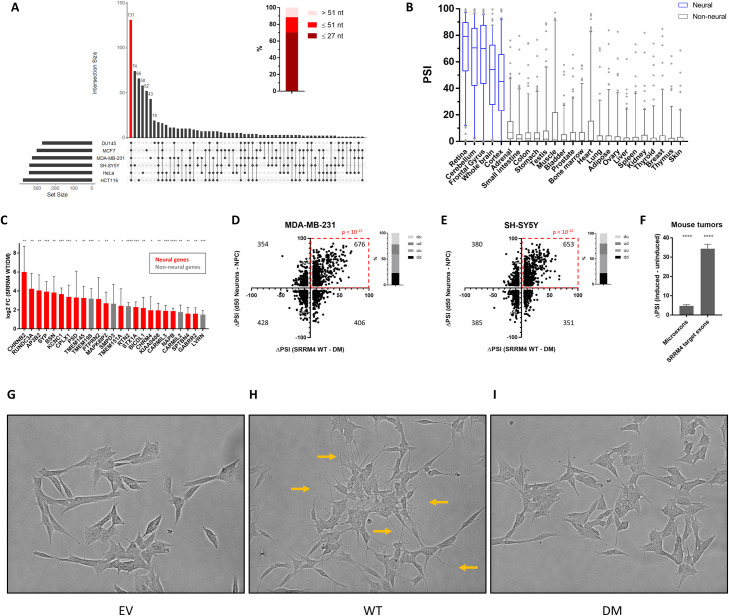
RNA splicing is widely dysregulated in cancer, frequently due to altered expression or activity of splicing factors (SFs). Microexons are extremely small exons (3-27 nucleotides long) that are highly evolutionarily conserved and play critical roles in promoting neuronal differentiation and development. Inclusion of microexons in mRNA transcripts is mediated by the SF Serine/Arginine Repetitive Matrix 4 (SRRM4), whose expression is largely restricted to neural tissues. However, microexons have been largely overlooked in prior analyses of splicing in cancer, as their small size necessitates specialized computational approaches for their detection. Here, we demonstrate that despite having low expression in normal nonneural tissues, SRRM4 is further silenced in tumors, resulting in the suppression of normal microexon inclusion. Remarkably, SRRM4 is the most consistently silenced SF across all tumor types analyzed, implying a general advantage of microexon down-regulation in cancer independent of its tissue of origin. We show that this silencing is favorable for tumor growth, as decreased SRRM4 expression in tumors is correlated with an increase in mitotic gene expression, and up-regulation of SRRM4 in cancer cell lines dose-dependently inhibits proliferation in vitro and in a mouse xenograft model. Further, this proliferation inhibition is accompanied by induction of neural-like expression and splicing patterns in cancer cells, suggesting that SRRM4 expression shifts the cell state away from proliferation and toward differentiation. We therefore conclude that SRRM4 acts as a proliferation brake, and tumors gain a selective advantage by cutting off this brake.


Conflict of interest statement

The authors have declared that no competing interests exist.

Figures

Fig 1
Fig 1. Overview of the study.
We analyze SF dysregulation in tumors across 9 different tissues from TCGA. Out of 202 SFs, only SRRM4 is consistently silenced by promoter hypermethylation across cancers, resulting in suppressed microexon inclusion in tumors. SRRM4 expression in cancer cells leads to differentiated neuron-like splicing and expression patterns, accompanied by a decrease in cell proliferation in vitro and in a mouse xenograft model. mRNA-seq, mRNA sequencing; nt, nucleotide; SF, splicing factor; SRRM4, Serine/Arginine Repetitive Matrix 4; TCGA, The Cancer Genome Atlas.
Fig 2
Fig 2. Analysis of TCGA data reveals SRRM4 silencing in cancer across tissue types.
(A) Changes in SRRM4 expression between normal and tumor samples (2-tailed unpaired Wilcoxon–Mann–Whitney test; * p < 0.05, ** p < 0.01, *** p < 0.001, **** p < 0.0001. Boxes expand from the first to the third quartile, with the center values indicating the median. The whiskers define a confidence interval of median ± 1.58*IQR/√(n)). (B) Changes in SRRM4 promoter methylation between normal and tumor samples (2-tailed unpaired Wilcoxon–Mann–Whitney test; * p < 0.05, ** p < 0.01, *** p < 0.001, **** p < 0.0001. Boxes expand from the first to the third quartile, with the center values indicating the median. The whiskers define a confidence interval of median ± 1.58*IQR/√(n)). (C) SRRM4 is the only SRRM gene family member with consistently changing expression across tissues. Each point in the plot represents the ratio of median expression values between tumor and normal samples for 1 tissue. (D) The sum of the number of tissues with significantly up-regulated (positive) and down-regulated (negative) expression in tumors, for each of the 202 SFs. (E) Fold change in median expression of the 4 SFs that consistently increase across all tumor types (blue) and SRRM4, which decreases in tumors (red), with each point representing 1 tissue. SRRM4 expression in liver, which has a median value of 0.0, is shown in gray. Error bars represent SD. (F) The sum of the number of tissues with significantly up-regulated (positive) and down-regulated (negative) methylation in tumors, for each of the 202 SFs. (G) Fold change in median methylation (beta values) of the 2 SFs that consistently increase across all tumor types, with each point representing 1 tissue. Error bars represent SD. Data underlying Fig 2A and 2B can be found in S1 Data figures. Data underlying Fig 2C–2E can be found in S1 Data. Data underlying Fig 2F and 2G can be found in S2 Data. SF, splicing factor; SRRM4, Serine/Arginine Repetitive Matrix 4; TCGA, The Cancer Genome Atlas.
Fig 3
Fig 3. Inclusion of SRRM4-regulated exons is decreased in tumors and cancer cell lines.
(A) Distribution of ΔPSIs of differentially spliced SRRM4 target exons between normal and tumor samples in the TCGA datasets. Only exons with significant changes (q < 0.01, |ΔPSI| ≥ 5) are shown. Microexons (≤27 nt) and non-microexons (>27 nt) are represented in different color shades as shown in the legend. (B) SRRM4 target exons with respect to their average PSI in normal tissues. Red points are exons with PSI decreasing by at least 5% in at least 1 tumor type. Error bars represent SD of all tissues with quantifiable inclusion levels for each exon. (C) Heatmap of SRRM4 target exons ΔPSIs (Tumor − Normal) across tissue types (red = lower in tumor, blue = higher in tumor). Microexons (≤27 nt) are highlighted in red along the y-axis. The percentage of SRRM4 target exons decreasing in each tumor type is indicated in red on the top. Gray boxes indicate exons without sufficient read coverage for quantification in at least 20 tumor and normal samples. (D) The proportion of differentially regulated microexons (≤27 nt) decreasing (red) vs. increasing (blue) in tumors from each tissue type. Only microexons with significant changes (q < 0.01, |ΔPSI| ≥ 5) are shown. Data underlying Fig 3A can be found in S3 and S4 Data. Data underlying Fig 3B and 3C can be found in S1 Data figures. Data underlying Fig 3D can be found in S3 Data. nt, nucleotide; PSI, percent spliced in; SRRM4, Serine/Arginine Repetitive Matrix 4; TCGA, The Cancer Genome Atlas.
Fig 4
Fig 4. SRRM4 correlates with MI in tumors.
(A) GO term enrichment of genes with down-regulated SRRM4 target exons in tumors from TCGA. The top 10 most significantly enriched terms are shown (GO biological process complete; 2-sided hypergeometric test with Bonferroni step down correction). (B) Spearman correlation of MI gene signature with SRRM4 expression across TCGA tumor samples. Each point represents 1 tumor sample. (C) Spearman correlation of MI gene signature with SRRM4 promoter methylation (beta value) across TCGA tumor samples. Each point represents 1 tumor sample. (D) x-Axis: Spearman correlation coefficient (RSpearman) between MI gene signature and exon PSI for each SRRM4 target exon in tumors; y-axis: ΔPSI (Tumor − Normal). The number of exons in each quadrant is indicated (red indicates negative ΔPSI, and blue indicates positive ΔPSI). Each point represents 1 exon from 1 tissue. Only exons with |ΔPSI| > 5 and q < 0.01 are shown. Data underlying Fig 4A can be found in S5 Data. Data underlying Fig 4B–4D can be found in S1 Data figures. GO, gene ontology; MI, mitotic index; PSI, percent spliced in; SRRM4, Serine/Arginine Repetitive Matrix 4; TCGA, The Cancer Genome Atlas.
Fig 5
Fig 5. SRRM4 expression inhibits cancer cell proliferation.
Growth curves of MDA-MB-231 transduced with (A) EV, (B) WT SRRM4, or (C) DM SRRM4, treated with indicated concentrations of doxycycline (ng/mL). Error bars represent SEM of 2–3 independent experiments. (D) Western blot of SRRM4 expression in the same cell lines after 24 h induction with doxycycline at the indicated concentrations. Results are representative of 2 independent experiments. (E) Ratios of WT/DM SRRM4 in MDA-MB-231 cocultures show a dose- and time-dependent decrease (normalized to Day 1) that is significant at every doxycycline concentration tested (unpaired t test using Holm–Sidak method to correct for multiple comparisons; * p < 0.05, ** p < 0.01, *** p < 0.001). Results shown represent the mean of 3 independent experiments, and error bars represent standard deviation. (F) Representative PCR showing the decreased WT/DM ratios of MDA-MB-231 cocultures over time. WT/DM ratios quantified by densitometry are shown below each sample. The apparent WT/DM ratio at Day 1 is approximately 2:1, due to the formation of a chimeric PCR product of intermediate size close to the WT band. However, the ratios quantified at Day 14 and Day 21 decrease with respect to Day 1 in both a dose- and time-dependent manner, indicating that the DM cells outcompete the WT. Data underlying Fig 5A–5C and 5E can be found in S1 Data figures. DM, deletion mutant; EV, empty vector; SEM, standard error of the mean; SRRM4, Serine/Arginine Repetitive Matrix 4; WT, wild-type.
Fig 6
Fig 6. SRRM4 induction inhibits tumor growth in vivo.
(A) Schematic overview of mouse experiment. Mice were implanted with MDA-MB-231 cells with inducible SRRM4 expression (WT or DM), and tumors were allowed to grow to a certain size before induction with doxycycline in drinking water (2 mg/mL). (B) WT SRRM4 tumors grew significantly more slowly in mice receiving doxycycline than uninduced mice. Tumor volume was normalized to tumor volume at the time of induction (arrow). Error bars represent standard deviation, n = 6 per group. Inset: SRRM4 overexpression in induced tumors relative to uninduced tumors was quantified by qPCR using the ΔΔCt method, with GAPDH as internal control. Error bars represent SEM of 2 experimental replicates. (C) Tumors expressing the inactive SRRM4 mutant (DM) showed no difference in growth rate with or without doxycycline induction. Tumor volume was normalized to tumor volume at the time of induction (arrow). Error bars represent standard deviation, n = 6 per group. Inset: SRRM4 overexpression in induced tumors relative to uninduced tumors was quantified by qPCR using the ΔΔCt method, with GAPDH as internal control. Error bars represent SEM of 2 experimental replicates. Data underlying Fig 6B and 6C can be found in S1 Data figures. DM, deletion mutant; qPCR, quantitative PCR; SEM, standard error of the mean; SRRM4, Serine/Arginine Repetitive Matrix 4; WT, wild-type.
Fig 7
Fig 7. SRRM4 expression leads to neural-like expression and splicing patterns and morphological changes in cancer cells.
(A) Exons with increased inclusion in all 6 cell lines after SRRM4 induction (ΔPSI ≥ 25). Inset: nucleotide lengths of the 131 shared exons, demonstrating a majority are microexons. The cell lines comprising each intersection set are indicated below each bar. Figure was generated using UpSet package in R. (B) Box plots of the PSIs of the 131 SRRM4-regulated exons shared between the 6 cell lines across tissue types (from VastDB). Boxes expand from the first to the third quartile, with the center values indicating the median, and whiskers extend from 5 to 95 percentile. (C) Genes with increased expression in all 6 cell lines after SRRM4 induction (fold change ≥2 compared to DM control). Bars represent the mean fold change values, with error bars representing 95% CI. Red bars are genes with known neuronal function (GO: nervous system development) and/or neural-specific expression patterns. Fold change values shown are significantly different from 0 (1-sample t test, 2-tailed; *p < 0.05, ** p < 0.01, *** p < 0.001, **** p < 0.0001). (D, E) Overlap between changes in exon inclusion with neuronal differentiation dataset after 7 d of SRRM4 induction in (D) MDA-MB-231 or (E) SH-SY5Y (p-values shown from binomial test). (F) Changes in inclusion of microexons (≤27 nt) and SRRM4 target exons between the doxycycline-induced and uninduced mouse tumors. Bars represent the mean ΔPSI of the sets of exons, with error bars representing 95% CI. The mean ΔPSI for both sets of exons was significantly different than 0 (1-sample t test, 2-tailed; **** p < 0.0001). (G, I) SH-SY5Y cells were transduced with (G) EV, (H) WT SRRM4, or (I) DM SRRM4. Cell images were taken after 7 d induction with 1 μg/mL doxycycline. WT SRRM4-expressing cells develop numerous membrane projections (orange arrows). Results shown are representative of 3 independent experiments. Data underlying Fig 7A–7F can be found in S1 Data figures. DM, deletion mutant; EV, empty vector; GO, gene ontology; nt, nucleotide; PSI, percent spliced in; SRRM4, Serine/Arginine Repetitive Matrix 4; WT, wild-type.

References

    1. Irimia M, Weatheritt RJ, Ellis JD, Parikshak NN, Gonatopoulos-Pournatzis T, Babor M, et al.. A Highly Conserved Program of Neuronal Microexons Is Misregulated in Autistic Brains. Cell. 2014;159:1511–23. 10.1016/j.cell.2014.11.035 - DOI - PMC - PubMed
    1. Ustianenko D, Weyn-Vanhentenryck SM, Zhang C. Microexons: discovery, regulation, and function: Microexons: discovery, regulation, and function. Wiley Interdisciplinary Reviews. RNA. 2017;8:e1418. 10.1002/wrna.1418 - DOI - PMC - PubMed
    1. Calarco JA, Superina S, O’Hanlon D, Gabut M, Raj B, Pan Q, et al.. Regulation of Vertebrate Nervous System Alternative Splicing and Development by an SR-Related Protein. Cell. 2009;138:898–910. 10.1016/j.cell.2009.06.012 - DOI - PubMed
    1. Nakano Y, Jahan I, Bonde G, Sun X, Hildebrand MS, Engelhardt JF, et al.. A Mutation in the Srrm4 Gene Causes Alternative Splicing Defects and Deafness in the Bronx Waltzer Mouse. Barsh GS, editor. PLoS Genet. 2012;8:e1002966. 10.1371/journal.pgen.1002966 - DOI - PMC - PubMed
    1. Quesnel-Vallières M, Irimia M, Cordes SP, Blencowe BJ. Essential roles for the splicing regulator nSR100/SRRM4 during nervous system development. Genes Dev. 2015;29:746–59. 10.1101/gad.256115.114 - DOI - PMC - PubMed

Publication types