. 2021 May;48(5):2271-2278.
doi: 10.1002/mp.14801. Epub 2021 Mar 22.

Analysis of characteristics of images acquired with a prototype clinical proton radiography system

Affiliations

Analysis of characteristics of images acquired with a prototype clinical proton radiography system

Christina Sarosiek et al. Med Phys. 2021 May.

Abstract

Purpose: Verification of patient-specific proton stopping powers obtained in the patient's treatment position can be used to reduce the distal and proximal margins needed in particle beam planning. Proton radiography can be used as a pretreatment instrument to verify integrated stopping power consistency with the treatment planning CT. Although a proton radiograph is a pixel by pixel representation of integrated stopping powers, the image may also be of high enough quality and contrast to be used for patient alignment. This investigation quantifies the accuracy and image quality of a prototype proton radiography system on a clinical proton delivery system.

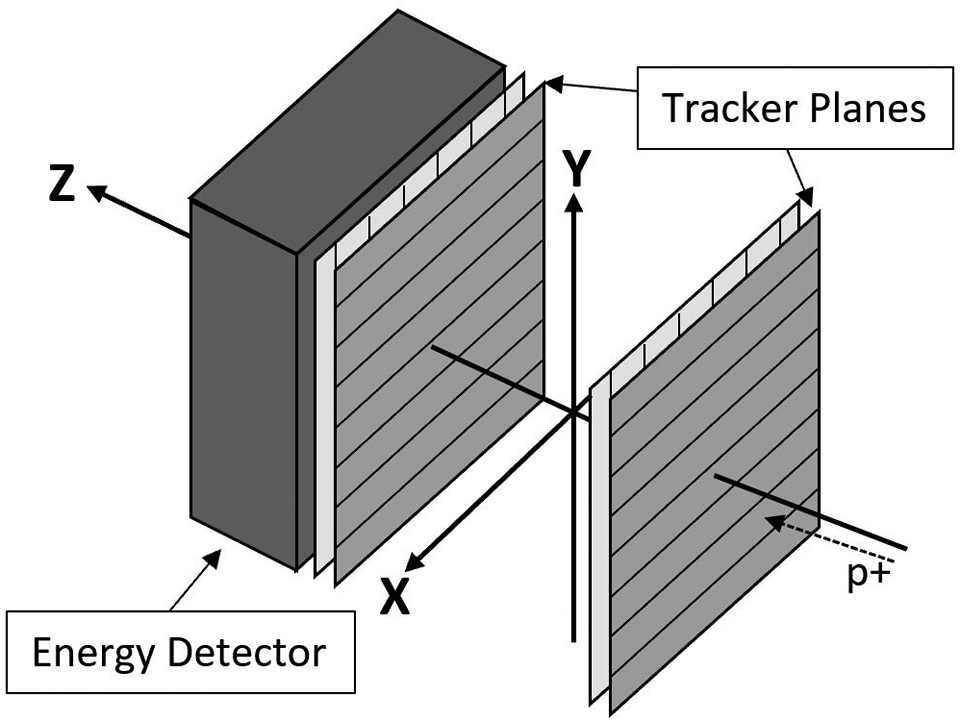
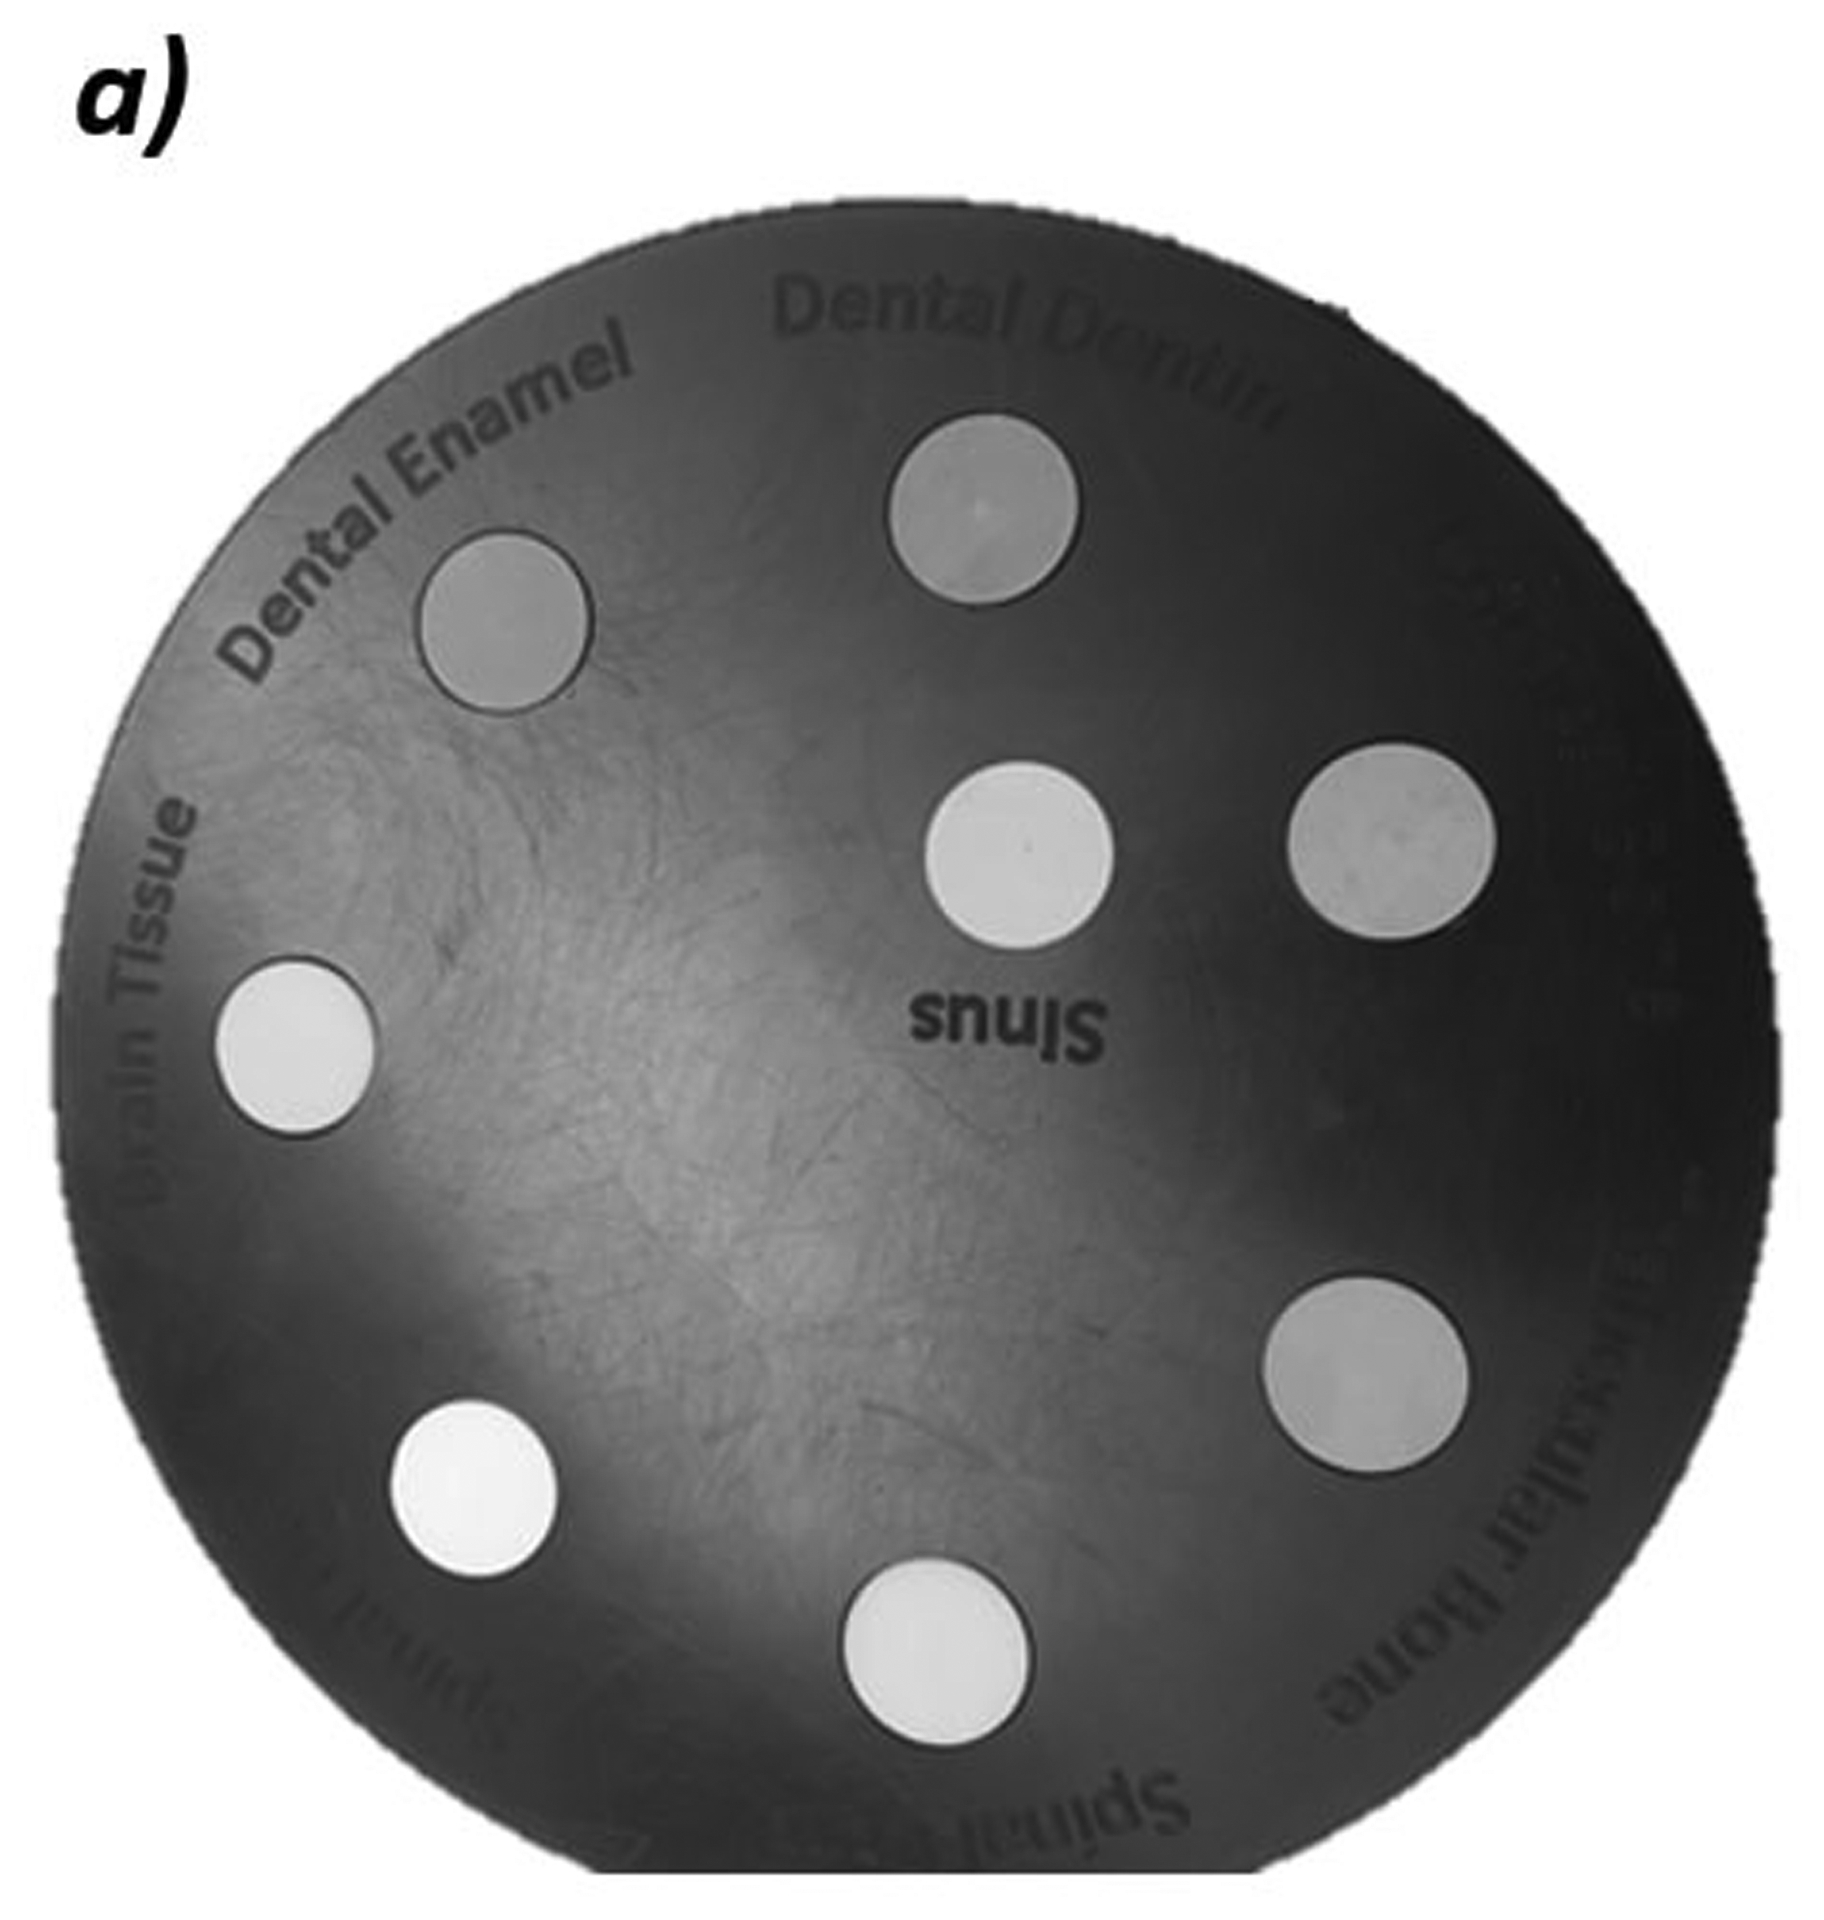
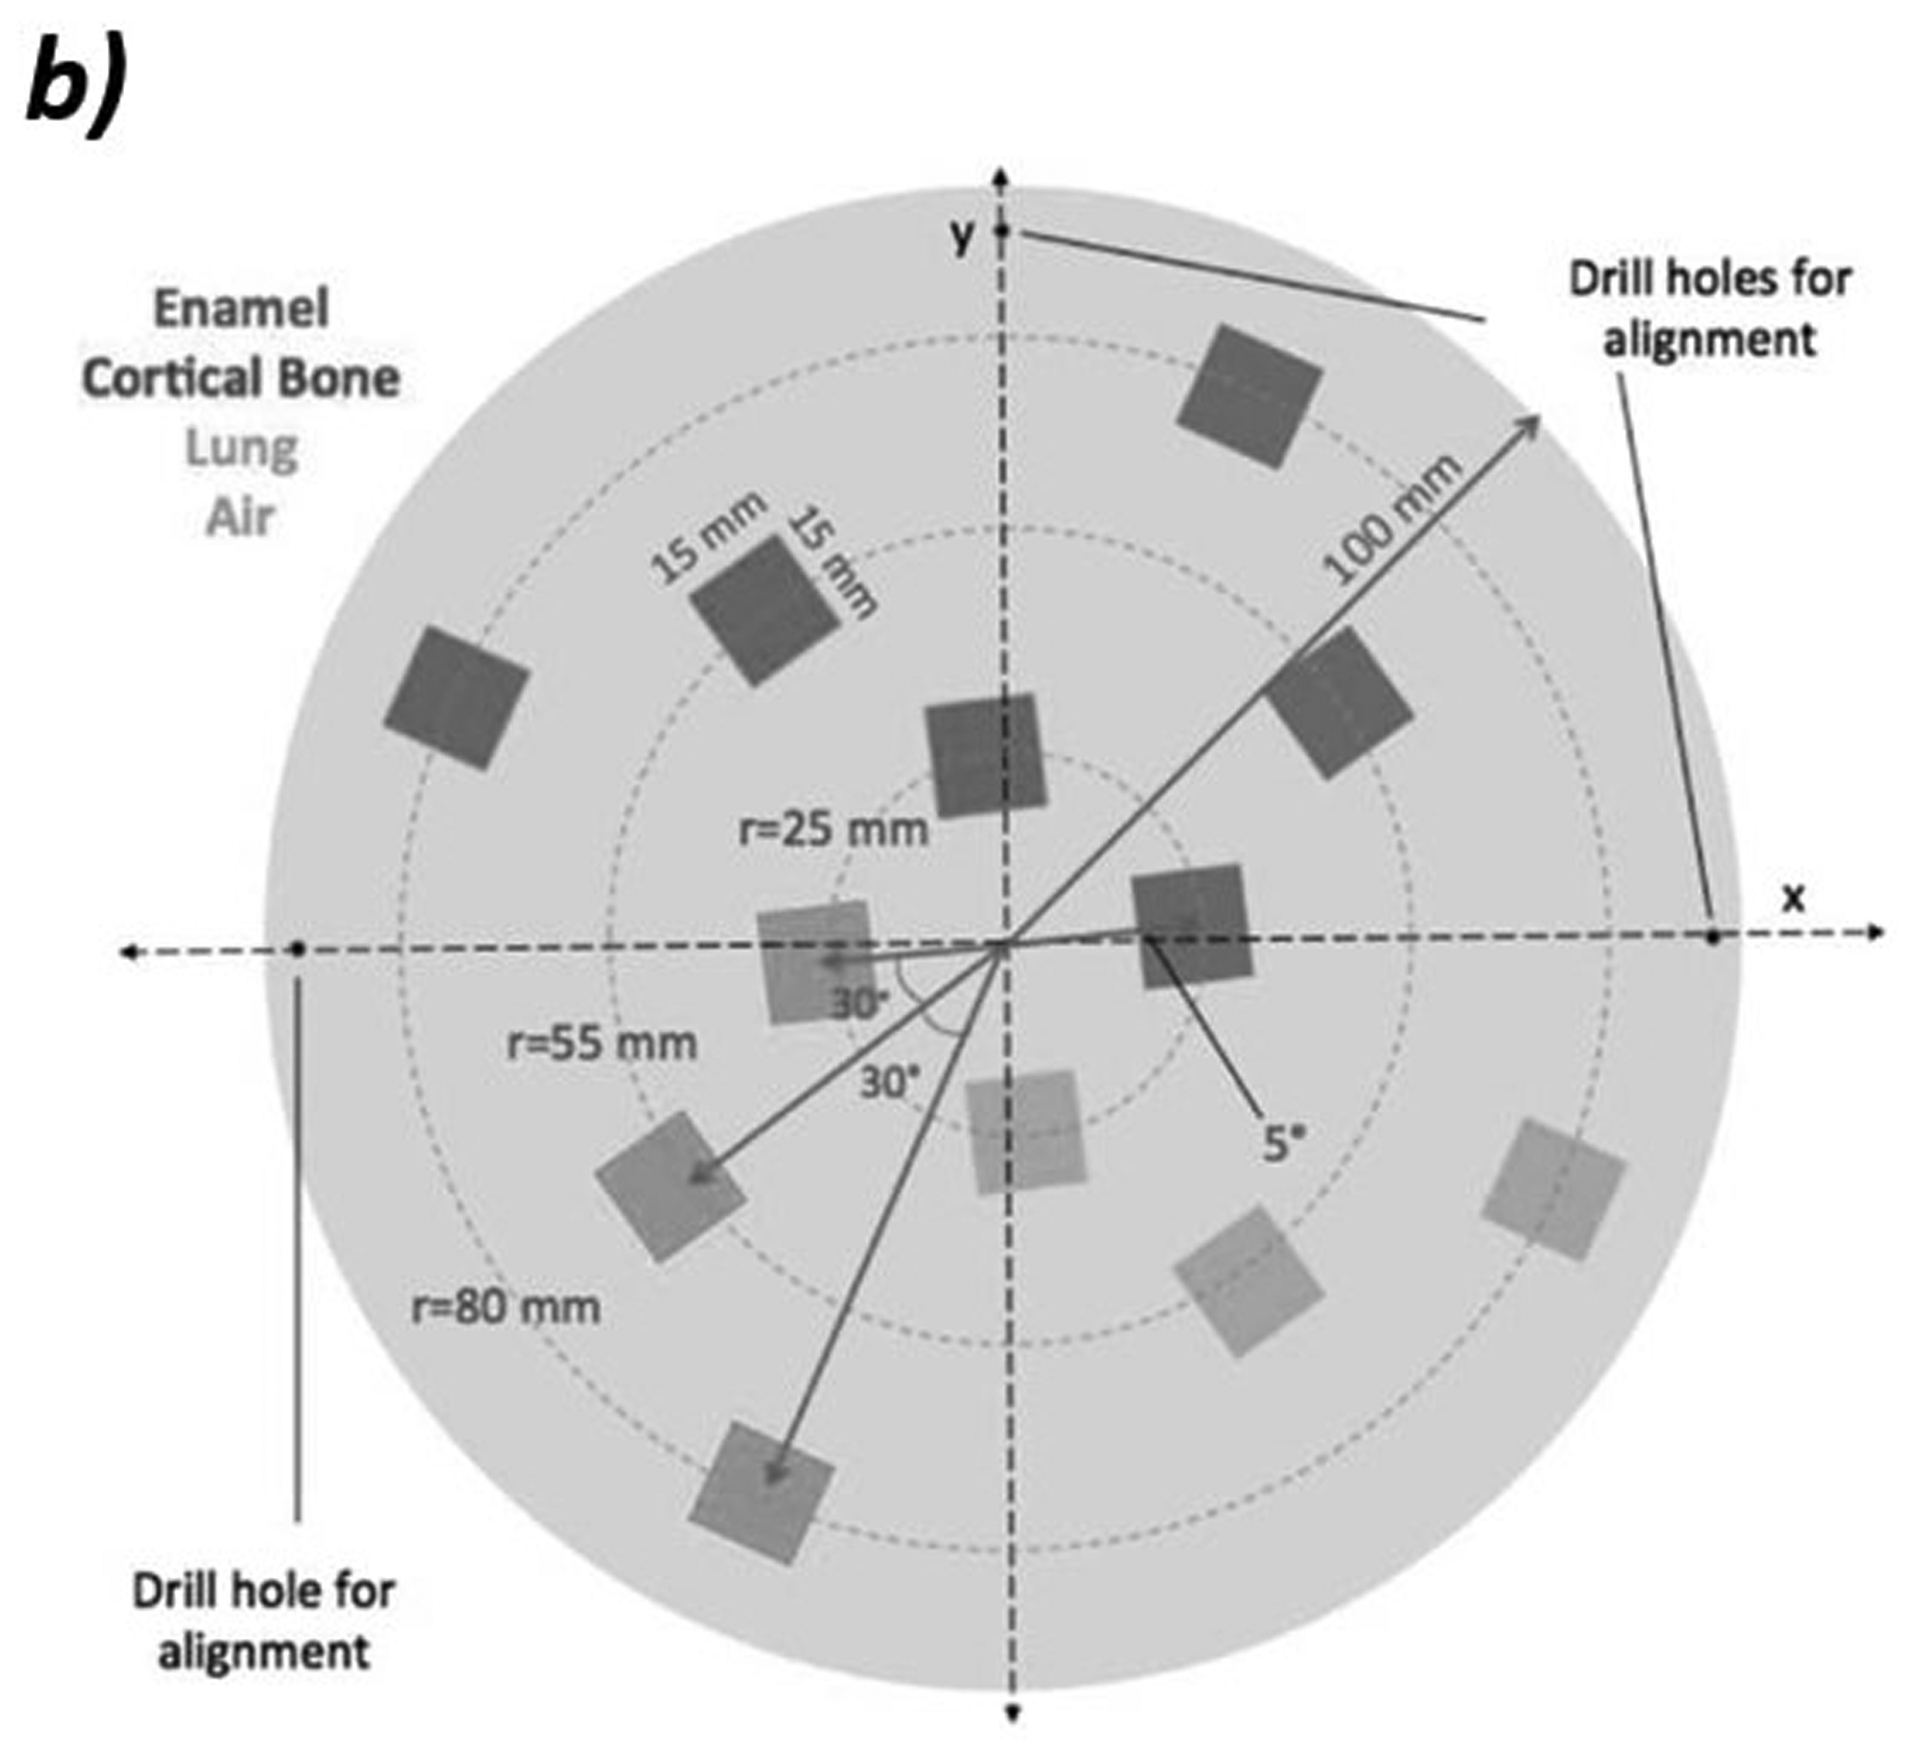
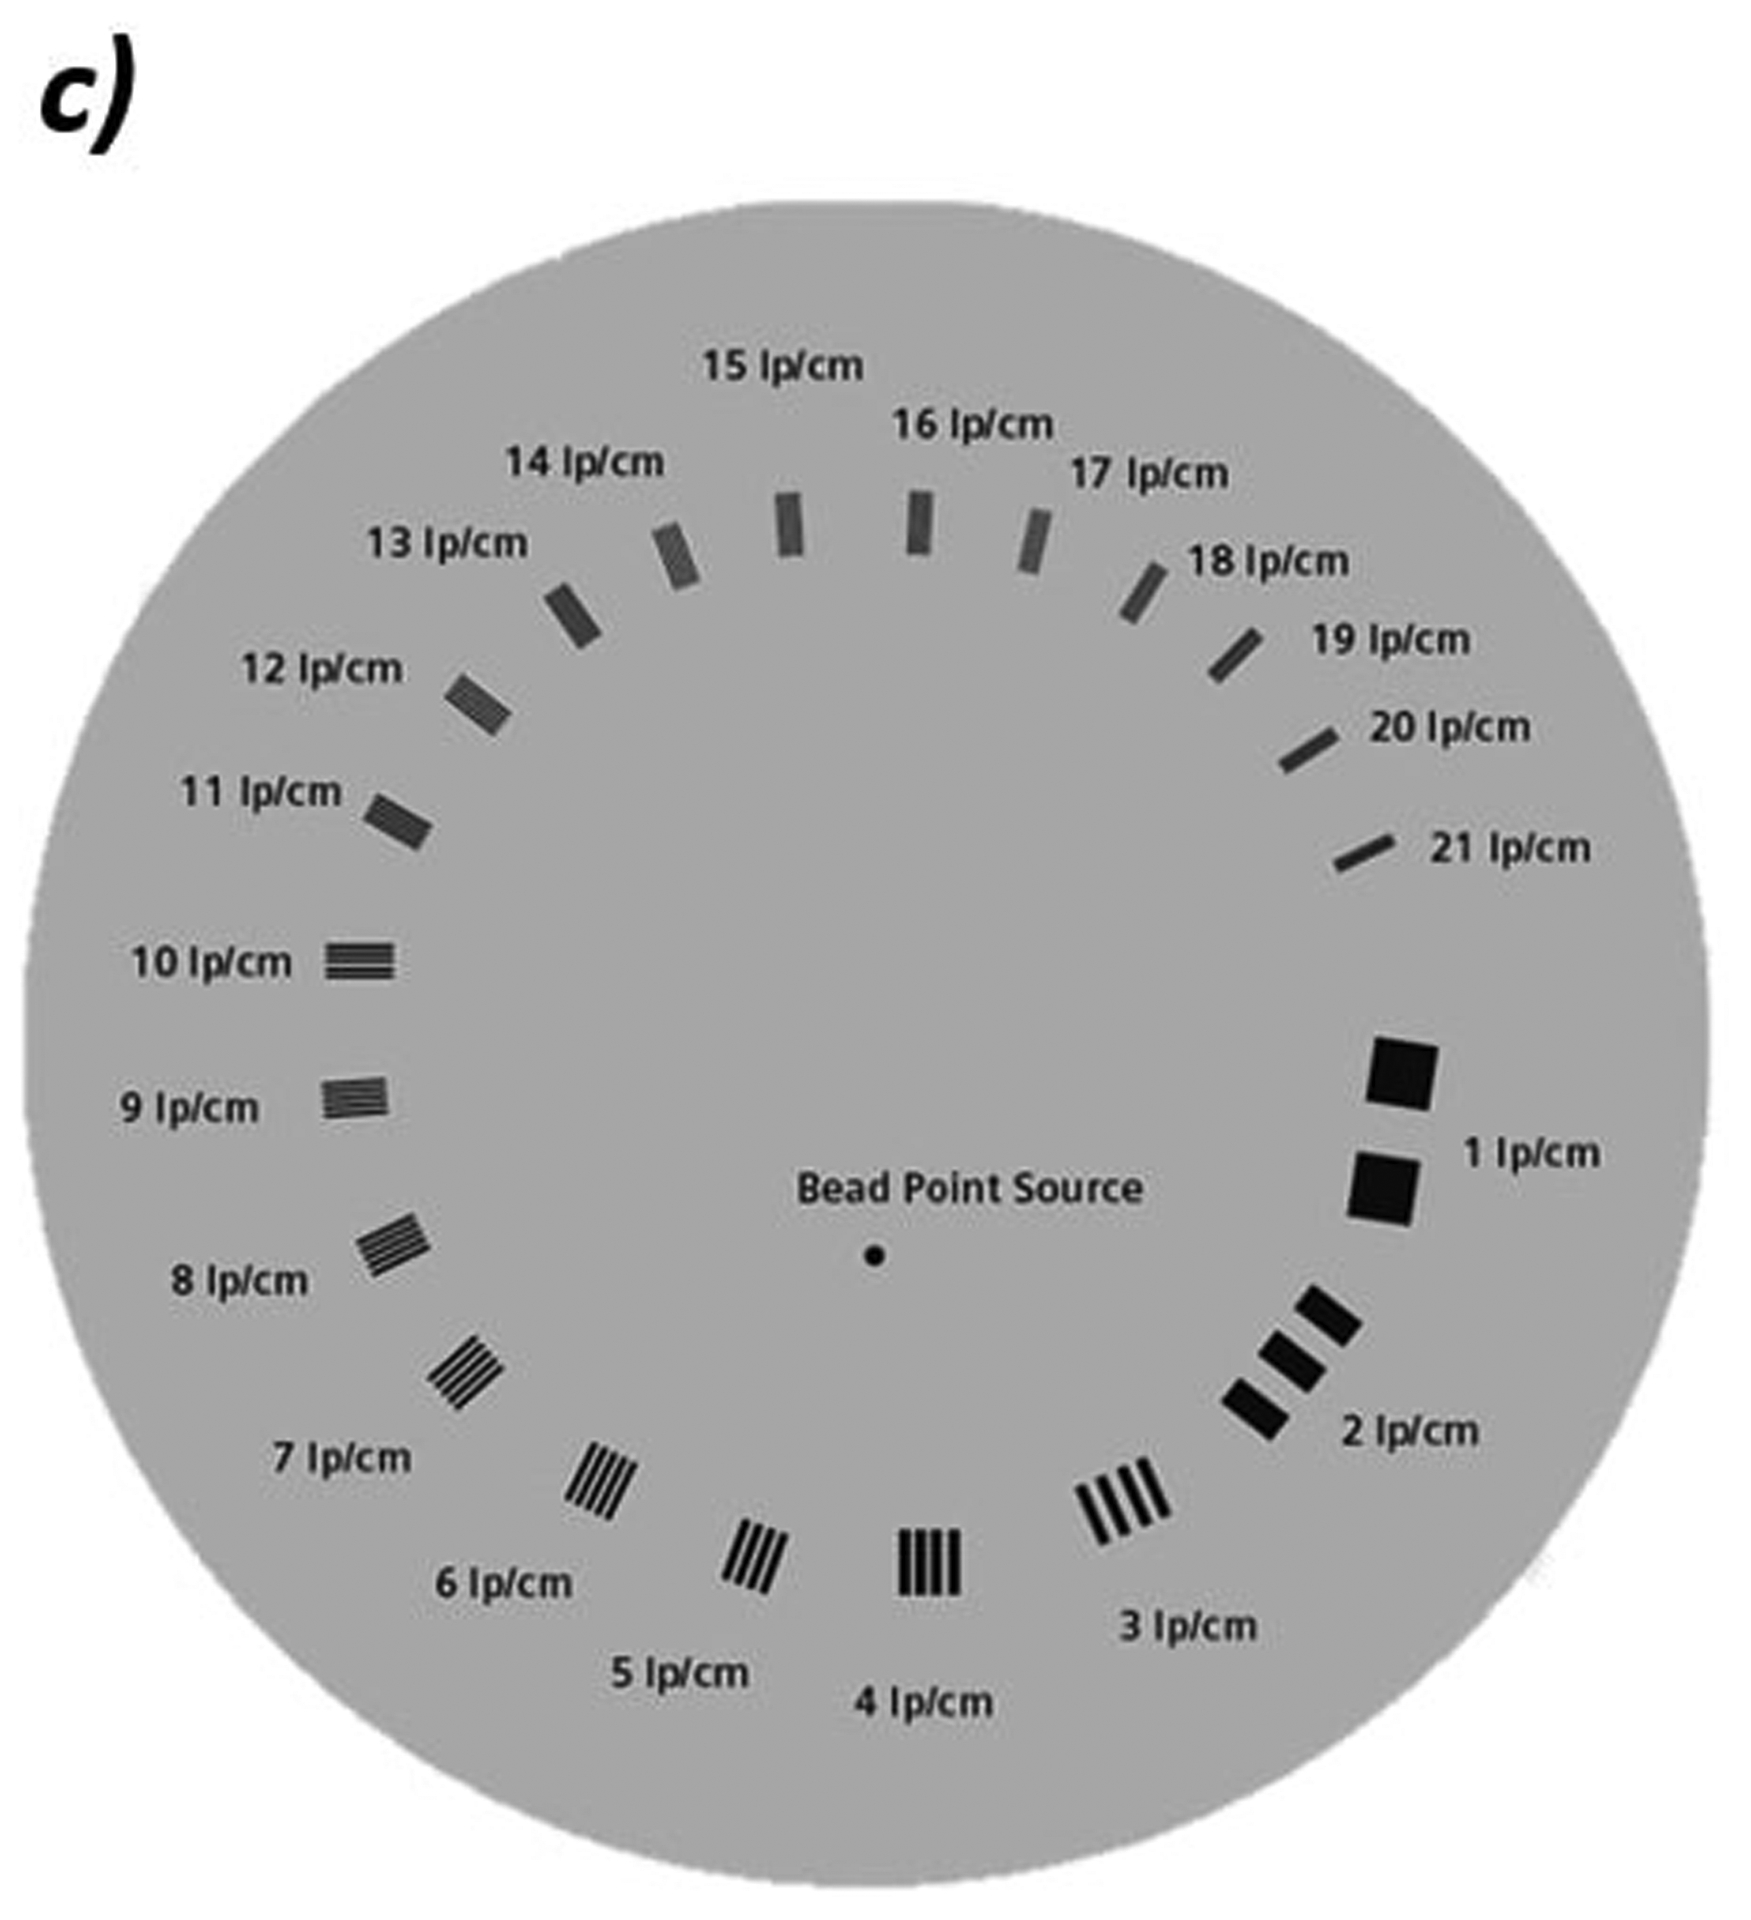
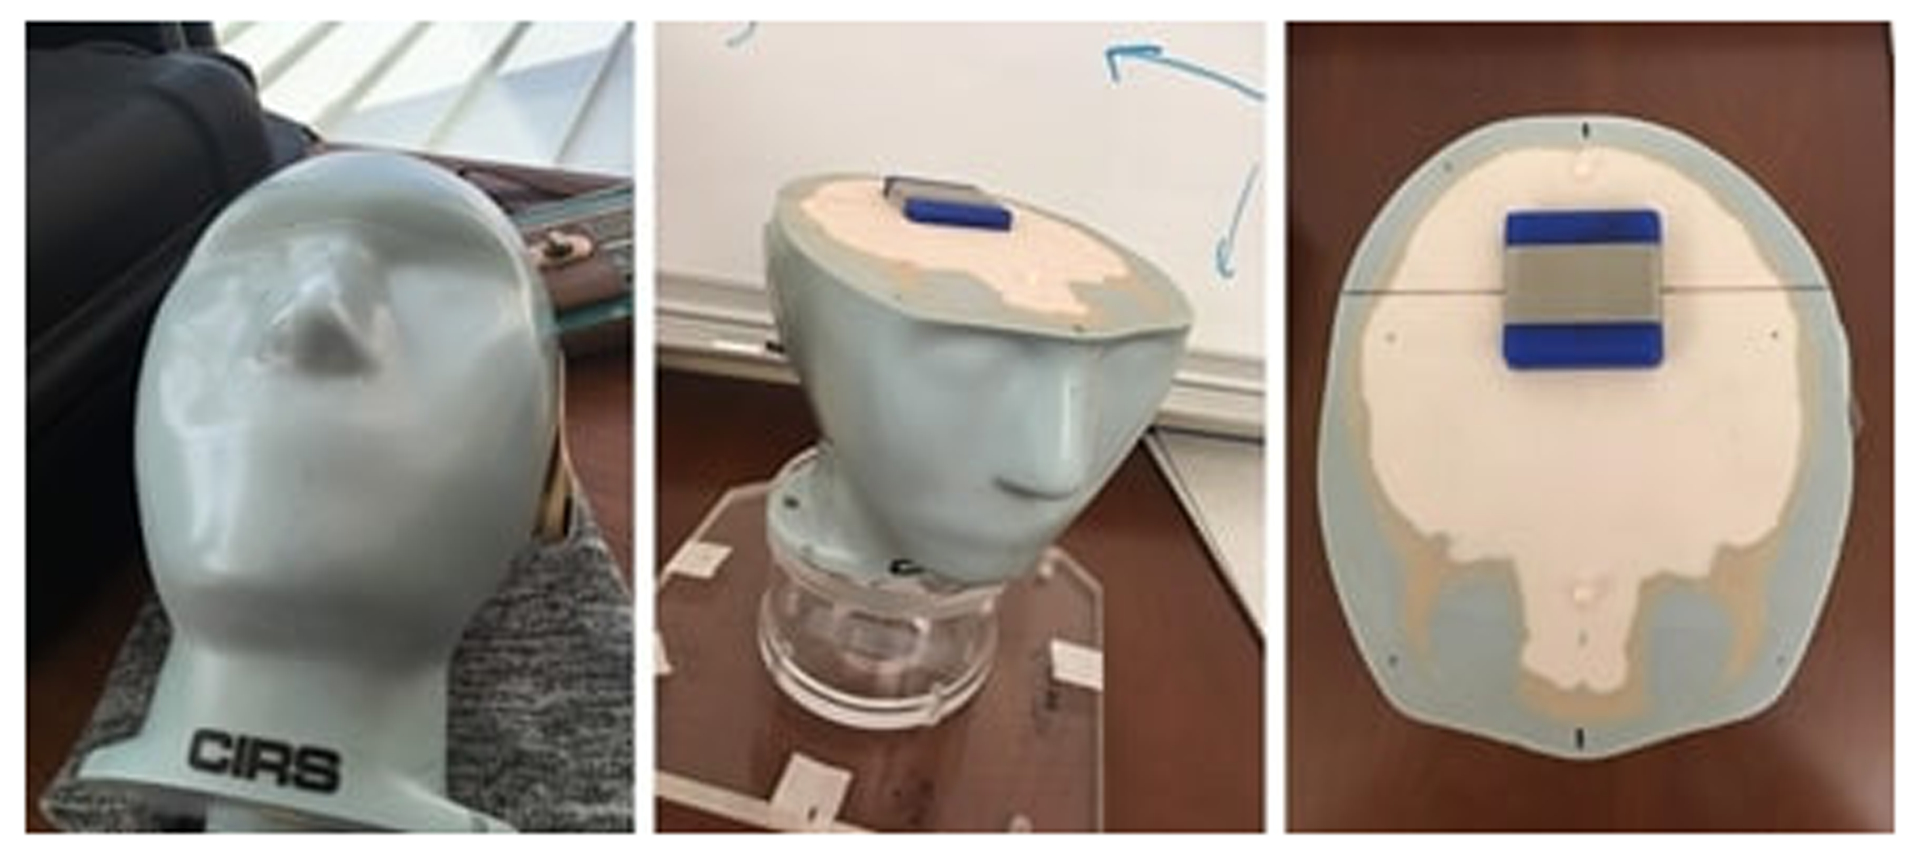
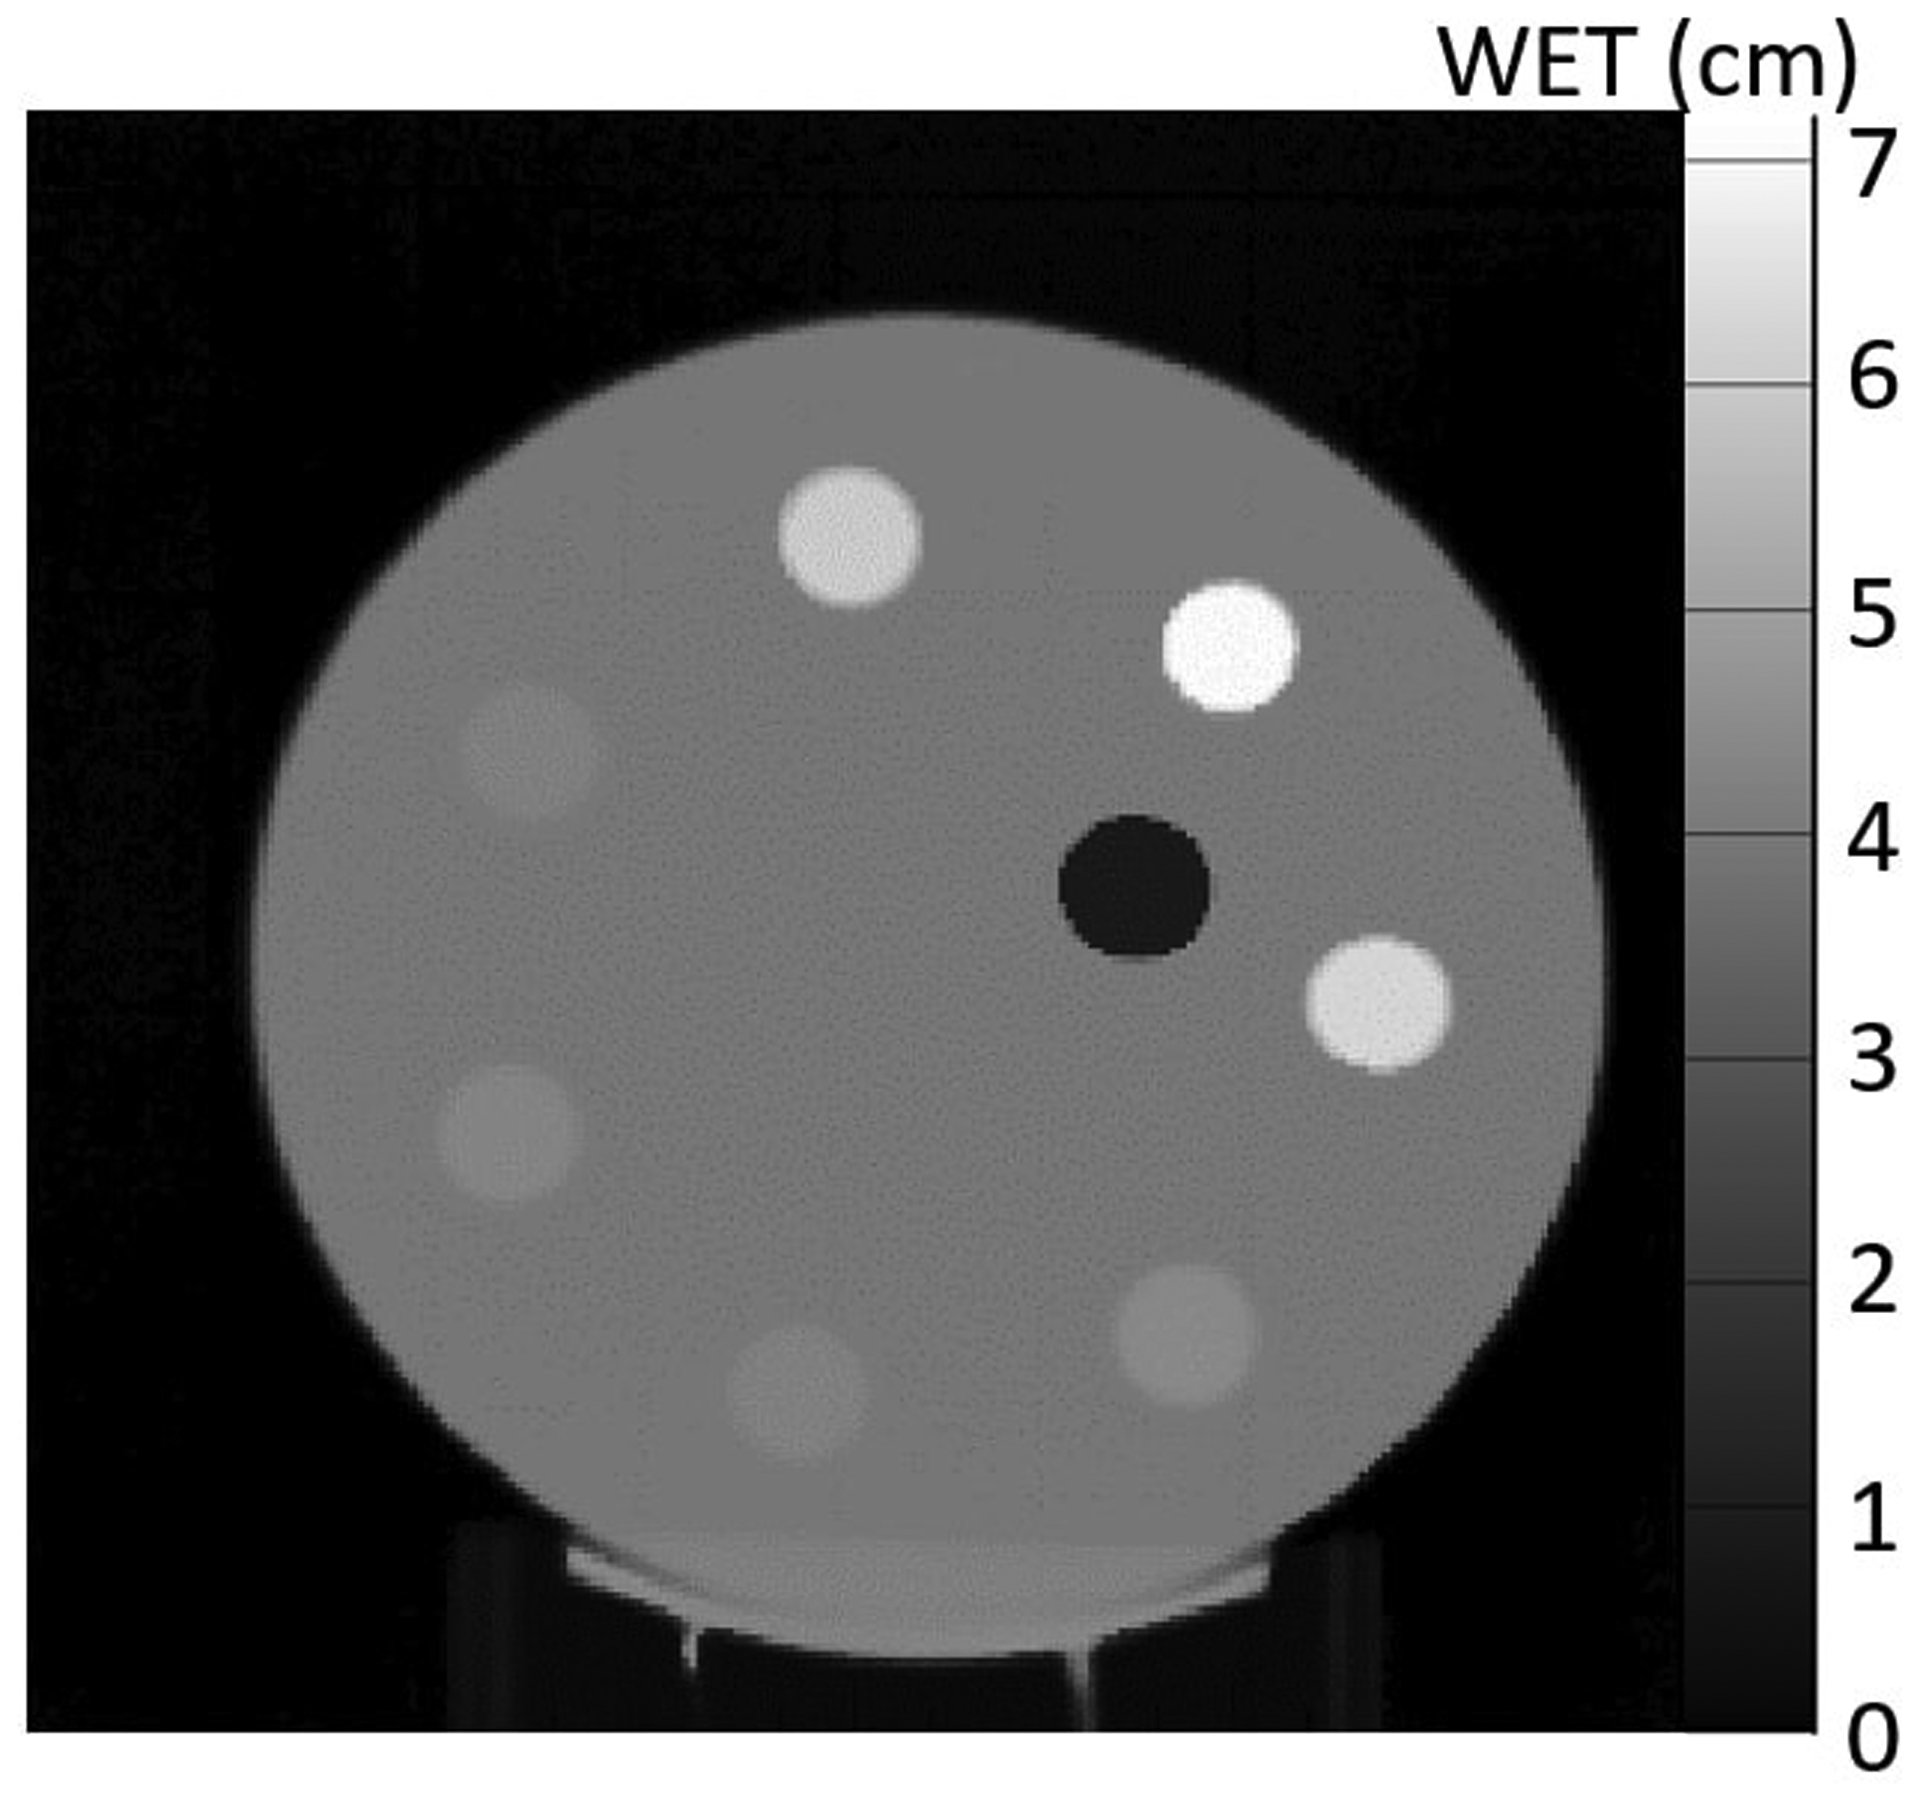
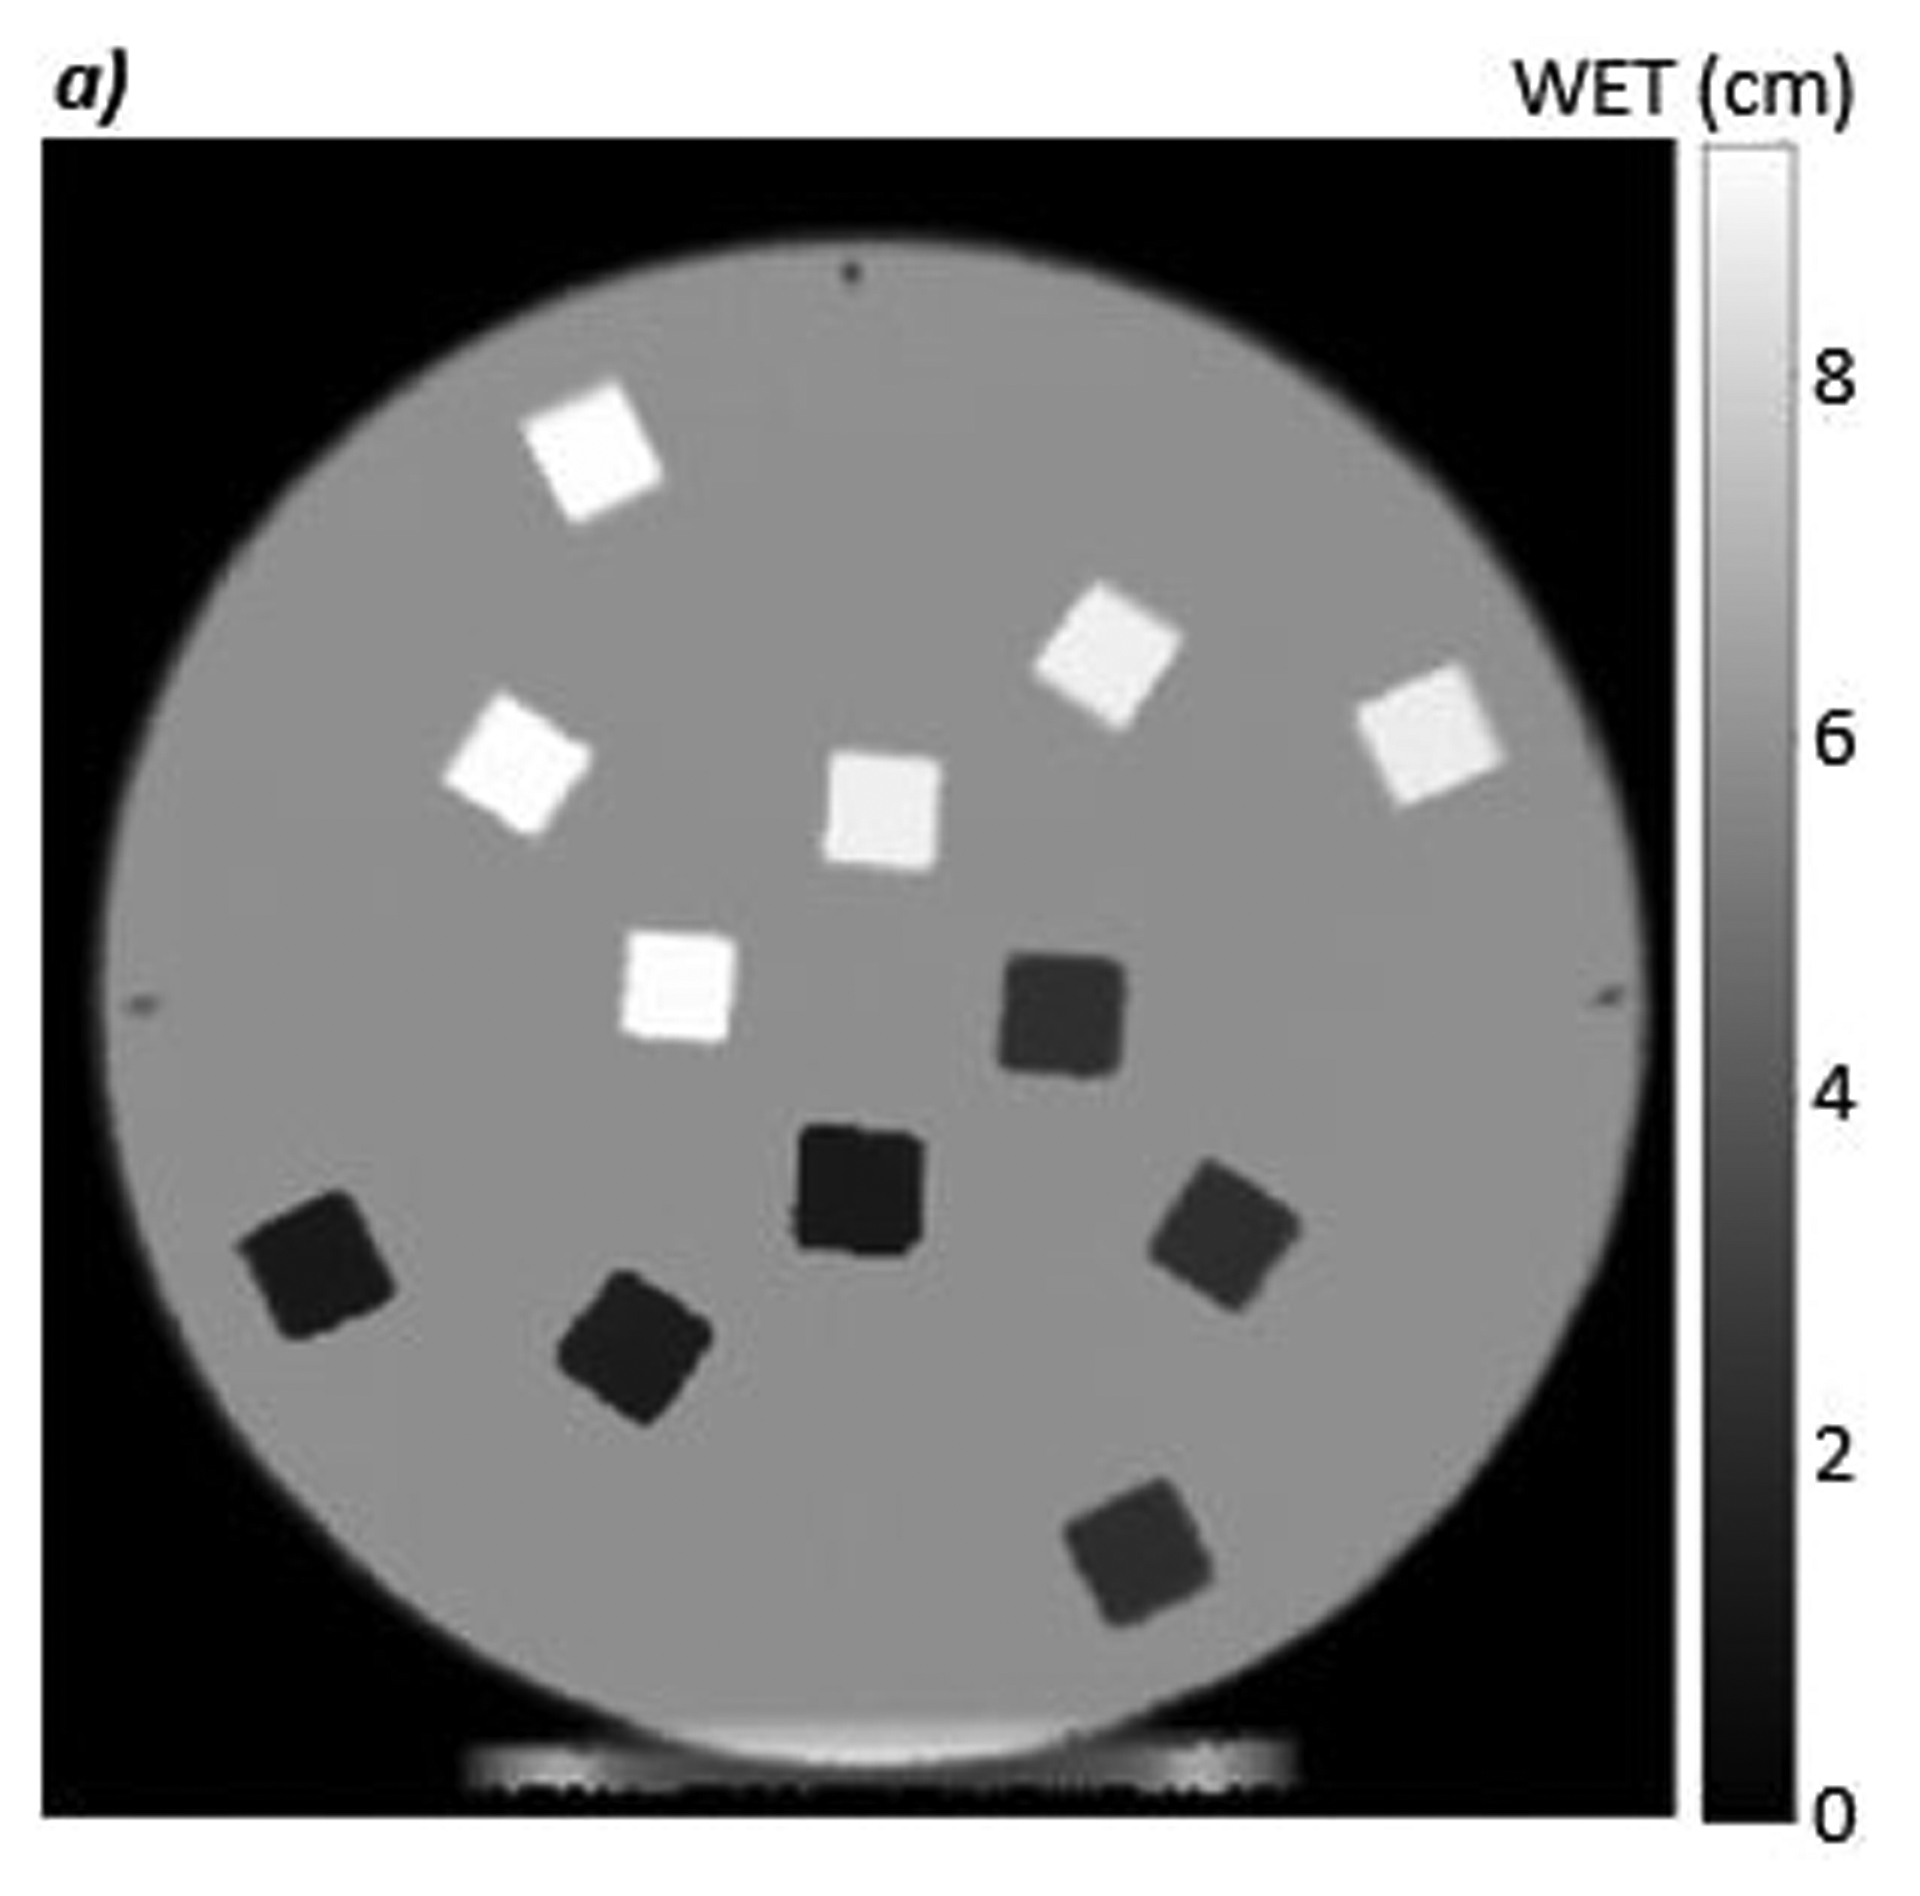
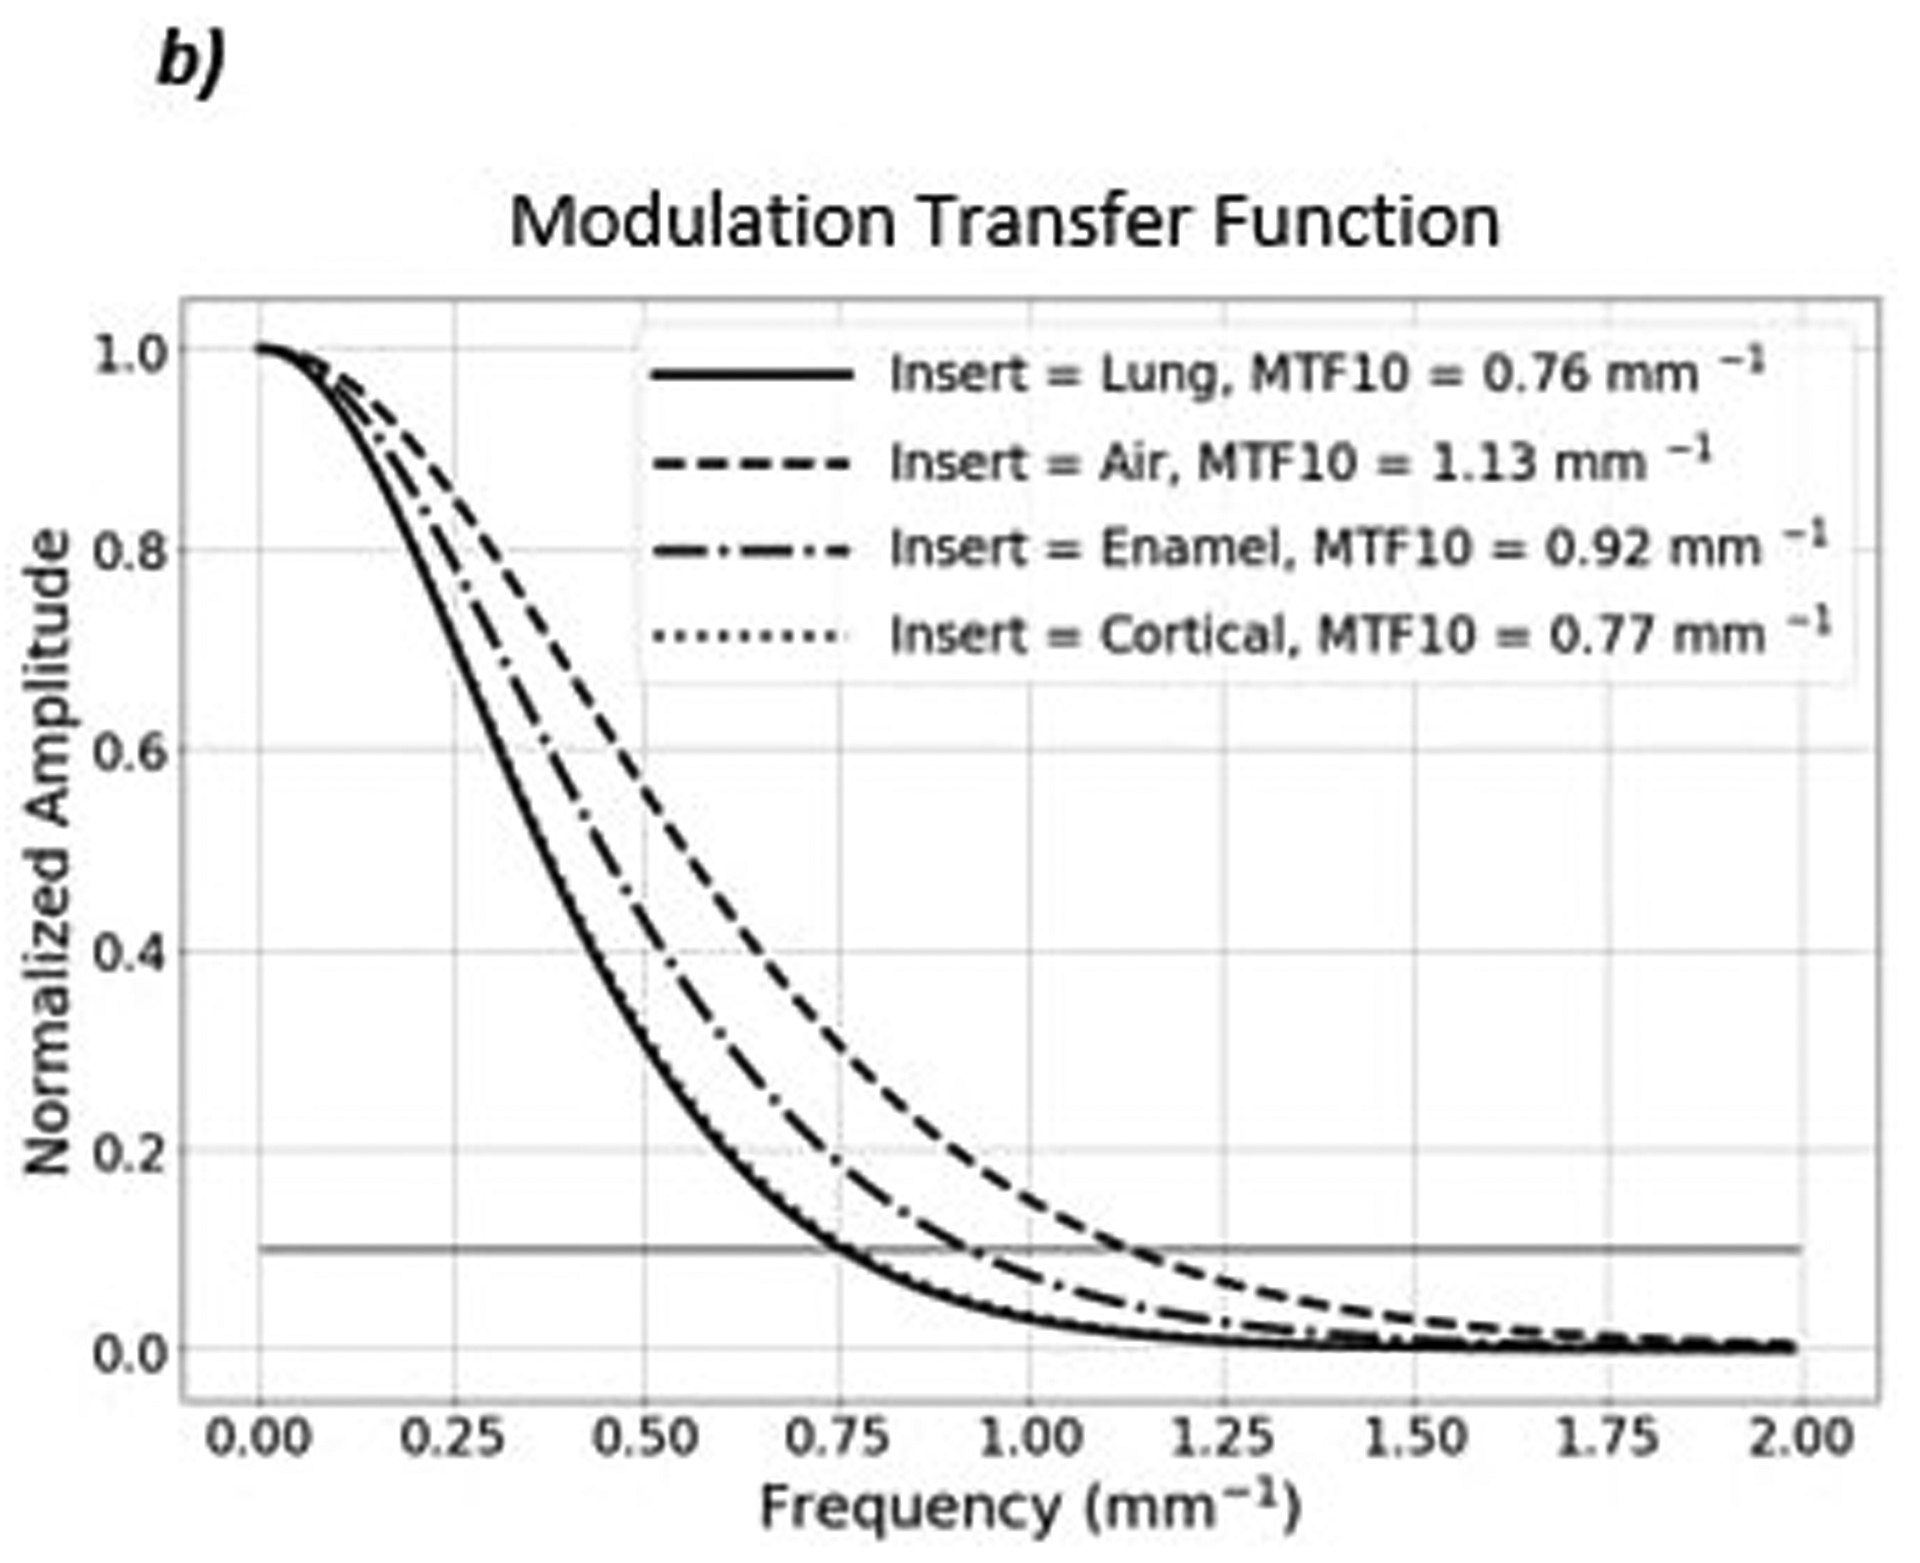
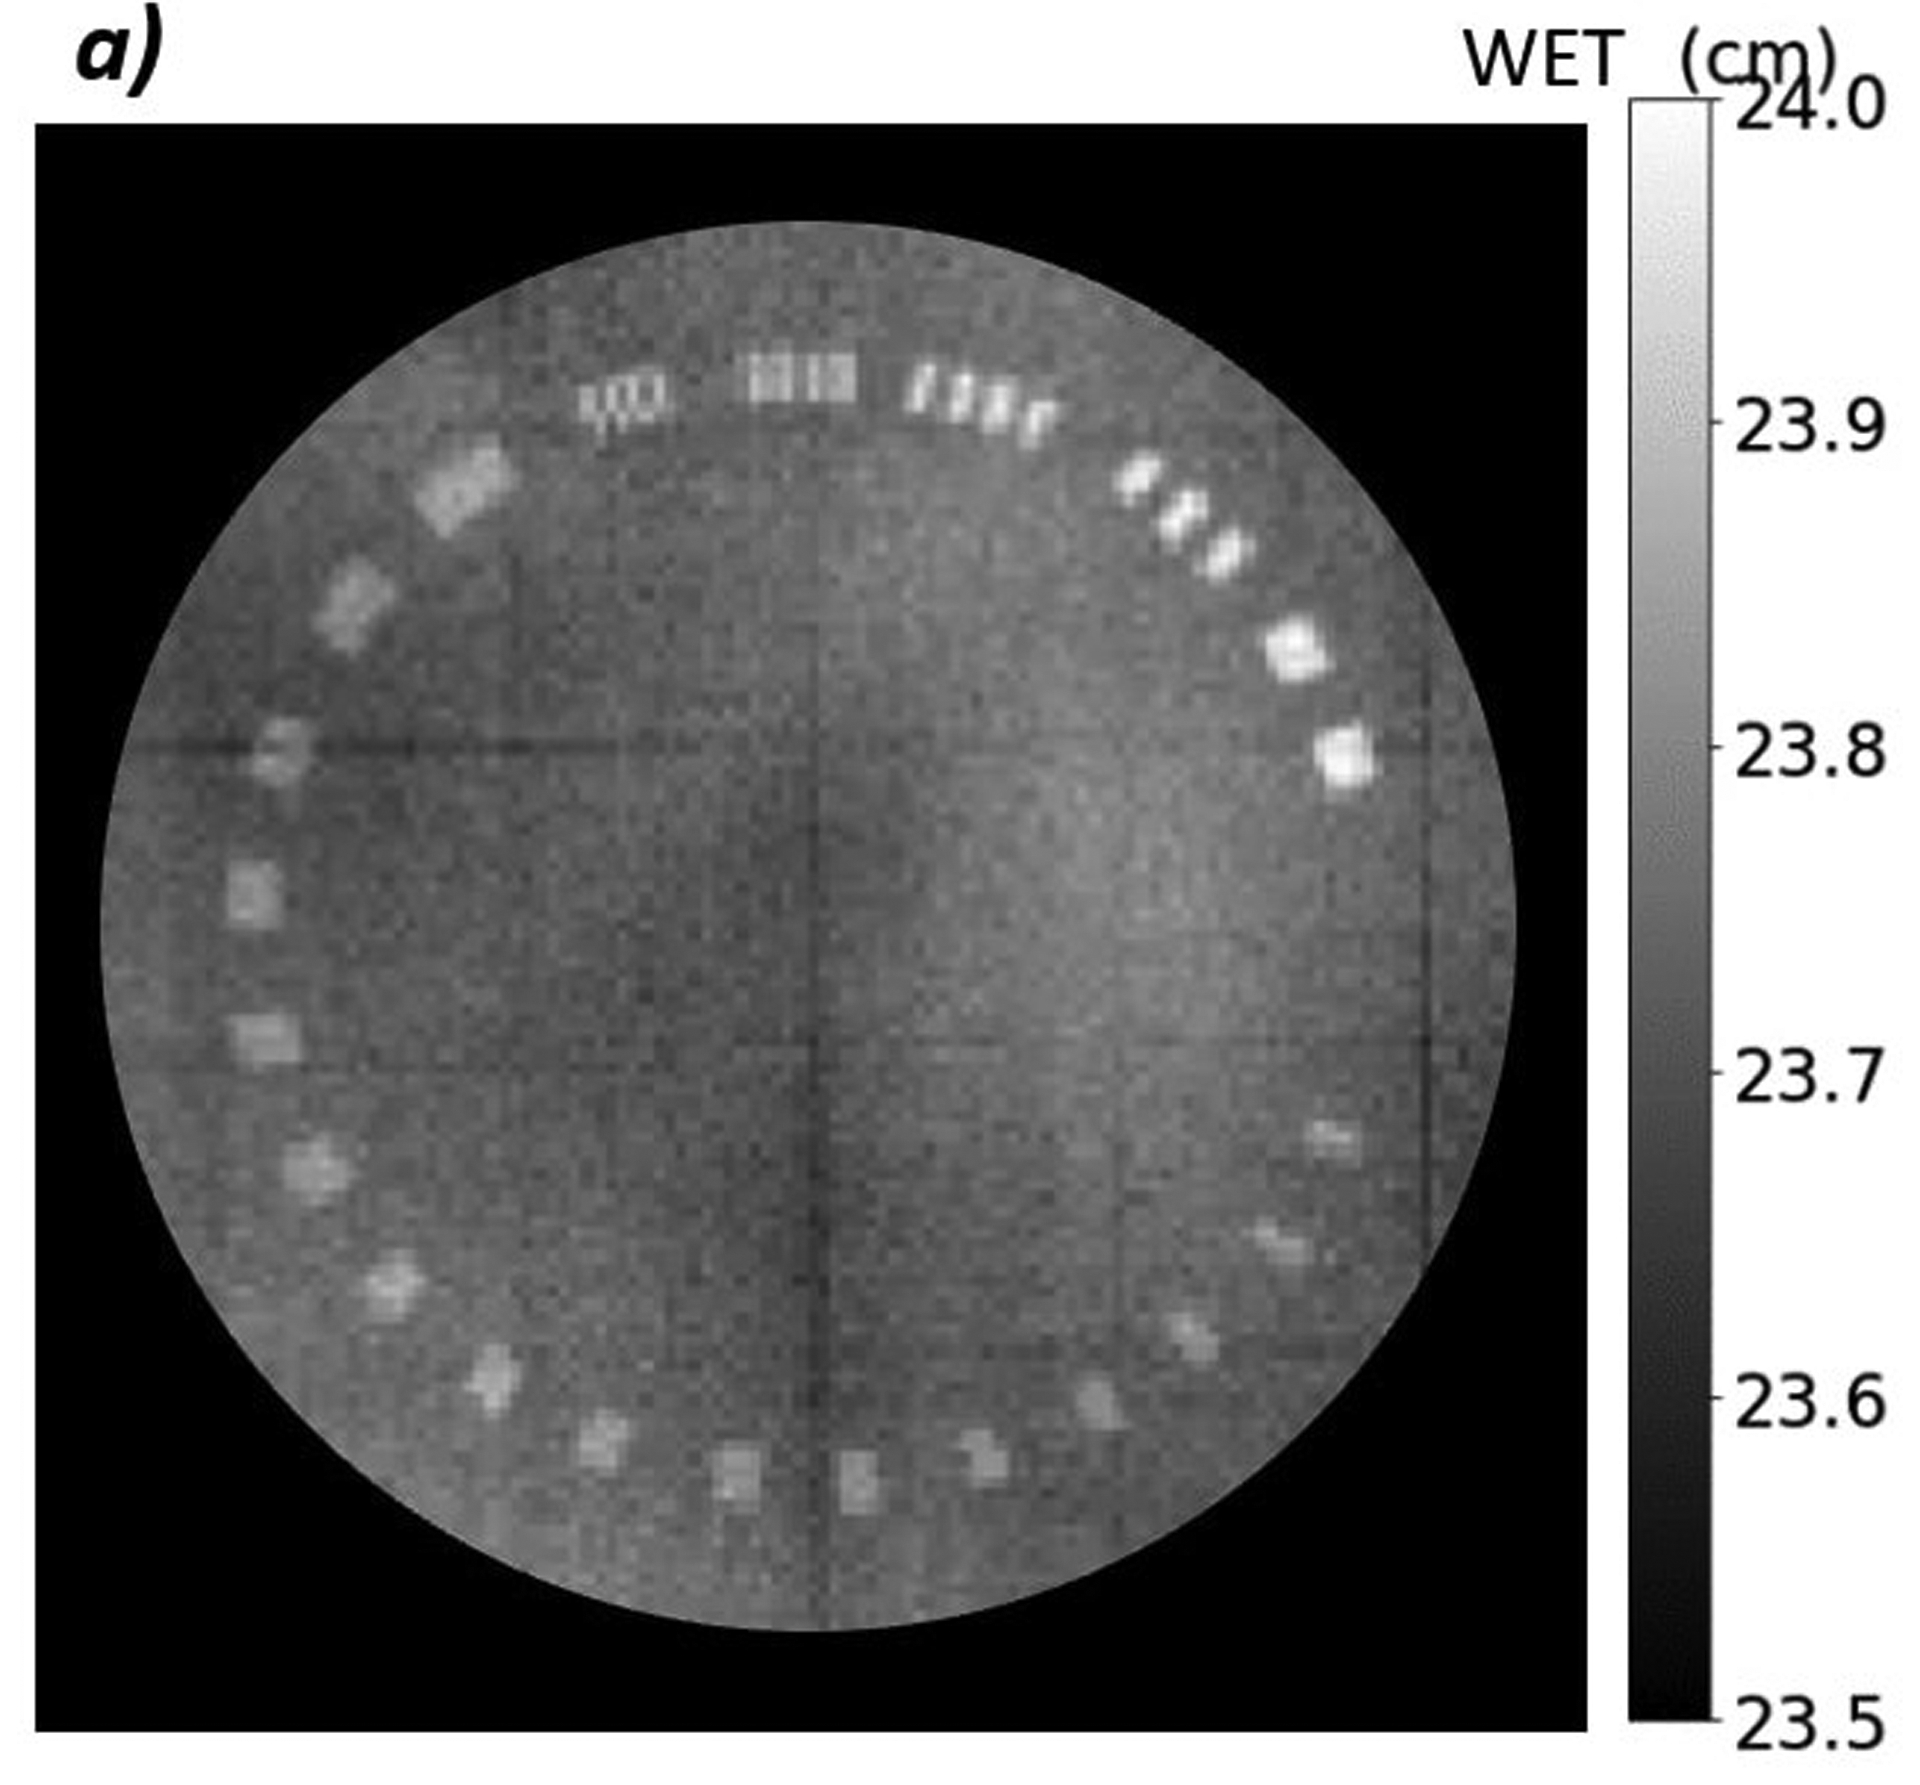
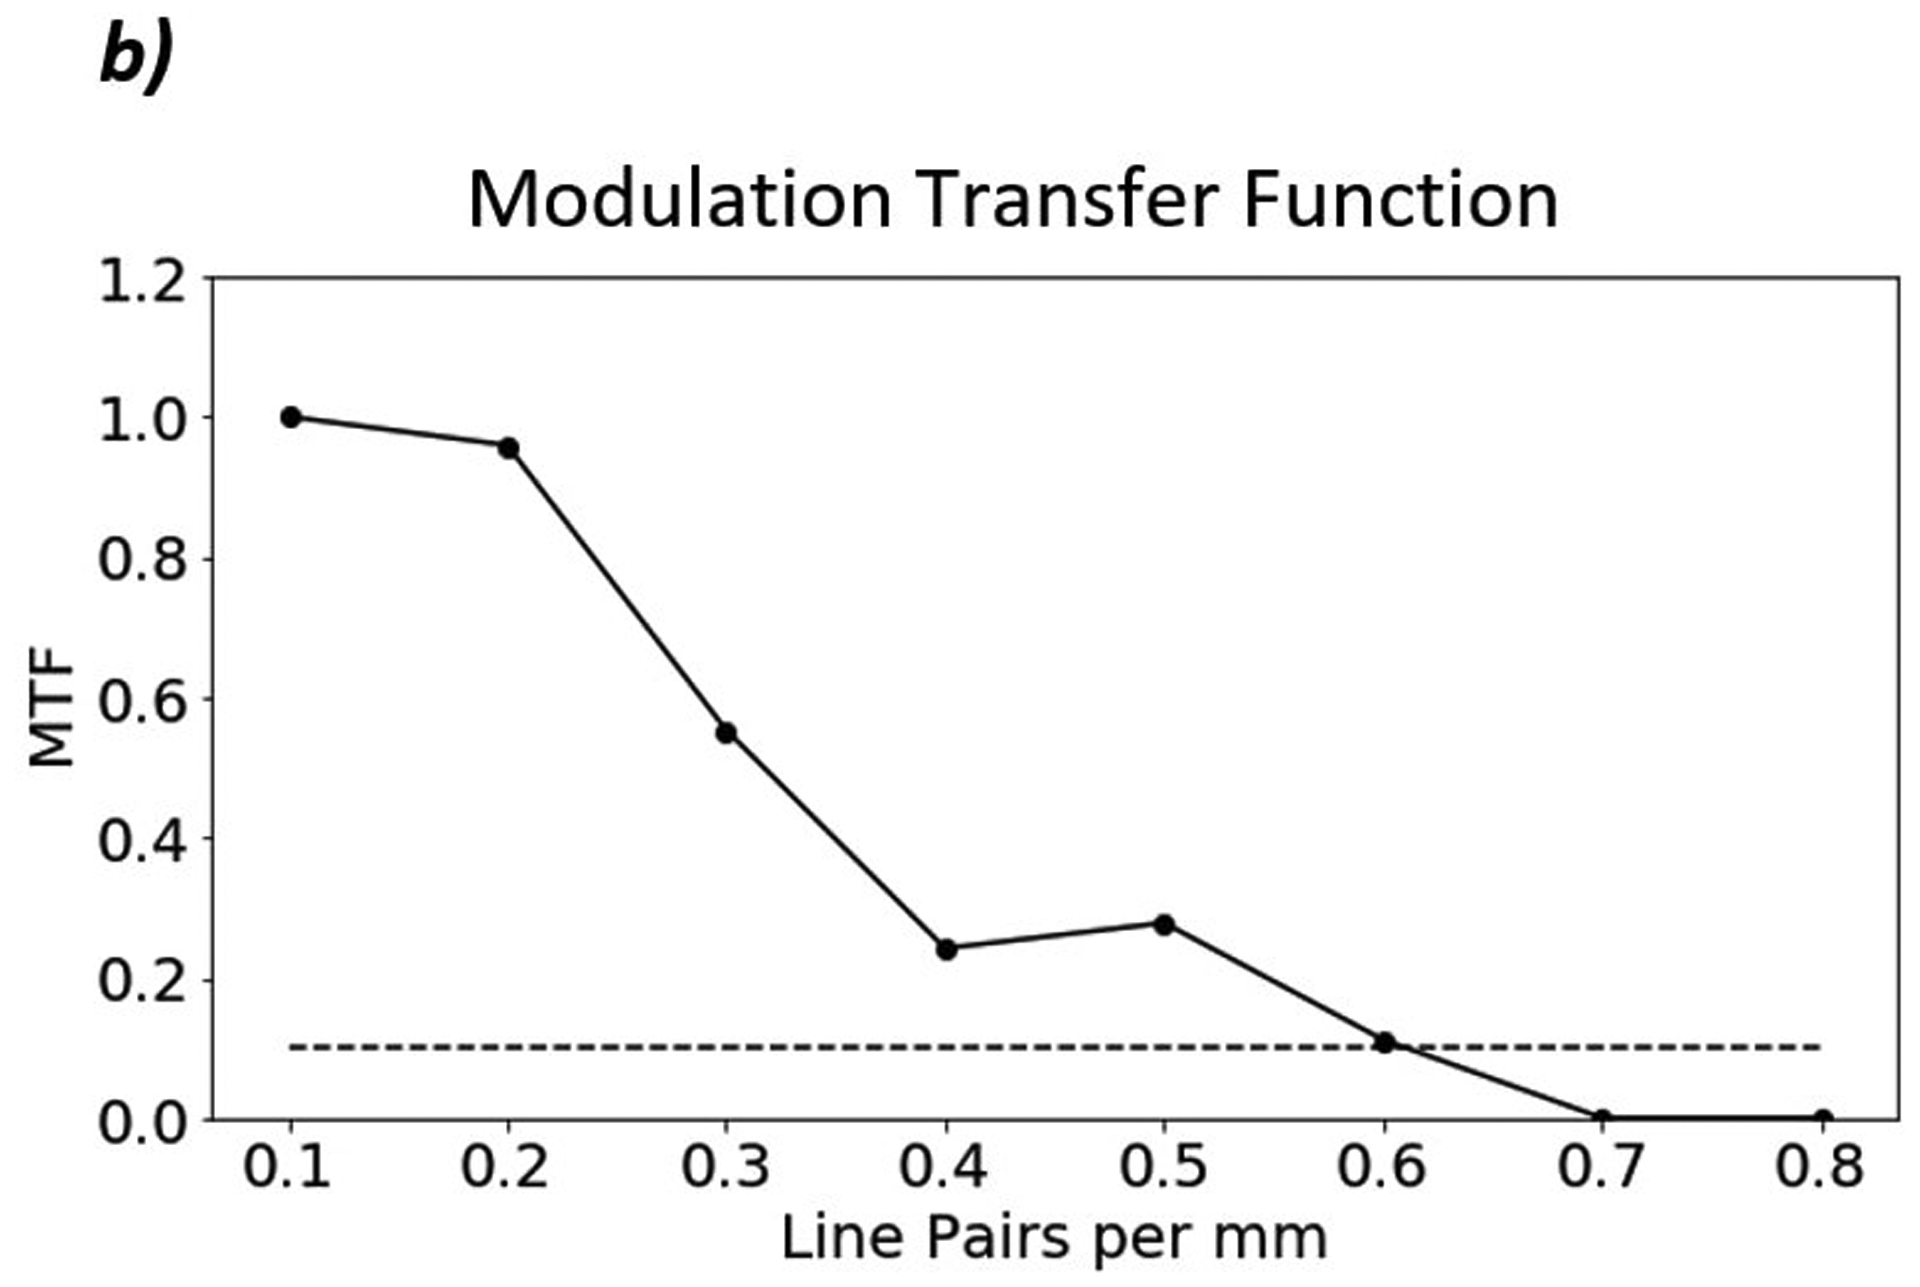
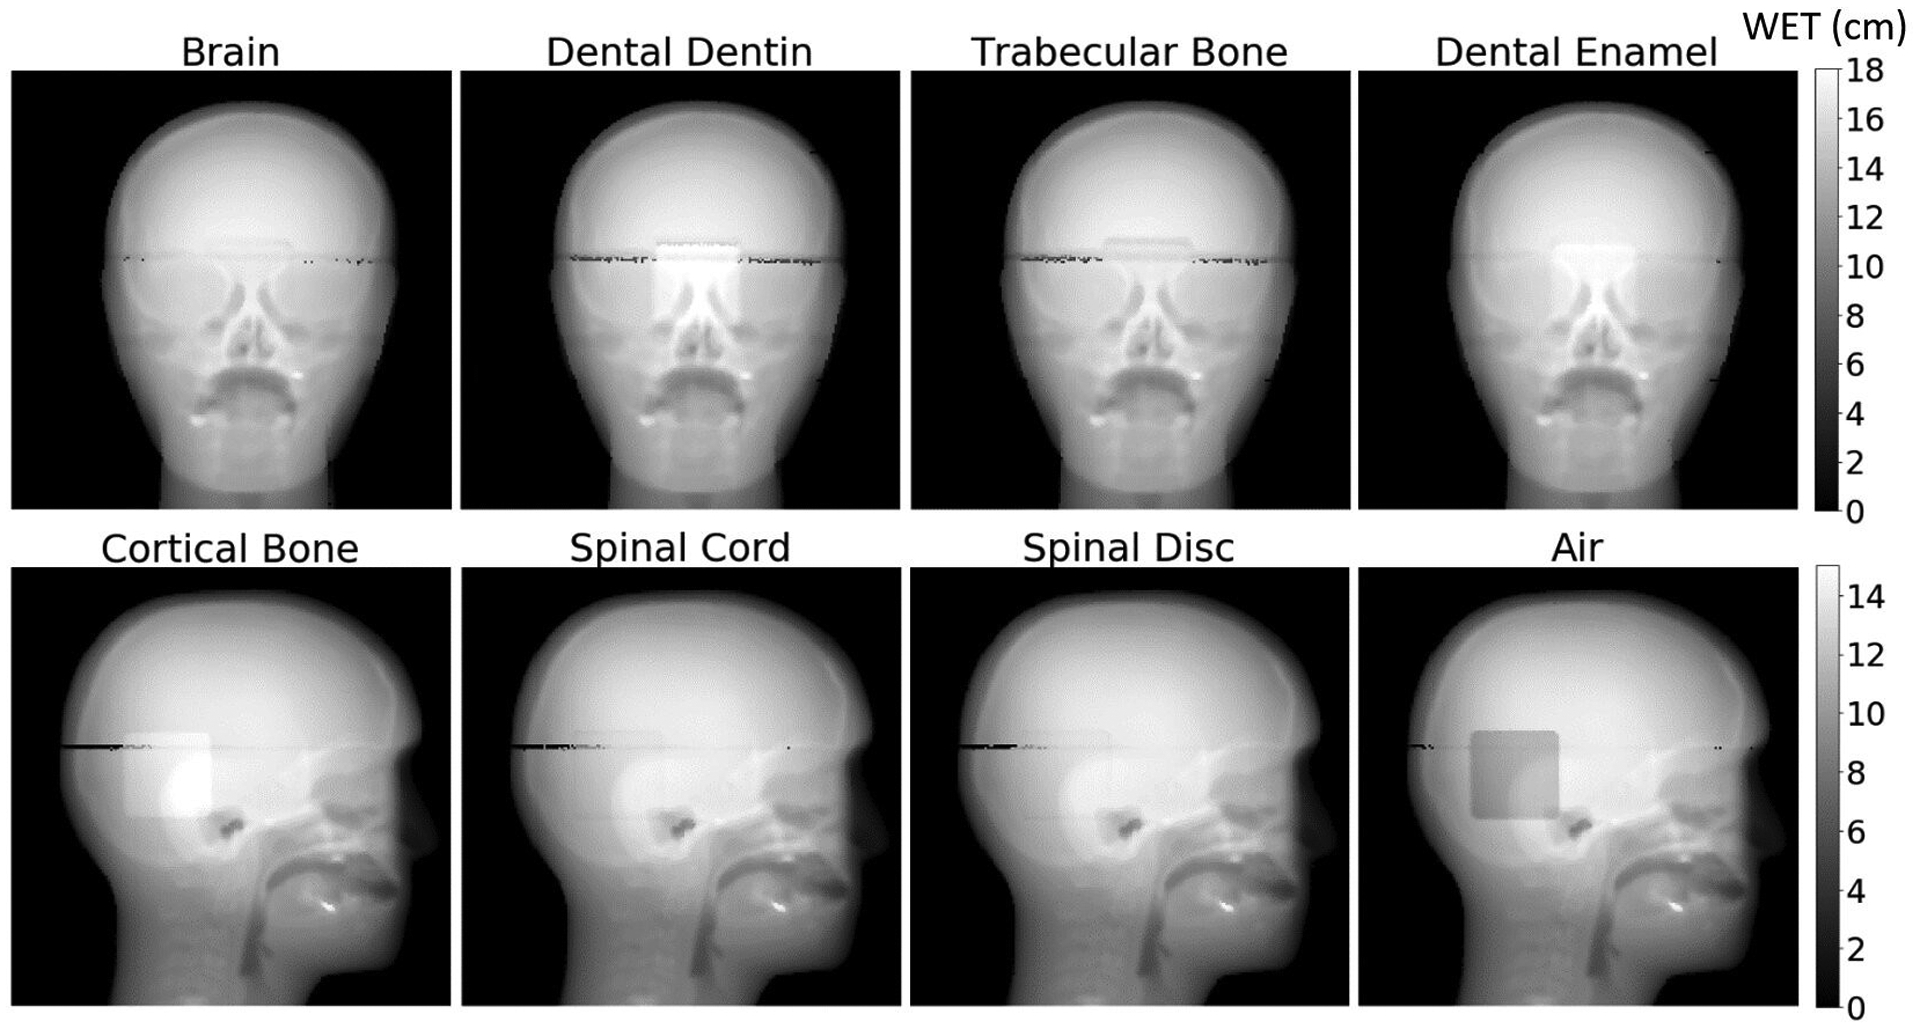
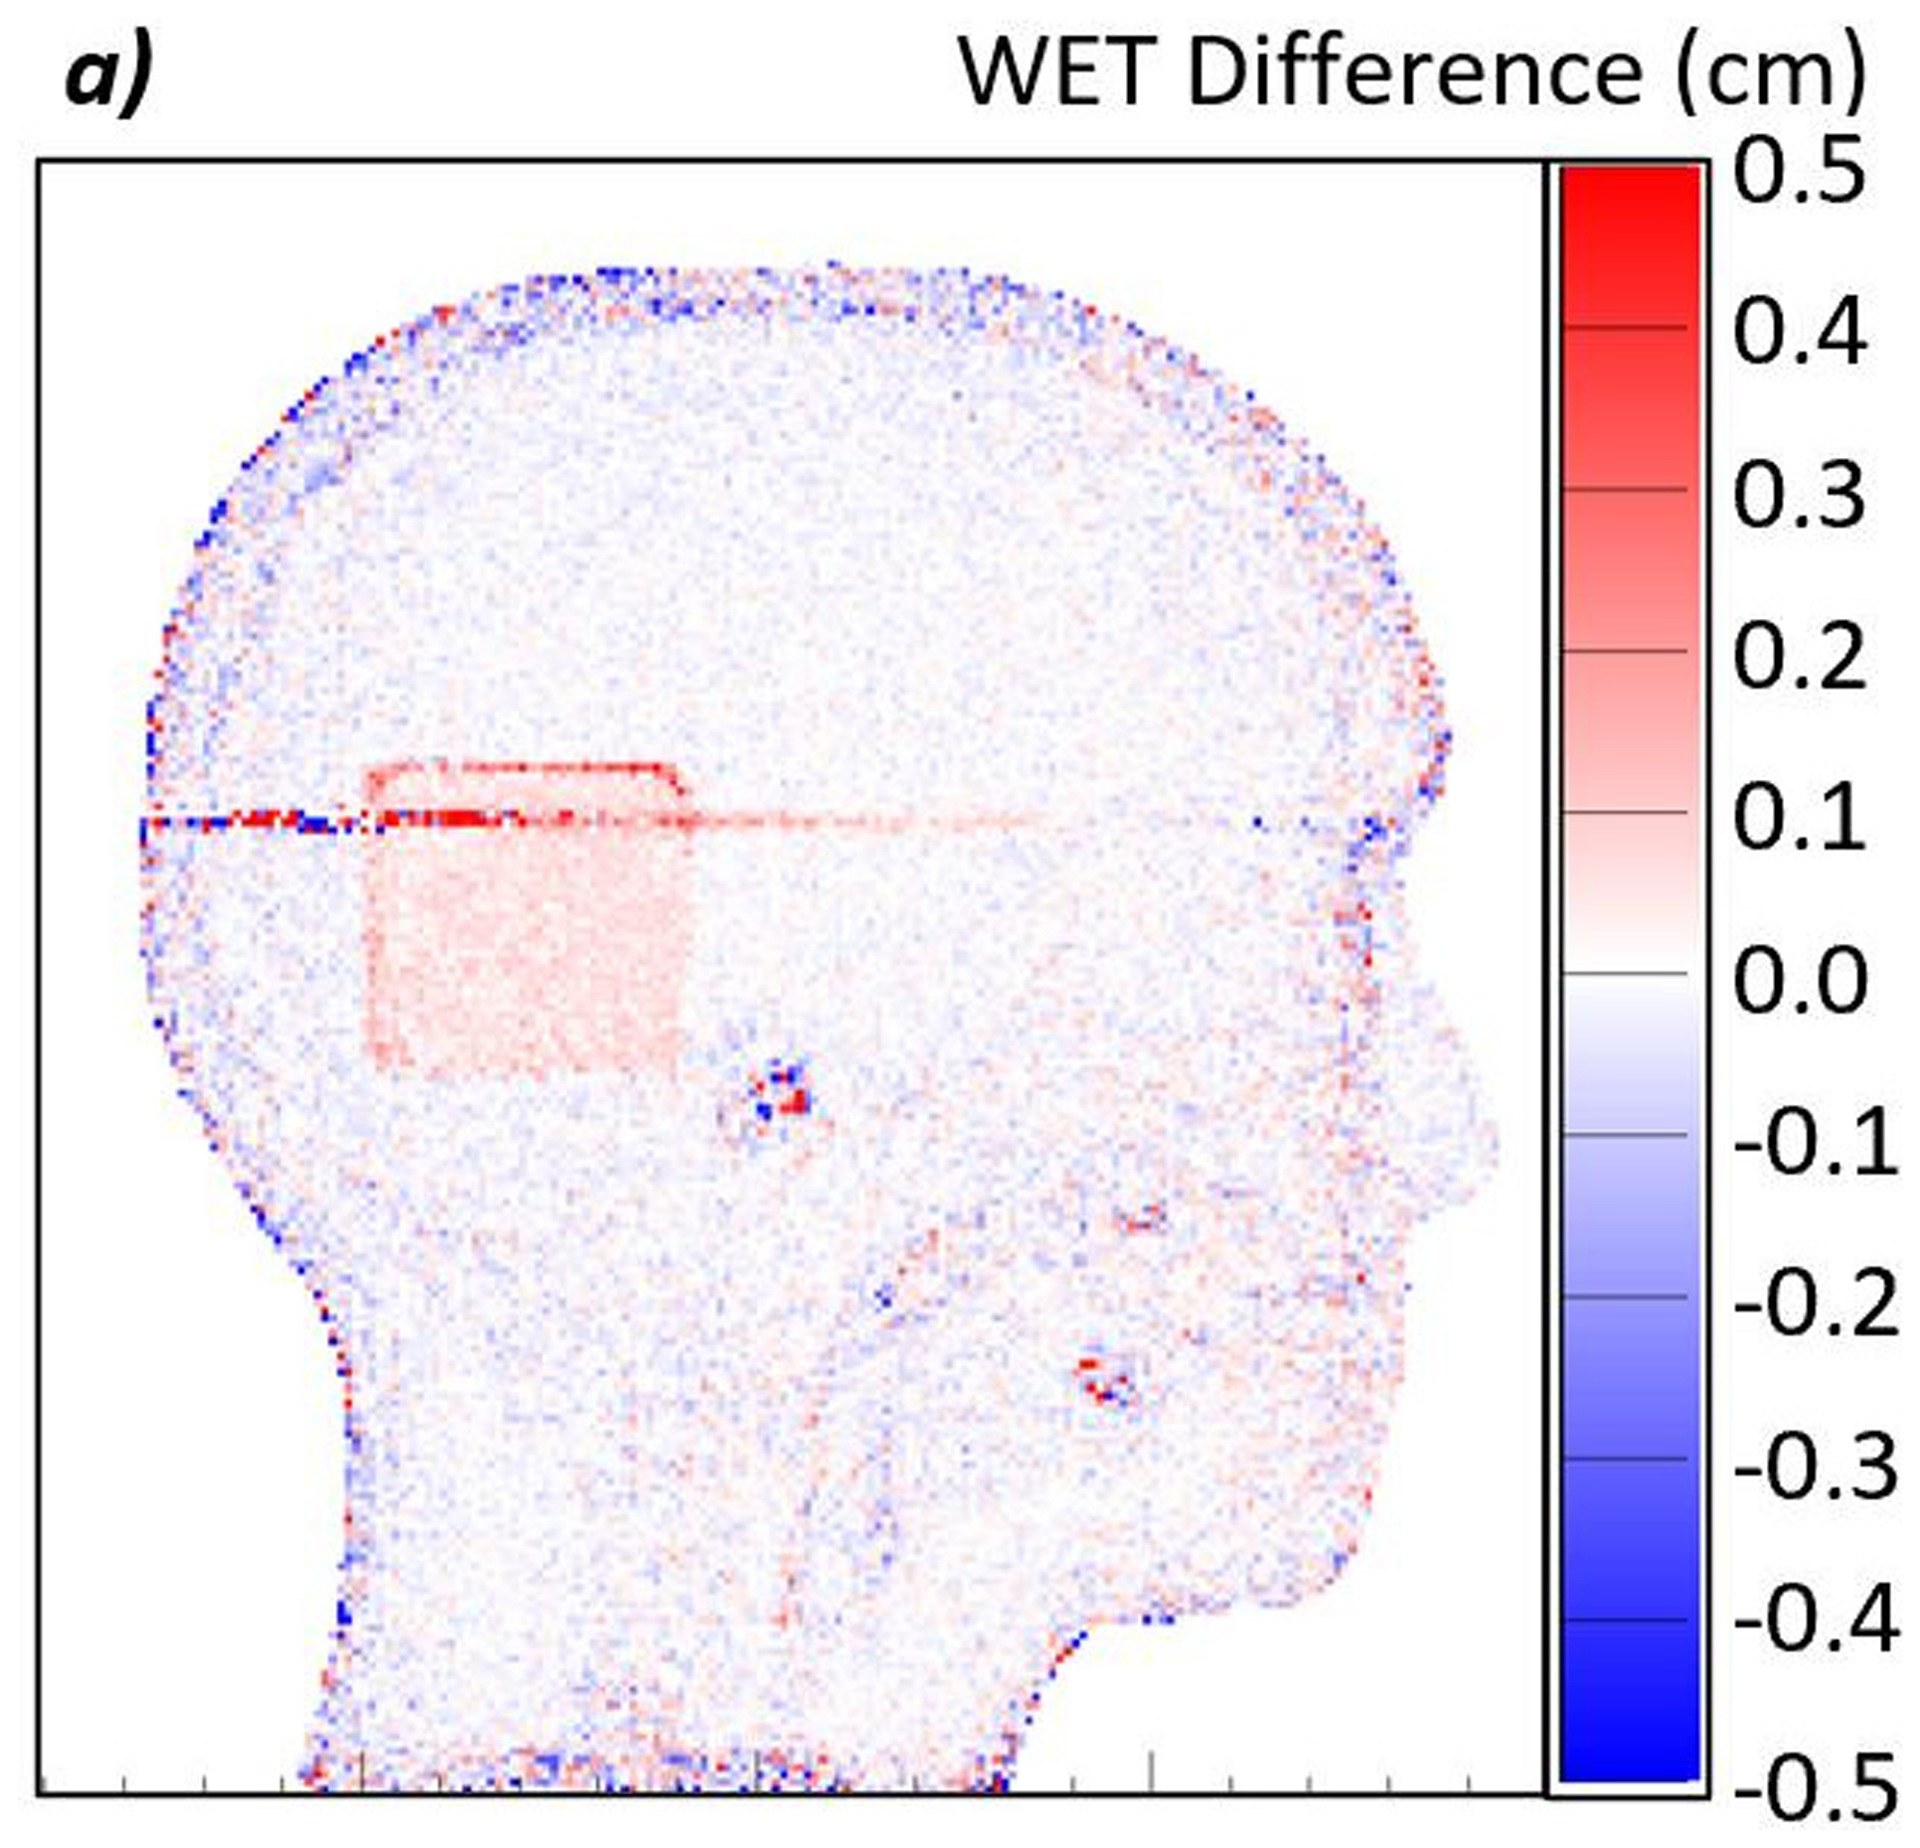
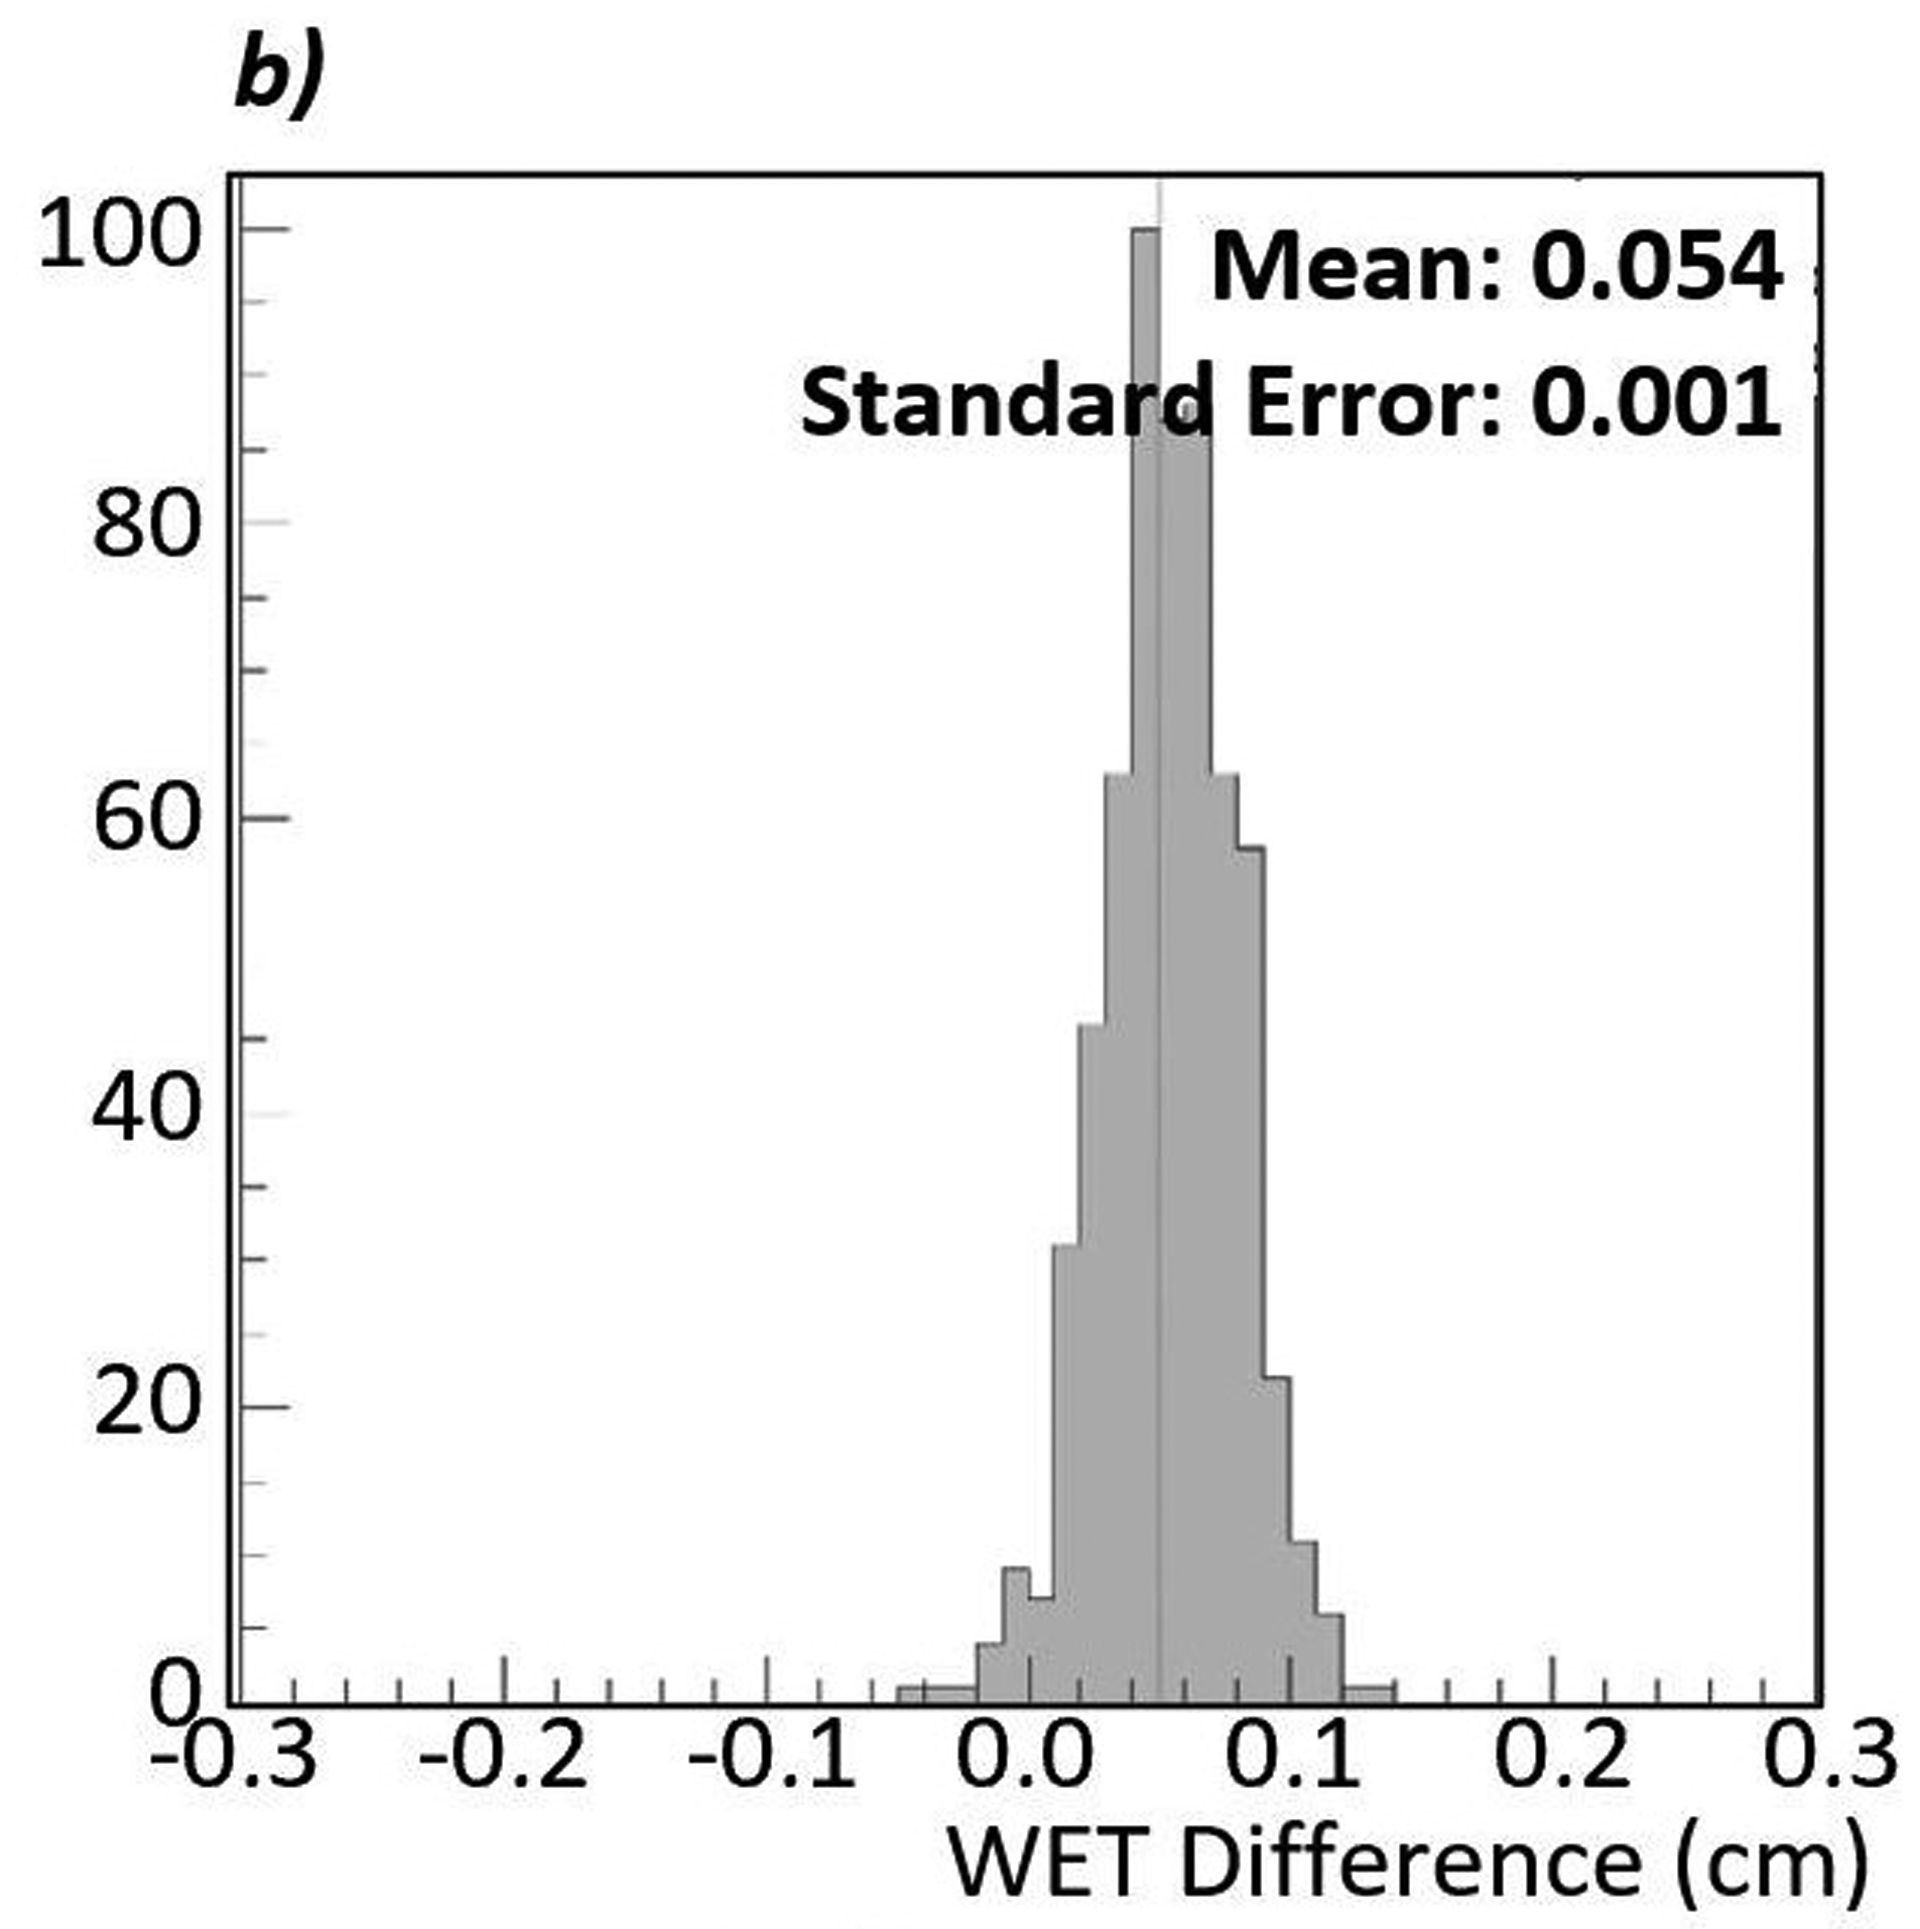
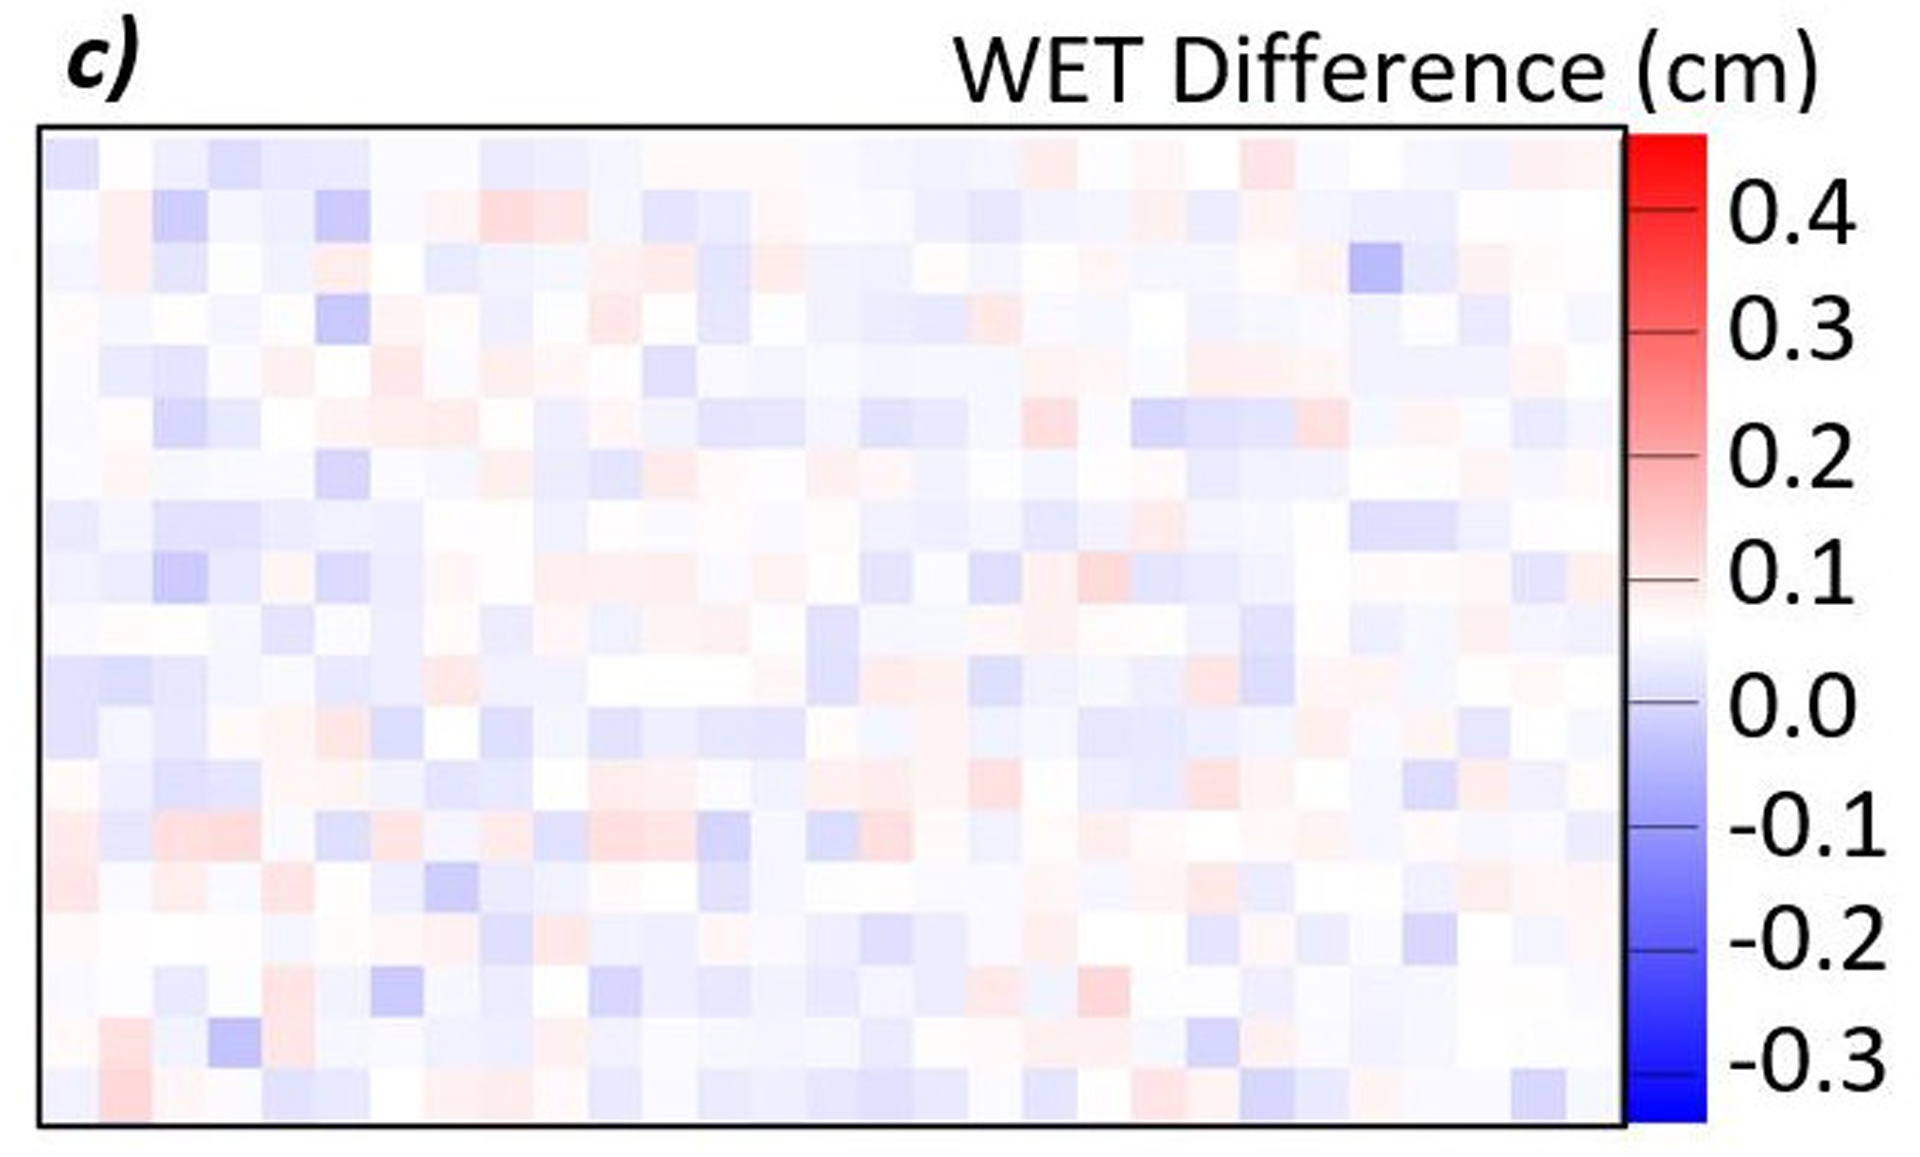
Methods: We have developed a clinical prototype proton radiography system designed for integration into efficient clinical workflows. We tested the images obtained by this system for water-equivalent thickness (WET) accuracy, image noise, and spatial resolution. We evaluated the WET accuracy by comparing the average WET and rms error in several regions of interest (ROI) on a proton radiograph of a custom peg phantom. We measured the spatial resolution on a CATPHAN Line Pair phantom and a custom edge phantom by measuring the 10% value of the modulation transfer function (MTF). In addition, we tested the ability to detect proton range errors due to anatomical changes in a patient with a customized CIRS pediatric head phantom and inserts of varying WET placed in the posterior fossae of the brain. We took proton radiographs of the phantom with each insert in place and created difference maps between the resulting images. Integrated proton range was measured from an ROI in the difference maps.

Results: We measured the WET accuracy of the proton radiographic images to be ±0.2 mm (0.33%) from known values. The spatial resolution of the images was 0.6 lp/mm on the line pair phantom and 1.13 lp/mm on the edge phantom. We were able to detect anatomical changes producing changes in WET as low as 0.6 mm.

Conclusion: The proton radiography system produces images with image quality sufficient for pretreatment range consistency verification.

Keywords: proton imaging; proton radiography; proton range error; proton therapy.


Conflict of interest statement

CONFLICT OF INTEREST STATEMENT

The authors have intellectual property rights to the innovations described in this paper. James S. Welsh has served as a medical advisor to ProTom International. Don F. DeJongh and Victor Rykalin are co-owners of ProtonVDA LLC.

Figures

Figure 1:
Figure 1:
Schematic of proton radiography system and coordinate system.
Figure 2:
Figure 2:
a) Photo of custom phantom used for WET accuracy measurements. The phantom is 4 cm thick with eight inserts of tissue equivalent materials with known WET values ranging from 0.800 cm to 7.02 cm. b) Schematic of the edge phantom designed by Plautz, et al for measuring spatial resolution. The inserts are enamel, cortical bone, lung, and air in a water-equivalent background material. Reprinted with permission from John Wiley and Sons, Inc. c) Schematic of the CATPHAN 528 line pair phantom. The line pairs are aluminum in an epoxy background.
Figure 2:
Figure 2:
a) Photo of custom phantom used for WET accuracy measurements. The phantom is 4 cm thick with eight inserts of tissue equivalent materials with known WET values ranging from 0.800 cm to 7.02 cm. b) Schematic of the edge phantom designed by Plautz, et al for measuring spatial resolution. The inserts are enamel, cortical bone, lung, and air in a water-equivalent background material. Reprinted with permission from John Wiley and Sons, Inc. c) Schematic of the CATPHAN 528 line pair phantom. The line pairs are aluminum in an epoxy background.
Figure 3:
Figure 3:
Photo of the customized pediatric head phantom with tissue-equivalent insert and blue bolus wax spacers used for testing the detection of anatomical changes. In these photos, the insert and spacers are oriented for an AP radiograph. The insert and spacers would be rotated 90 degrees for a lateral radiograph.
Figure 4:
Figure 4:
Proton radiograph of the custom peg phantom shown in Figure 2a. The radiograph was taken with three energies.
Figure 5:
Figure 5:
a) Proton radiograph of the edge phantom. b) The MTF plot of the four most central inserts. The MTF-10% for each of the inserts are shown in the top right corner of the MTF plot.
Figure 5:
Figure 5:
a) Proton radiograph of the edge phantom. b) The MTF plot of the four most central inserts. The MTF-10% for each of the inserts are shown in the top right corner of the MTF plot.
Figure 6:
Figure 6:
a) Proton radiograph of CATPHAN 528 line pair phantom. The grid artifacts visible in the image result from nonuniformities in the tracker plane construction and will be eliminated in subsequent constructions. They are visible here due to the reduced WET scale. b) MTF plot of the line pairs. The MTF-10% of the line pair phantom is 0.6 lp/mm.
Figure 6:
Figure 6:
a) Proton radiograph of CATPHAN 528 line pair phantom. The grid artifacts visible in the image result from nonuniformities in the tracker plane construction and will be eliminated in subsequent constructions. They are visible here due to the reduced WET scale. b) MTF plot of the line pairs. The MTF-10% of the line pair phantom is 0.6 lp/mm.
Figure 7:
Figure 7:
AP and lateral proton radiographs of the customized pediatric head phantom with the various inserts. A higher density insert, such as cortical bone, will have a higher WET and therefore will appear brighter on the radiograph. A lower density insert, such as air, will have a lower WET and therefore appear darker on the radiograph. The dark artifact running across the phantom is the air gap where the superior and inferior portions of the phantom come together.
Figure 8:
Figure 8:
a) Difference map between a proton radiograph of the phantom with the brain insert and a proton radiograph of the phantom with the spinal disc insert. The red color indicates an increase in WET from brain to spinal disc, while blue indicates a decrease. In this case, the spinal disc insert has a higher WET than the brain insert. b) Histogram of the WET difference within the 600-pixel ROI. The mean of the distribution is 0.054 cm with a standard error of 0.001 cm. c) Enlarged view of the ROI. The color is scaled such that pixels where the WET differences, true minus measured, appears white. The even distribution of red and blue indicates that the noise is consistently distributed throughout the large ROI.
Figure 8:
Figure 8:
a) Difference map between a proton radiograph of the phantom with the brain insert and a proton radiograph of the phantom with the spinal disc insert. The red color indicates an increase in WET from brain to spinal disc, while blue indicates a decrease. In this case, the spinal disc insert has a higher WET than the brain insert. b) Histogram of the WET difference within the 600-pixel ROI. The mean of the distribution is 0.054 cm with a standard error of 0.001 cm. c) Enlarged view of the ROI. The color is scaled such that pixels where the WET differences, true minus measured, appears white. The even distribution of red and blue indicates that the noise is consistently distributed throughout the large ROI.

References

    1. Knopf AC, Lomax A. In vivo proton range verification: A review. Phys Med Biol. 2013;58(15):131–160. doi:10.1088/0031-9155/58/15/R131 - DOI - PubMed
    1. Schneider U, Pedroni E. Proton radiography as a tool for quality control in proton therapy. Med Phys. 1995;22(4):353–363. doi:10.1118/1.597470 - DOI - PubMed
    1. Parodi K, Polf JC. In vivo range verification in particle therapy. Med Phys. 2018;45(11):e1036–e1050. doi:10.1002/mp.12960 - DOI - PMC - PubMed
    1. Schreuder AN, Shamblin J. Proton therapy delivery: what is needed in the next ten years? Br J Radiol. 2019;2019(October):20190359. doi:10.1259/bjr.20190359 - DOI - PMC - PubMed
    1. Romero JL, Osborne JH, Brady FP, et al. Patient positioning for proton therapy using a proton range telescope. Nucl Inst Methods Phys Res A. 1995;356(2–3):558–565. doi:10.1016/0168-9002(94)01353-5 - DOI

LinkOut - more resources