. 2021 Apr 1;81(7):1499-1514.e6.
doi: 10.1016/j.molcel.2021.01.039. Epub 2021 Feb 22.

Transient non-specific DNA binding dominates the target search of bacterial DNA-binding proteins

Affiliations

Transient non-specific DNA binding dominates the target search of bacterial DNA-binding proteins

Mathew Stracy et al. Mol Cell. .

Abstract

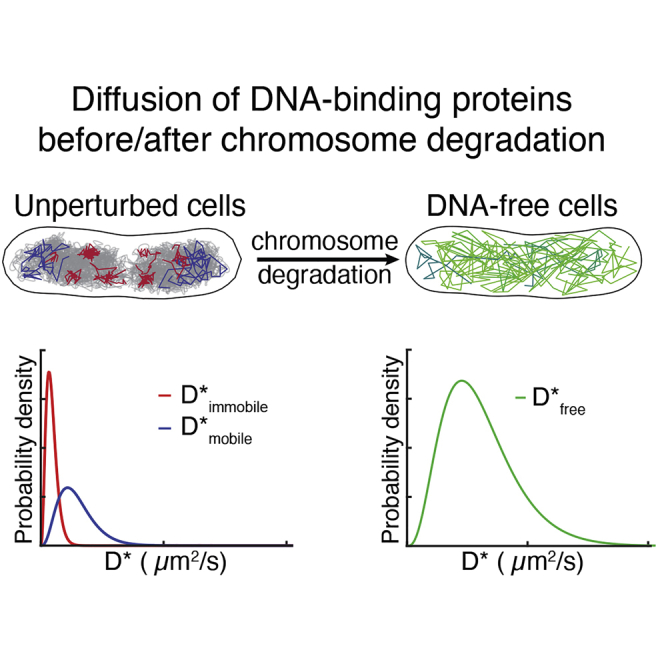
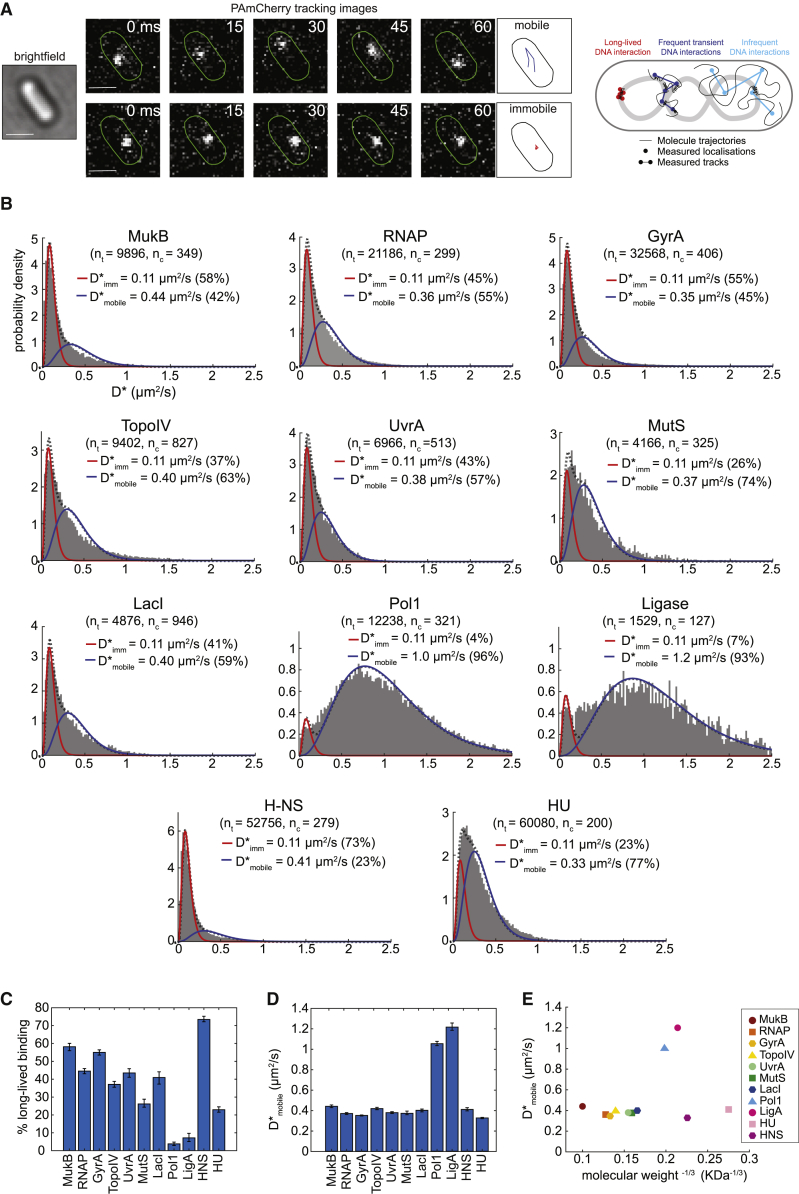
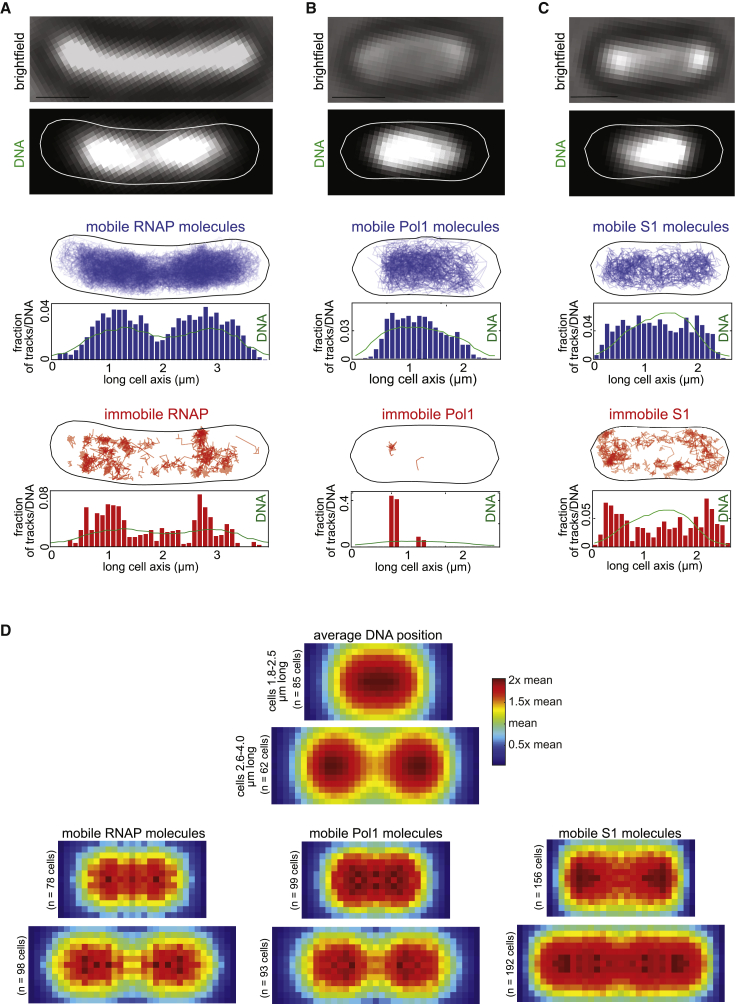
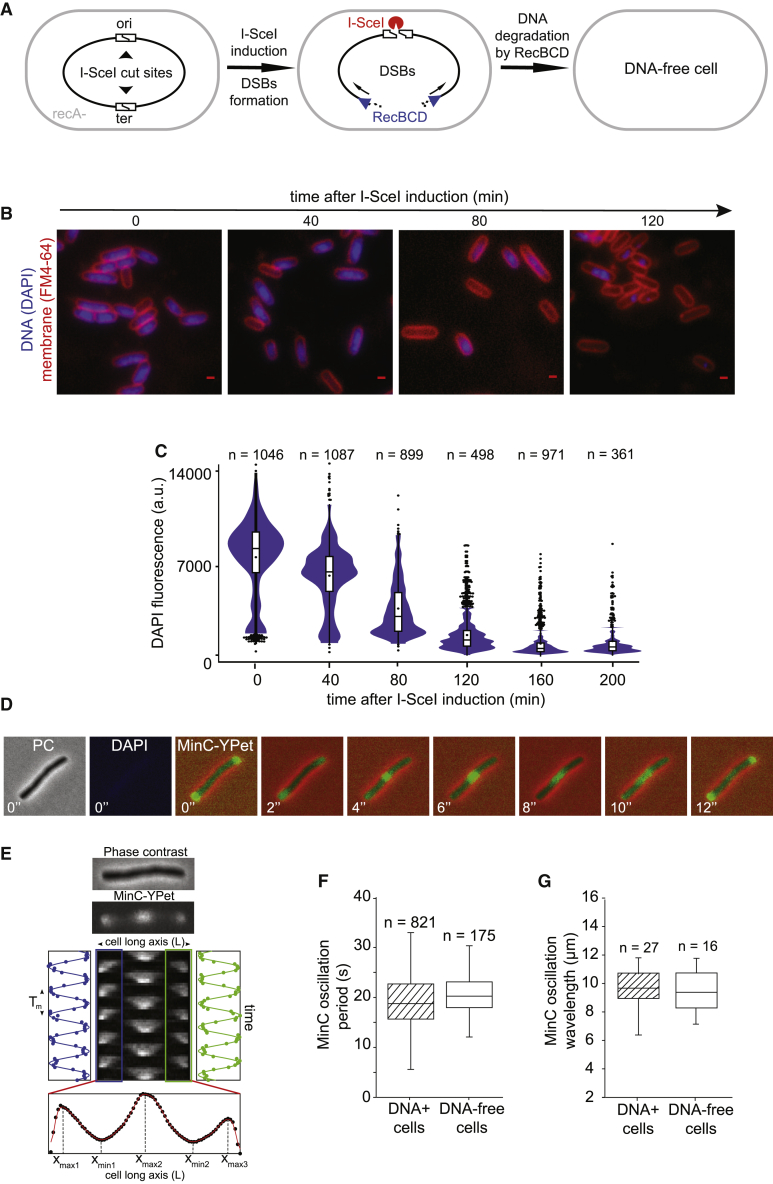
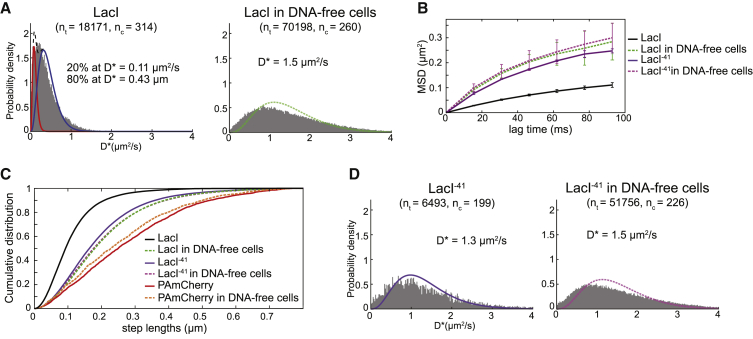
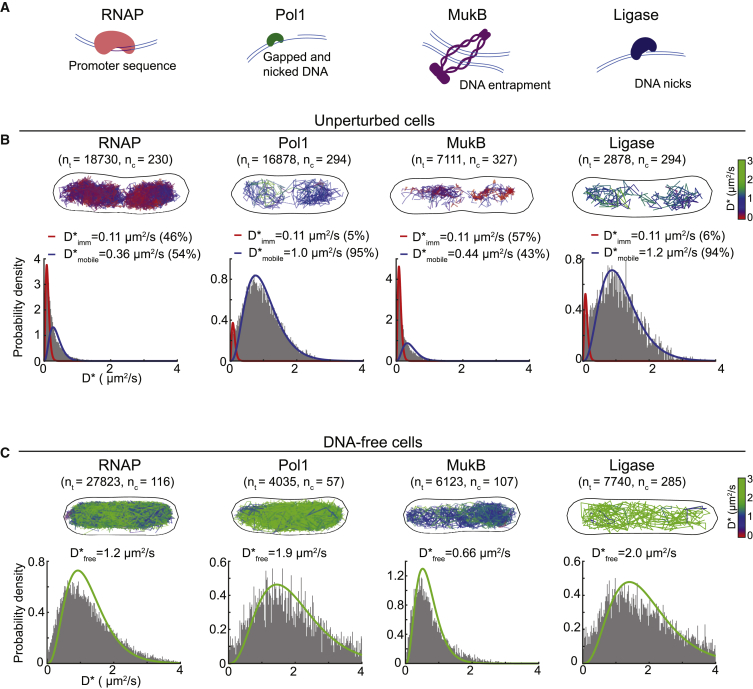
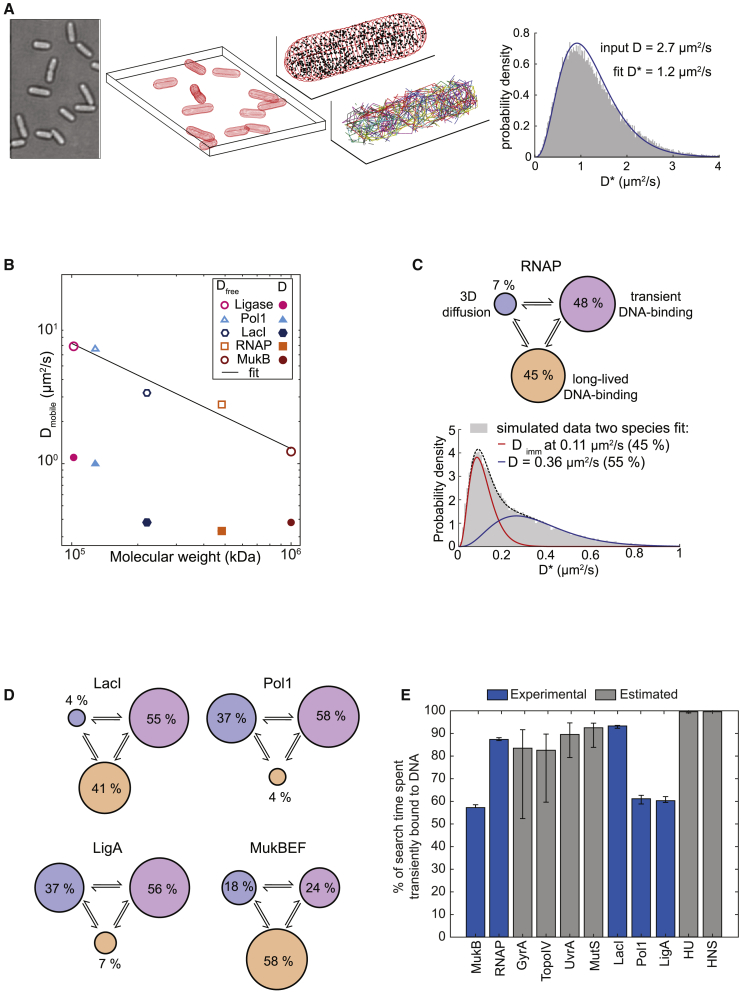
Despite their diverse biochemical characteristics and functions, all DNA-binding proteins share the ability to accurately locate their target sites among the vast excess of non-target DNA. Toward identifying universal mechanisms of the target search, we used single-molecule tracking of 11 diverse DNA-binding proteins in living Escherichia coli. The mobility of these proteins during the target search was dictated by DNA interactions rather than by their molecular weights. By generating cells devoid of all chromosomal DNA, we discovered that the nucleoid is not a physical barrier for protein diffusion but significantly slows the motion of DNA-binding proteins through frequent short-lived DNA interactions. The representative DNA-binding proteins (irrespective of their size, concentration, or function) spend the majority (58%-99%) of their search time bound to DNA and occupy as much as ∼30% of the chromosomal DNA at any time. Chromosome crowding likely has important implications for the function of all DNA-binding proteins.

Keywords: Chromosome-crowding; chromosome-free cells; single-molecule tracking; target search of bacterial DNA-binding proteins.


Conflict of interest statement

Declaration of interests The authors declare no competing interests.

Figures

None
Graphical abstract
Figure 1
Figure 1
Intracellular mobility of diverse types of DNA-binding proteins in live E. coli cells is highly variable and unrelated to their molecular weight (A) Illustration of photoactivated single-molecule tracking, showing example fluorescence images and trajectories of a mobile and an immobile molecule. Scale bar, 1 μm. The measured localizations reflect the average position of a molecule during a frame exposure. Apparent diffusion coefficients (D) report the frequency and duration of DNA interactions by measuring the average displacements over the course of a trajectory. (B) D histograms for diverse DNA-binding proteins, fitted with a two-species model (black dashed line) of a mixture of immobile (red) and mobile molecules (blue). The number of cells (nc) and the numbers of tracks (nt) are indicated. (C) Percentages of immobile molecules obtained from fitting the D histograms in (B) with a two-species model. Error bars represent 95% CI. (D) Dmobile values for the mobile molecule populations. (E) Dmobile plotted against the cubic root of the molecular weight of the protein complex. See also Figure S1.
Figure 2
Figure 2
DNA-binding proteins stay closely associated with the nucleoid during the target search (A–C) Localizations of Pol1 (PolA-PAmCherry), (B) RNAP (RpoC-PAmCherry), and (C) ribosomal protein S1 (S1-PAmCherry) molecules relative to the nucleoid. Left to right: transmitted light image (scale bar, 1 μm), SytoGreen-stained nucleoid DNA with a segmented cell outline, and maps of mobile (blue) and immobile (red) molecule tracks. Histograms show localizations and SytoGreen fluorescence profiles projected onto the long cell axis (green line). (D) Average spatial distributions of Pol1, RNAP, and ribosomal protein S1 immobile and mobile molecules. See also Figure S1.
Figure 3
Figure 3
Generating chromosome-free cells that remain metabolically active (A) Schematic of the chromosome-degradation system. Induction of I-SceI endonuclease causes 2 double-stranded-breaks (DSBs) in I-SceI cut sites at diametrically opposed positions on the chromosome. In a recA strain, processing of DSBs by RecBCD results in complete chromosome degradation. (B) Chromosome degradation after I-SceI induction, revealed by loss of DAPI-stained DNA fluorescence (blue) in cells with an FM464-labeled membrane (red). Scale bar, 1 μm. (C) DAPI fluorescence profiles show complete chromosome degradation 120 min after I-SceI induction (black dot, mean and outliers; horizontal lines, median, first and third quartiles; n, number of cells analyzed). (D) MinC-YPet oscillation in an example chromosome-free cell. Cell filamentation was induced by cephalexin treatment. Transmitted light, DAPI, and MinC-YPet fluorescence images were obtained 120 min after I-SceI induction. Scale bar, 1 μm. (E) Kymograph of MinC-YPet oscillation in an example filamentous cell. Kymograph width corresponds to the long cell axis (L). Time-dependent intensity in the cell halves (blue, green) shows the oscillation period Tm. The time-average profile underneath shows the oscillation wavelength. (F and G) MinC-YPet oscillation period and wavelength are similar with and without chromosome degradation (n, number of cells analyzed, error bars: standard deviation [STD]). See also Figures S2–S5.
Figure 4
Figure 4
Diffusion of the lac repressor increases in chromosome-free cells (A) D histograms of LacI-PAmCherry in unperturbed cells (left) fitted with a two-species model (black dashed line) of a mixture of immobile (red) and mobile molecules (blue) and D distribution of LacI-PAmCherry in chromosome-free cells 120 min after I-SceI induction (right) fitted with a model for mobile molecules (green). (B) Mean-squared displacement plots from data in (A) and (D) ( Error bars: STD). (C) Cumulative distributions of the step lengths between consecutive localizations in unperturbed and chromosome-free cells for LacI-PAmCherry, the LacI41-PAmCherry DNA-binding mutant, and unconjugated PAmCherry. Distributions shift to longer steps with increasing diffusion coefficient. (D) D histograms of LacI41-PAmCherry in unperturbed cells (left, purple) and in chromosome-free cells 120 min after I-SceI induction (right, magenta) fitted with a model for mobile molecules. See also Figure S5.
Figure 5
Figure 5
Chromosome degradation increases the mobility of diverse types of DNA-binding proteins (A) DNA-binding modes of RNAP, Pol1, MukB, and ligase. (B) Tracks of RNAP-PAmCherry, Pol1-PAmCherry, MukB-PAmCherry, and LigA-PAmCherry in example cells, with the color of each track representing its D value. Also shown are D histograms in unperturbed cells, fitted with a two-species model of a mixture of immobile (red) and mobile (blue) molecules. (C) Tracks of RNAP-PAmCherry, Pol1-PAmCherry, MukB-PAmCherry, and LigA-PAmCherry in example chromosome-free cells 120 min after I-SceI induction, with the color of each track representing its D value. D histograms in chromosome-free cells were fitted with a single-species model for mobile molecules.
Figure 6
Figure 6
Quantitative partitioning of protein states (A) Illustration of Brownian motion simulation to estimate the unbiased diffusion coefficients Dmobile (in unperturbed cells) and Dfree (in chromosome-free cells). (B) Dmobile and Dfree plotted versus molecular weight M on a log scale. Linear fit log(Dfree) = α∙log(c∙M). (C and D) Partitioning long-lived DNA-binding (orange), transient DNA-binding (purple), and 3D diffusion (blue) states for RNAP and (D) for LacI, Pol1, LigA, and MukB. (E) The percentage of search time spent bound non-specifically to DNA for all 11 studied DNA-binding proteins. Blue bars show the proteins with Dfree measured in chromosome-free cells, and gray bars show proteins with Dfree estimated from the fit in (B). Error bars: STD. See also Figure S6.

References

    1. Al-Husini N., Tomares D.T., Bitar O., Childers W.S., Schrader J.M. α-Proteobacterial RNA Degradosomes Assemble Liquid-Liquid Phase-Separated RNP Bodies. Mol. Cell. 2018;71:1027–1039.e14. - PMC - PubMed
    1. Bacia K., Kim S.A., Schwille P. Fluorescence cross-correlation spectroscopy in living cells. Nat. Methods. 2006;3:83–89. - PubMed
    1. Badrinarayanan A., Reyes-Lamothe R., Uphoff S., Leake M.C., Sherratt D.J. In vivo architecture and action of bacterial structural maintenance of chromosome proteins. Science. 2012;338:528–531. - PMC - PubMed
    1. Bakshi S., Bratton B.P., Weisshaar J.C. Subdiffraction-limit study of Kaede diffusion and spatial distribution in live Escherichia coli. Biophys. J. 2011;101:2535–2544. - PMC - PubMed
    1. Bakshi S., Dalrymple R.M., Li W., Choi H., Weisshaar J.C. Partitioning of RNA polymerase activity in live Escherichia coli from analysis of single-molecule diffusive trajectories. Biophys. J. 2013;105:2676–2686. - PMC - PubMed

Publication types

MeSH terms