

SARS-CoV-2 superspreading in cities vs the countryside
- PMID: 33622024
- PMCID: PMC8013868
- DOI: 10.1111/apm.13120
SARS-CoV-2 superspreading in cities vs the countryside
Abstract
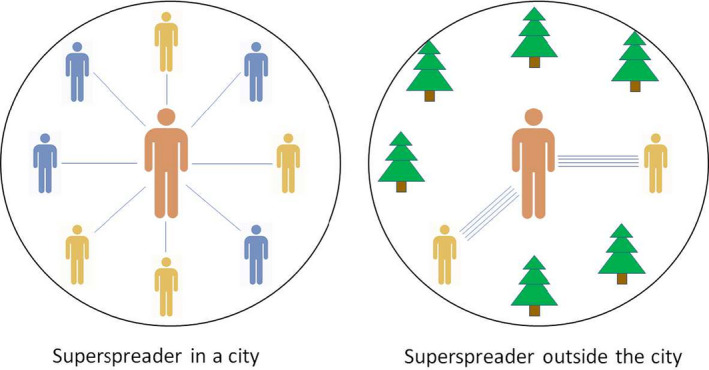
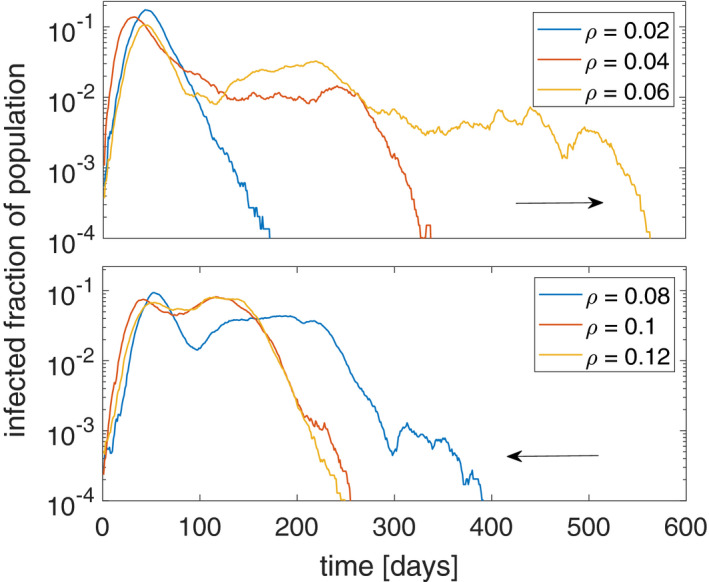
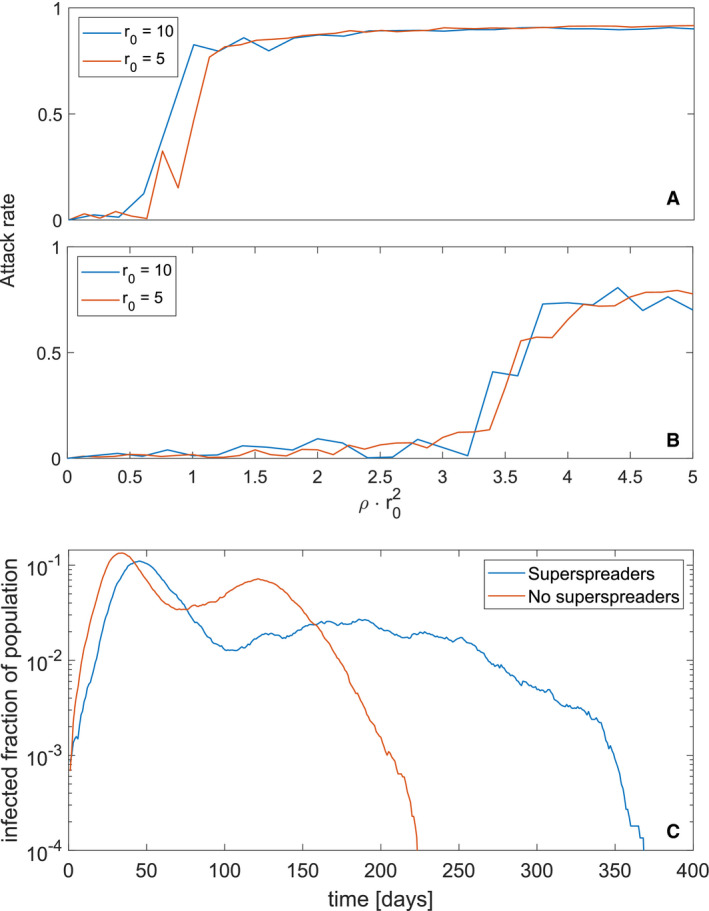
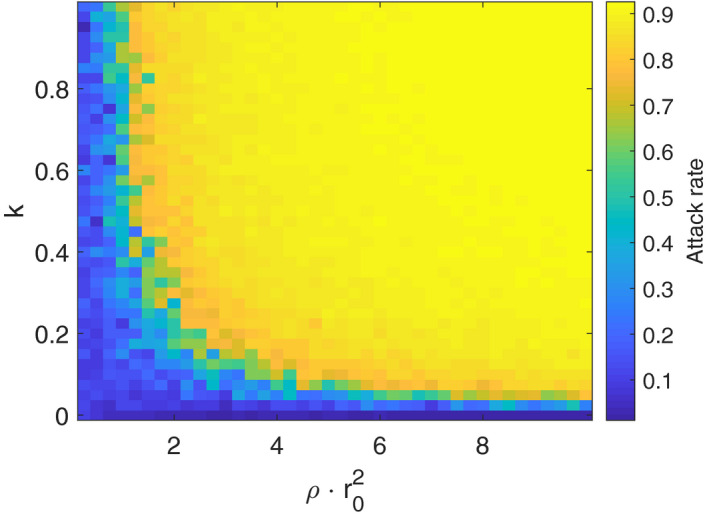
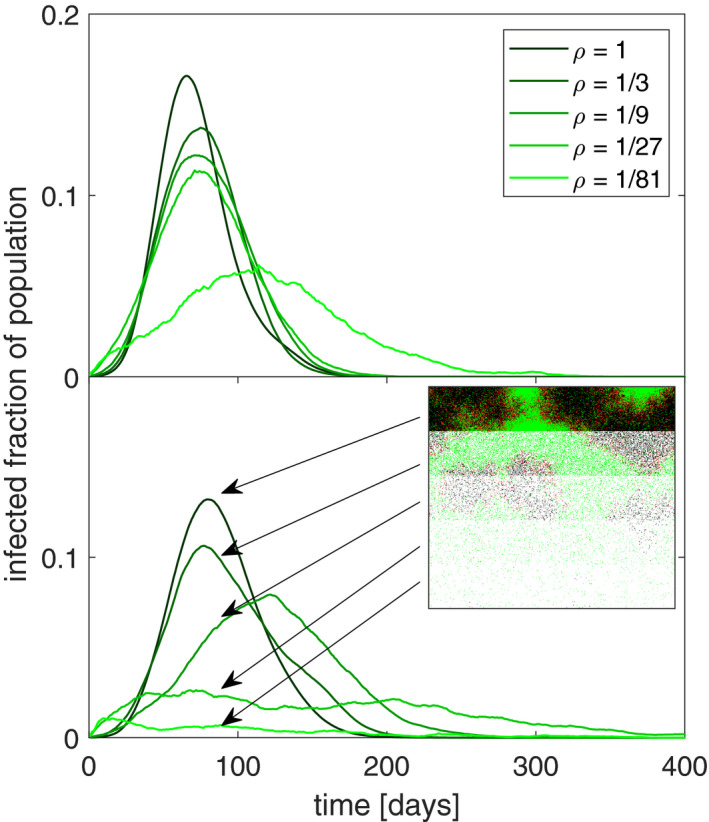
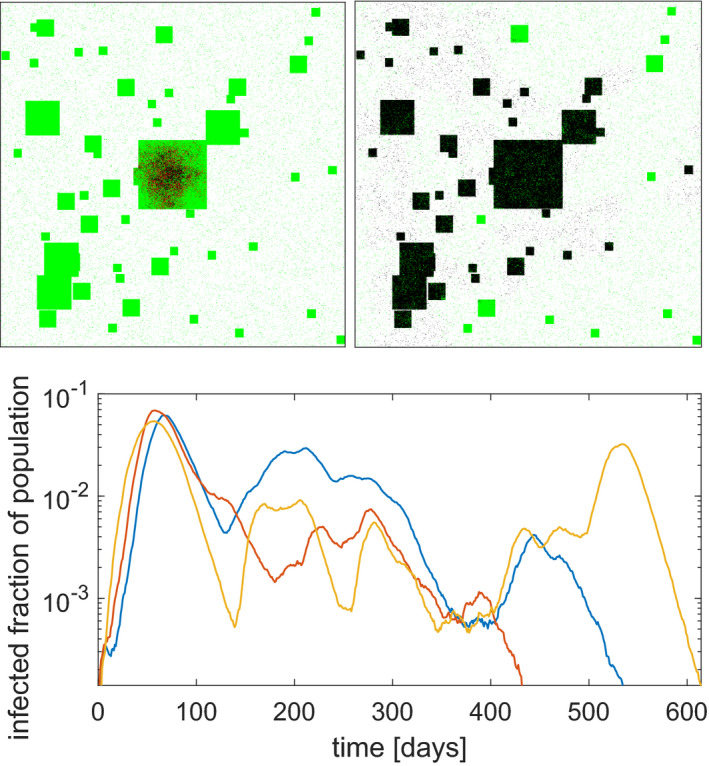
The first wave of the COVID-19 pandemic was characterized by an initial rapid rise in new cases followed by a peak and a more erratic behaviour that varies between regions. This is not easy to reproduce with traditional SIR models, which predict a more symmetric epidemic. Here, we argue that superspreaders and population heterogeneity would predict such behaviour even in the absence of restrictions on social life. We present an agent-based lattice model of a disease spreading in a heterogeneous population. We predict that an epidemic driven by superspreaders will spread rapidly in cities, but not in the countryside where the sparse population limits the maximal number of secondary infections. This suggests that mitigation strategies should include restrictions on venues where people meet a large number of strangers. Furthermore, mitigating the epidemic in cities and in the countryside may require different levels of restrictions.
Keywords: COVID-19; epidemiology; model; population density; superspreading.
© 2021 APMIS. Published by John Wiley & Sons Ltd.
Conflict of interest statement
The authors declare no conflicting interests.
Figures
Similar articles
-
Impact of urban structure on infectious disease spreading.Sci Rep. 2022 Mar 9;12(1):3816. doi: 10.1038/s41598-022-06720-8. Sci Rep. 2022. PMID: 35264587 Free PMC article.
-
Different forms of superspreading lead to different outcomes: Heterogeneity in infectiousness and contact behavior relevant for the case of SARS-CoV-2.PLoS Comput Biol. 2022 Aug 22;18(8):e1009980. doi: 10.1371/journal.pcbi.1009980. eCollection 2022 Aug. PLoS Comput Biol. 2022. PMID: 35994497 Free PMC article.
-
Lifting mobility restrictions and the effect of superspreading events on the short-term dynamics of COVID-19.Math Biosci Eng. 2020 Sep 18;17(5):6240-6258. doi: 10.3934/mbe.2020330. Math Biosci Eng. 2020. PMID: 33120597
-
Impact of mobility restriction in COVID-19 superspreading events using agent-based model.PLoS One. 2021 Mar 18;16(3):e0248708. doi: 10.1371/journal.pone.0248708. eCollection 2021. PLoS One. 2021. PMID: 33735290 Free PMC article.
-
The impact of super-spreader cities, highways, and intensive care availability in the early stages of the COVID-19 epidemic in Brazil.Sci Rep. 2021 Jun 21;11(1):13001. doi: 10.1038/s41598-021-92263-3. Sci Rep. 2021. PMID: 34155241 Free PMC article.
Cited by
-
Heterogeneity in testing for infectious diseases.R Soc Open Sci. 2022 May 18;9(5):220129. doi: 10.1098/rsos.220129. eCollection 2022 May. R Soc Open Sci. 2022. PMID: 35600424 Free PMC article.
-
COVID-19 in Saudi Arabia: An Overview.Front Public Health. 2022 Feb 2;9:736942. doi: 10.3389/fpubh.2021.736942. eCollection 2021. Front Public Health. 2022. PMID: 35186861 Free PMC article. Review.
-
Phylodynamic analysis of SARS-CoV-2 spread in Rio de Janeiro, Brazil, highlights how metropolitan areas act as dispersal hubs for new variants.Microb Genom. 2022 Sep;8(9):mgen000859. doi: 10.1099/mgen.0.000859. Microb Genom. 2022. PMID: 36106981 Free PMC article.
-
Prediction of Mental Health in Medical Workers During COVID-19 Based on Machine Learning.Front Public Health. 2021 Sep 7;9:697850. doi: 10.3389/fpubh.2021.697850. eCollection 2021. Front Public Health. 2021. PMID: 34557468 Free PMC article.
-
COVID-19 infections, recoveries, and mortality: an ANOVA model of locations and administrative areas in Saudi Arabia.Front Public Health. 2024 Jan 17;12:1281289. doi: 10.3389/fpubh.2024.1281289. eCollection 2024. Front Public Health. 2024. PMID: 38299074 Free PMC article. Review.
References
MeSH terms
Grants and funding
LinkOut - more resources
Full Text Sources
Other Literature Sources
Medical
Miscellaneous
