

doi: 10.1161/CIRCRESAHA.120.318688.
Epub 2021 Feb 24.
CARMN Loss Regulates Smooth Muscle Cells and Accelerates Atherosclerosis in Mice
Affiliations
- PMID: 33622045
- PMCID: PMC7610708
- DOI: 10.1161/CIRCRESAHA.120.318688
Item in Clipboard
CARMN Loss Regulates Smooth Muscle Cells and Accelerates Atherosclerosis in Mice
Circ Res.
.
Abstract
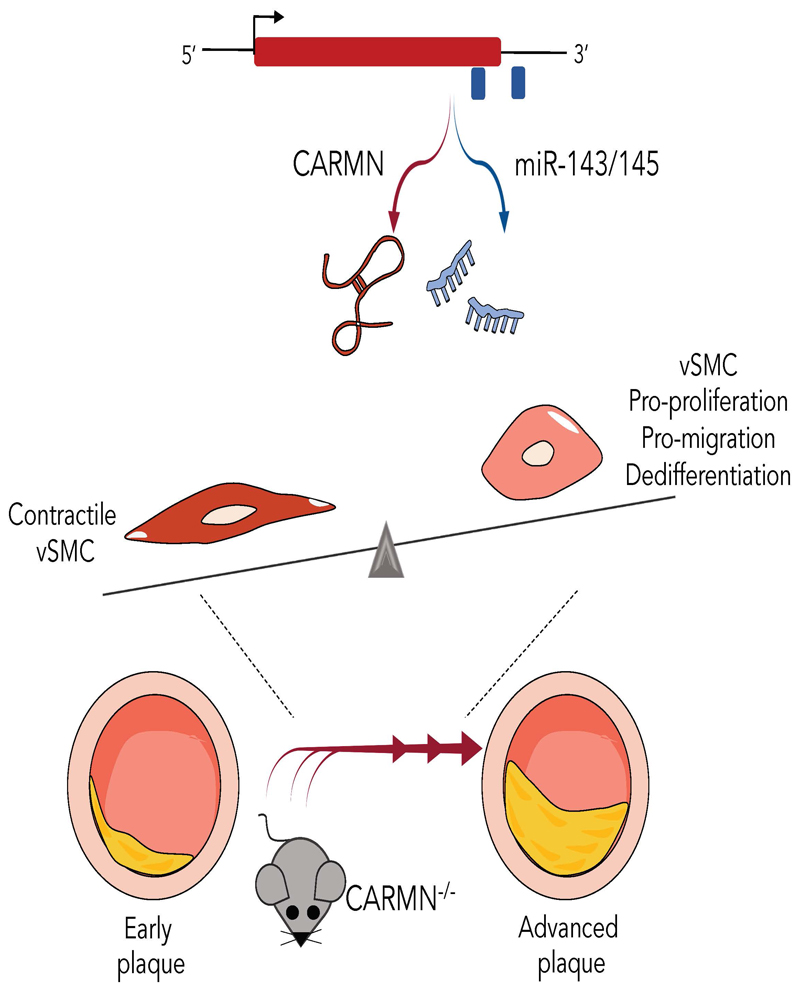
[Figure: see text].
Keywords: atherosclerosis; cell proliferation; cholesterol; inflammation; phenotype.
Figures
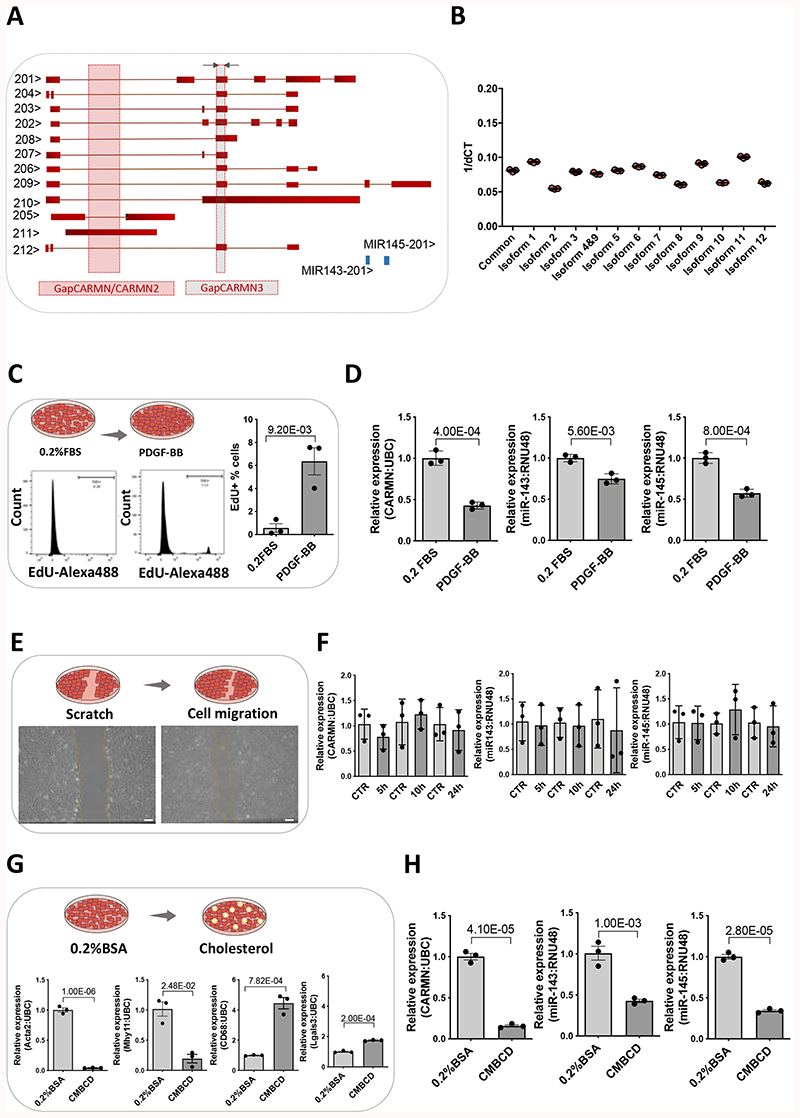
A) Schematic representation of human CARMN splice variants and pre-miRNAs miR-143 and miR-145 based on ENSEMBL version (GRCh38/hg38), including the position of the forward (Fw) and reverse (Rev) primers used to amplify all transcripts, grey arrows (except 4, 10 and 11) and the target region for the GapmeRs, GapCARMN, GapCARMN2 and GapCARMN3. The black arrows next to each transcript name, indicate the direction of transcription. B) Expression levels of CARMN transcripts in hCASMCs (n=3) via qRT-PCR using isoform-specific primers (Isoform 1,2,3,4+9,5,6,7,8,9,10,11, and 12) and common primers (amplifying all isoforms except 4, 10 and 11). C) Diagram of hCASMCs in basal condition (0.2% FBS) and treated for 48 hours with PDGF-BB. Histogram plots obtained by FACS showing the percentage of hCASMCs (n=3) up-tacking EdU following PDGF-BB treatment and in basal (0.2% FBS) conditions. Student’s t-test was used to assess statistical significance indicated with p values. D) QRT-PCR to show expression of CARMN, miR-143 and miR-145 in hCASMCs (n=3) treated with PDGF-BB. Student’s t-test was used to assess statistical significance indicated with p values. E) Diagram of the wound healing assay performed in hCASMCs (n=3), representative micrographs of hCASMCs scratch assay and migrating cells (Scale bar 100μm) and qRT-PCR showing the expression of CARMN and miR-143/145 G) Diagram of hCASMCs (n=3) in basal condition (0.2% BSA) and treated with cholesterol-methyl-b-cyclodextrin treated for 72 hours and expression levels of dedifferentiation markers (ACTA2, MYH11, CD68 and Lgals3), CARMN and miR-143/145 by RT-qPCR. Student’s t-test was used to assess statistical significance indicated with p values. H) qRT-PCR data showing the expression of CARMN and miR-143/145 in basal (0.2% FBS) and following CMBCD-loading treatment. Student’s t-test was used to assess statistical significance indicated with p values.
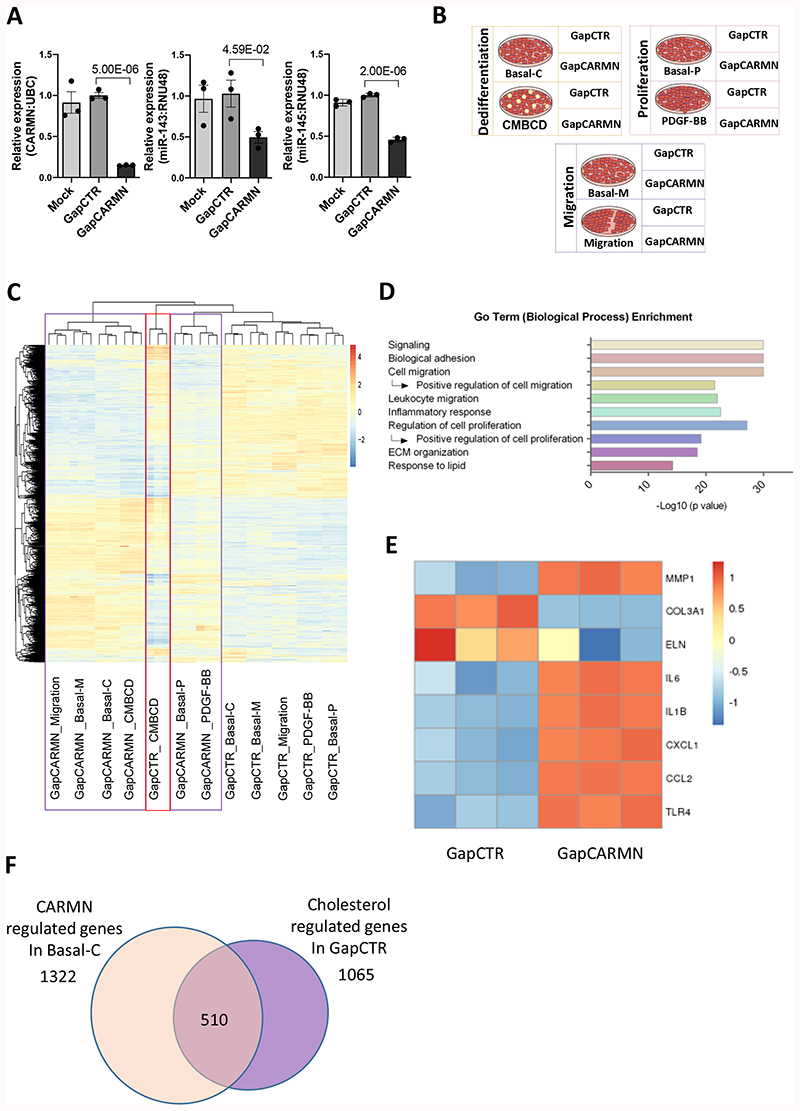
A) QRT-PCR results showing the expression of CARMN, miR-143 and miR145 hCASMCs (n=3) following transfection with GapmeR targeting CARMN (GapCARMN) and GapmeR control (GapCTR). Mock indicates un-transfected cells. One-way ANOVA with Bonferroni multiple comparison test was used to assess statistical significance indicated with p values. B) Schematic representation of the RNA-seq study design. C) Heatmap (as z-score of log2(FPKM+1)) of differentially regulated genes by CARMN depletion in all conditions. The purple box highlights the clustering of all CARMN-knock down samples while the red box shows the CMBCD treated replicates (Cont_KD). D) Graph of selected Go Term (Biological Process). The analysis was performed on the 2315 genes regulated by CARMN depletion in any conditions. E) Heatmap (as z-score of log2(FPKM+1)) of selected differentially regulated genes by GapCARMN and GapCTR in the basal condition with the shortest time of GapmeR transfection (migration). F) Venn diagram showing the overlap between genes regulated by CARMN depletion (in Basal-C condition) and genes regulated by CMBCD treatment (in GapCTR condition) in the same direction.
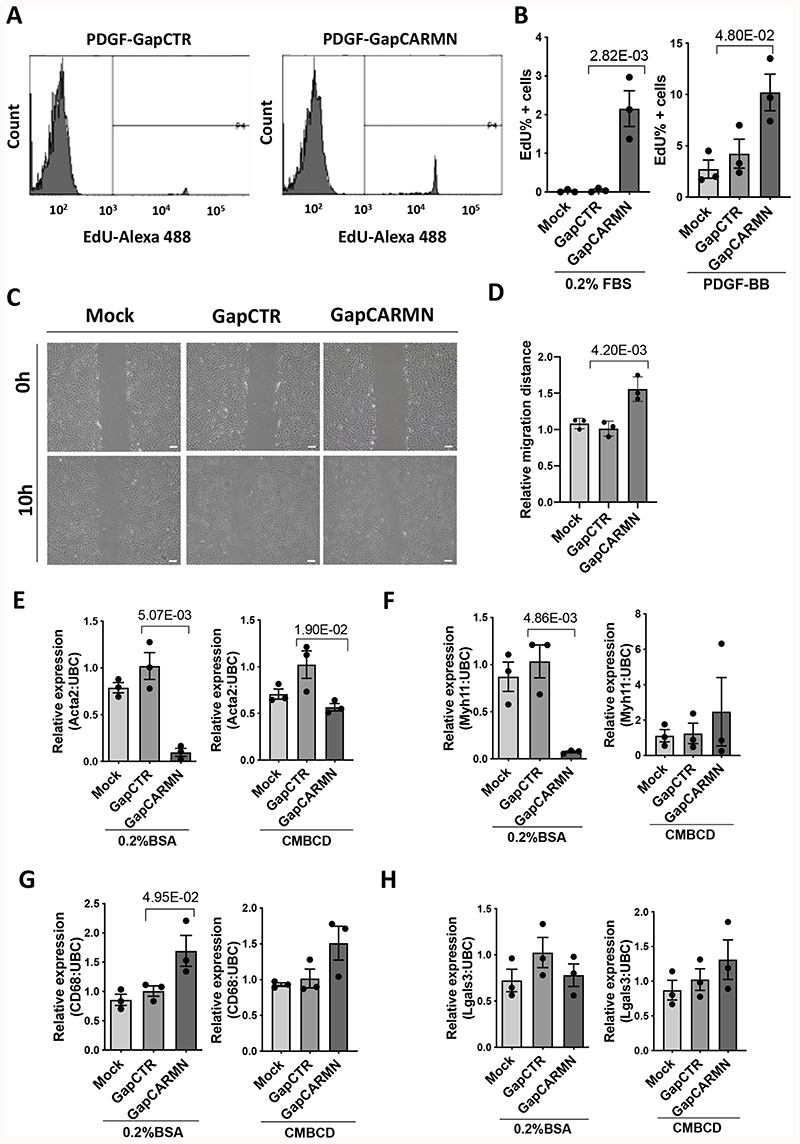
A) Representative FACS plots showing the of EdU uptake in hCASMCs transfected with GapmeR targeting CARMN (GapCARMN) or GapmeR control (GapCTR). The gate (P4) indicates the EdU positive cells, the samples are named GapmeR negative control (GapCTR) and GapmeR targeting CARMN (GapCARMN). B) Percentage of EdU positive hCASMCs (n=3) following transfection with GapCARMN, GapCTR and un-transfected cells (Mock) upon PDGF-BB stimuli and in 0.2% FBS. Oneway ANOVA with Bonferroni multiple comparison test was used to assess statistical significance indicated with p values. C) Representative pictures of hCASMCs at 0 and 10 hours from the scratch following transfection with GapCARMN, GapCTR and Mock in 0.2% FBS medium. Pictures were acquired at 10X magnification. Scale bar 100μm. D) Quantification of the relative migration distances of hCASMCs (n=3), obtained using ImageJ tool. One-way ANOVA with Bonferroni multiple comparison test was used to assess statistical significance indicated with p values. E), F), G), H) Expression levels of dedifferentiation markers Acta2, Myh11, CD68 and Lgals3 in hCASMCs (n=3) stimulated with water-soluble cholesterol-methyl-b-cyclodextrin (CMBCD) or 0.2% BSA for 72 hours following transfection with GapCARMN, GapCTR or Mock. One-way ANOVA with Bonferroni multiple comparison test was used to assess statistical significance indicated with p values.
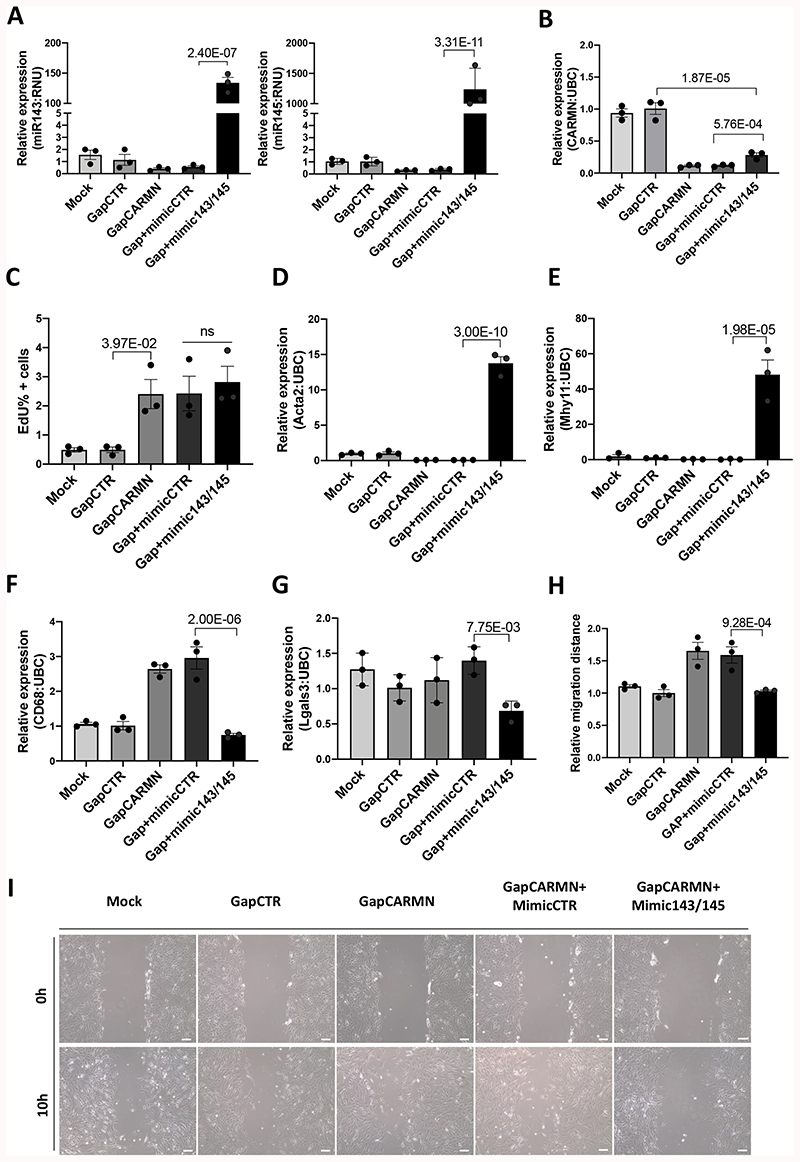
A), B) QRT-PCR expression data of miR-143, miR-145 and CARMN relative to housekeeper gene (RNU and UBC respectively) in GapCARMN, control (GapCTR), a combination of GapCARMN and mimic control (Gap+mimicCTR) and a combination of GapCARMN and mimic overexpressing miR143 and miR145 (GapCARMN+mimic143/145). Mock refers to un-transfected control cells. One-way ANOVA with Bonferroni multiple comparison test was used to assess statistical significance indicated with p values. C) Percentage of EdU positive hCASMCs (n=3) evaluated by FACS analysis and analyzed using FlowJo software. One-way ANOVA with Bonferroni multiple comparison test was used to assess statistical significance indicated with p values. D), E), F), G) qRT-PCR expression data relative to Acta2, Myh11, CD68 and Lgals3, respectively relative to housekeeper gene UBC in the above-mentioned transfection conditions. One-way ANOVA with Bonferroni multiple comparison test was used to assess statistical significance indicated with p values. H), I) Quantification of the relative migration distances of hCASMCs (n=3), obtained using ImageJ tool and representative images of hCASMCs at 0 and 10 hours from the induction of the scratch. Images acquired at 10X magnification, scale bar 100μm. One-way ANOVA with Bonferroni multiple comparison test was used to assess statistical significance indicated with p values. ns= not significant.
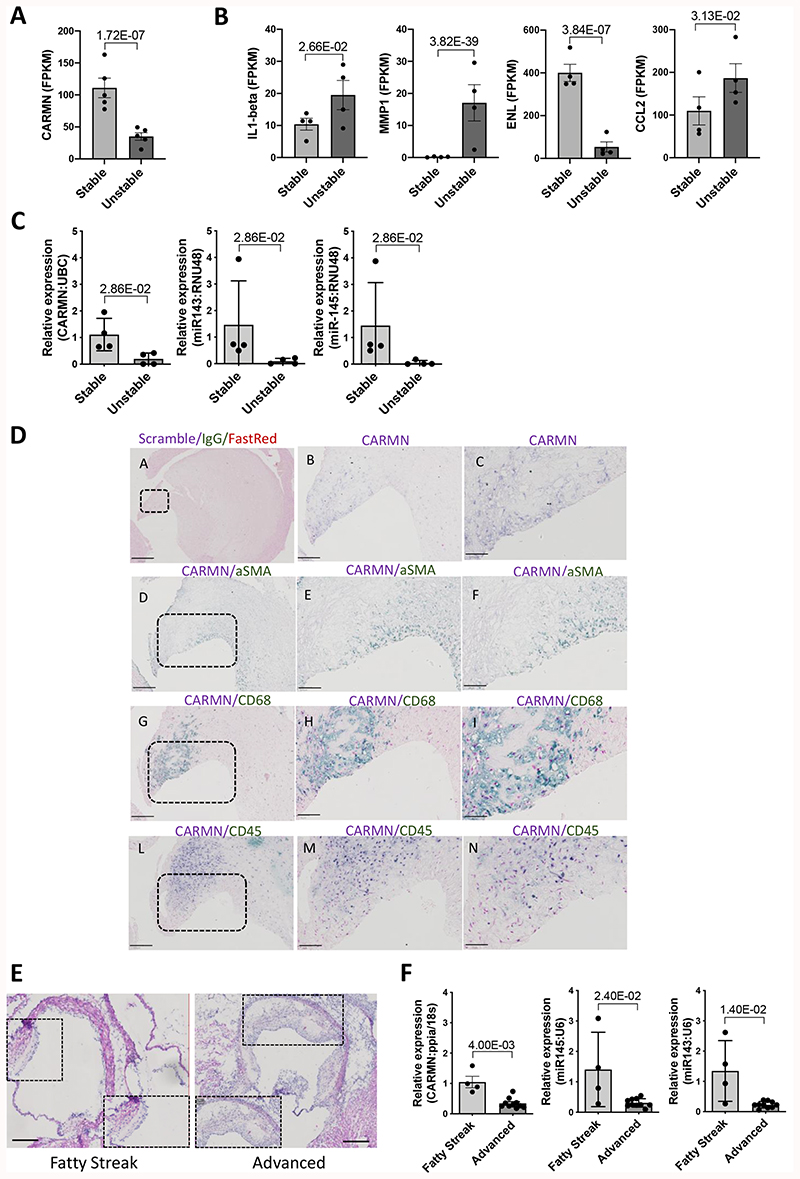
A) Expression level of CARMN and B) Expression level of MMP1, ELN, IL1-beta, CCL2 as FPKM in paired, stable (n=4) and unstable (n=4) human plaque segments retrieved after endarterectomy from 4 symptomatic patients. P value obtained based on the raw read counts using DESeq2. C) Expression of CARMN and miR143/145 in human stable and unstable plaques isolated through endarterectomy (n=4) determined by qRT-PCR. Mann-Whitney was used to assess statistical significance indicated with p values. D) Representative bright field images of in-situ detection of CARMN co-localizing with α-SMA, CD68 or CD45 signal in plaques obtained from carotid artery derived from symptomatic patients at carotid endarterectomy. Pictures were acquired consecutively at 4X, 10X and 40X magnification Scale bar 50μm. E) Representative Haematoxylin & Eosin staining of aortic roots isolated from LDLR-/- mice. Pictures were acquired with 4x and 10X magnification. Scale bar 100μm. F) Expression levels of CARMN and miR143/145 in fatty streak (n=4) and advanced murine plaques (n=11) isolated by Laser Capture Microdissection. Mann-Whitney was used to assess statistical significance indicated with p values.
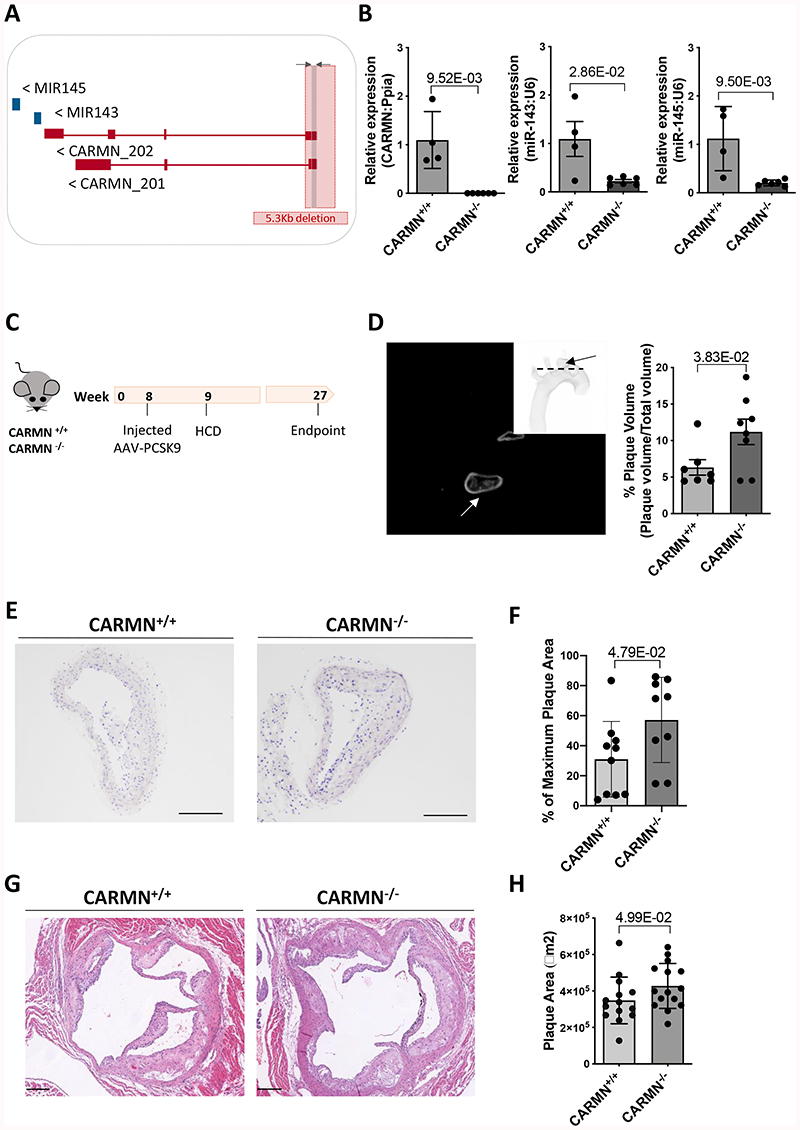
Schematic representation of CARMN locus located on mouse chromosome 18 and the CRISPR/Cas9 deletion of the first exon and 4.8 kilobases of the promoter (total 5 kilobases). The arrows next to each transcript name, indicate the direction of transcription. The grey arrows and box indicate where common primers to both isoforms were designed. B) Validation of knockout strategy by qRT-PCR using common primer set performed on the aortic arches of CARMN+/+ (n=4) and CARMN-/- (n=6) mice. Mann-Whitney was used to assess statistical significance indicated with p values. C) Schematic workflow used for the induction of mouse atherosclerosis using AAV8-mediated overexpression of PCSK9 and high cholesterol diet in CARMN+/+ and CARMN-/- animals. D) Representative tomographic reconstruction of pictures obtained by Optical Projection Tomography (black picture) and non-tomographic projection of the mouse aortic arch (white picture). The arrows indicate the brachiocephalic artery. Quantification of the plaque volumes in CARMN+/+ (n=7) and CARMN-/- (n=8) animals performed using CTan software. Student’s t-test was used to assess statistical significance indicated with p values. E) Representative Haematoxylin & Eosin staining of cross-sections from brachiocephalic artery of CARMN+/+ and CARMN-/- animals. Pictures acquired at 10X magnification. Scale bar 200μm. F) Quantification of the plaque areas at the site of maximum lesion of brachiocephalic arteries in CARMN+/+ (n=10) and CARMN-/- (n=9) mice, performed using Fiji software. Student’s t-test was used to assess statistical significance indicated with p values. G) Haematoxylin & Eosin staining of cross-sections from aortic roots of wild type and CARMN-/-animals. Pictures acquired at 5X magnification. Scale bar 200μm. H) Quantification of plaque area of aortic roots of CARMN+/+ (n=14) and CARMN-/- (n=15) animals, performed using QuPath software. Student’s t-test was used to assess statistical significance indicated with p values.
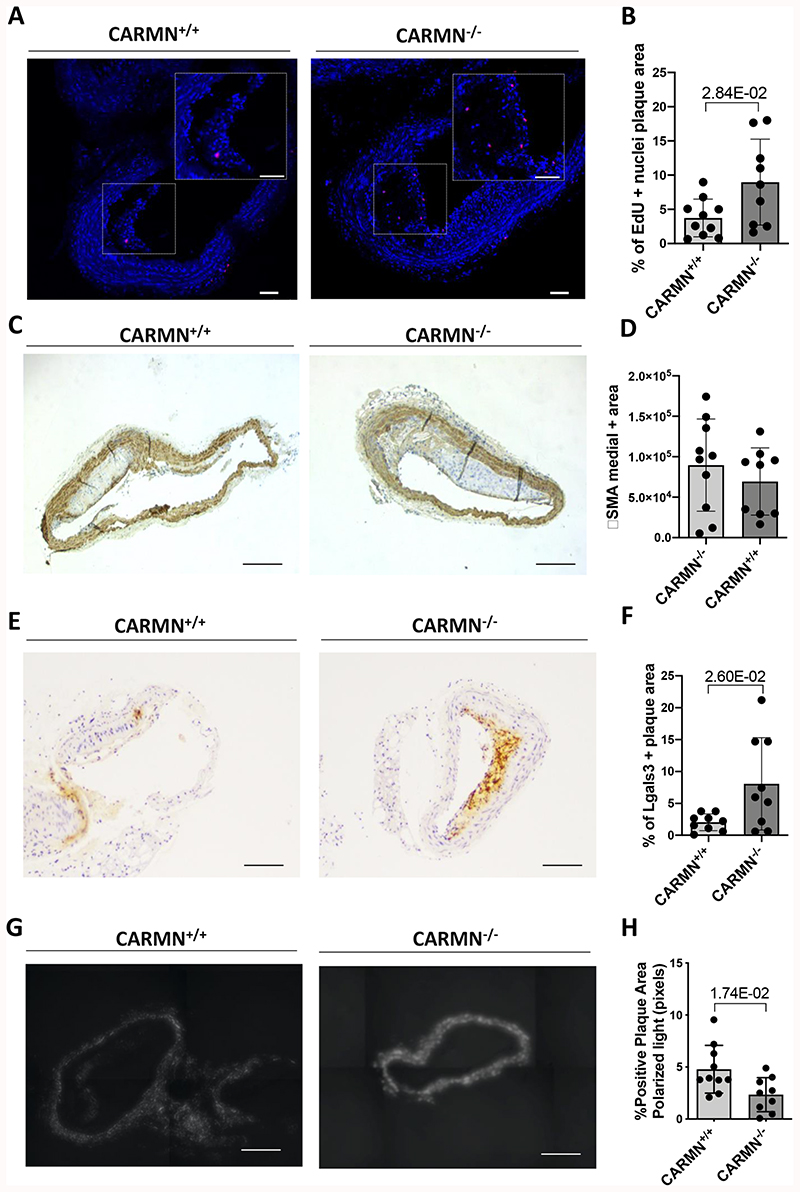
A) Representative EdU staining of proliferating cells in plaques from CARMN+/+ and CARMN-/- animals. Pictures were acquired with 10X magnification. Scale bar 80μm. B) Quantification of proliferating cells in plaques of CARMN+/+ (n=10) and CARMN-/- (n=9) animals. Values are expressed as % of positive nuclei over the total cells counted in the plaque. C) and E) Representative immunostainings and D) and F) quantification of the positive area for αSMA and Lgals3 staining respectively in the plaques of CARMN+/+ (n=10) and CARMN-/- (n=9) animals. Pictures acquired at 10X magnification. Scale bar 200μm. G) Representative picrosirius red staining and H) quantification of collagen content in the plaques of CARMN+/+ (n=10) and CARMN-/-(n=9) animals. The pictures were acquired by polarized light microscopy at 10X magnification. Scale bar 200μm. Student’s t-test was used to assess statistical significance indicated with p values.
Comment in
-
Where in the (lncRNA) World Is CARMN?: Safeguarding Against Vascular Dysfunction.Circ Res. 2021 Apr 30;128(9):1276-1278. doi: 10.1161/CIRCRESAHA.121.319150. Epub 2021 Apr 29. Circ Res. 2021. PMID: 33914599 Free PMC article. No abstract available.
References
-
- Owens GK, Kumar MS, Wamhoff BR. Molecular regulation of vascular smooth muscle cell differentiation in development and disease. Physiol Rev. 2004;84:767–801. - PubMed
Publication types
MeSH terms
Substances
Grants and funding
LinkOut - more resources
Full Text Sources
Other Literature Sources
Medical
Molecular Biology Databases
